. 2024 Sep 17;15(1):8134.
doi: 10.1038/s41467-024-52394-3.

Basal-to-inflammatory transition and tumor resistance via crosstalk with a pro-inflammatory stromal niche

Affiliations

Basal-to-inflammatory transition and tumor resistance via crosstalk with a pro-inflammatory stromal niche

Nancy Yanzhe Li et al. Nat Commun. .

Abstract

Cancer-associated inflammation is a double-edged sword possessing both pro- and anti-tumor properties through ill-defined tumor-immune dynamics. While we previously identified a carcinoma tumor-intrinsic resistance pathway, basal-to-squamous cell carcinoma transition, here, employing a multipronged single-cell and spatial-omics approach, we identify an inflammation and therapy-enriched tumor state we term basal-to-inflammatory transition. Basal-to-inflammatory transition signature correlates with poor overall patient survival in many epithelial tumors. Basal-to-squamous cell carcinoma transition and basal-to-inflammatory transition occur in adjacent but distinct regions of a single tumor: basal-to-squamous cell carcinoma transition arises within the core tumor nodule, while basal-to-inflammatory transition emerges from a specialized inflammatory environment defined by a tumor-associated TREM1 myeloid signature. TREM1 myeloid-derived cytokines IL1 and OSM induce basal-to-inflammatory transition in vitro and in vivo through NF-κB, lowering sensitivity of patient basal cell carcinoma explant tumors to Smoothened inhibitor treatment. This work deepens our knowledge of the heterogeneous local tumor microenvironment and nominates basal-to-inflammatory transition as a drug-resistant but targetable tumor state driven by a specialized inflammatory microenvironment.


Conflict of interest statement

The authors declare no competing interests.

Figures

Fig. 1
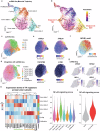
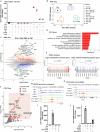
Fig. 1. Integrated single cell analysis of human BCC tumors identifies a tumor state (TS3) enriched by drug treatment.
a Schematic workflow of high-resolution, multi-modal analysis of human BCC patient tumor samples. b UMAP plot of scRNA-Seq data consisting of 11041 cells from two naïve and two drug-treated human BCC tumor epithelial cells with six distinct clusters. Tumor state 3 is circled. c Percentage distribution of six tumor cell states in two naïve and two drug-treated human BCC tumor epithelial cells. d Feature plots highlighting the expression of key markers (CHI3L1, TAGLN, ITGAV and VCAM1) of tumor state 3 as well as expression of hedgehog signaling driver GLI1. e UMAP plot of scRNA-Seq data consisting of 8840 cells from two naïve human BCC tumor epithelial cells with seven distinct clusters. f Heatmap showing the marker genes for the various tumor epithelial clusters from (e). Tumor state 3 cluster marker gene signature is highlighted in green while BST cluster marker gene signature is highlighted in orange. g Violin plot of Tumor state 3 (TS3) signature gene scoring across tumor epithelial cells from 17 human BCC patients across different studies,,. h Survival curves between patients with high and low expression levels of Tumor state 3 (TS3) gene signature. The 95% confidence intervals are shown as dotted lines. PAAD patients: 89 patients in high and low TS3 signature groups; HNSC patients: 259 patients in high and low TS3 signature groups; MESO patients: 41 patients in high and low TS3 signature groups; LGG patients: 257 patients in high and low TS3 signature groups. PAAD: Pancreatic adenocarcinoma; HNSC: Head and Neck squamous cell carcinoma; MESO: Mesothelioma; LGG: Brain Lower Grade Glioma. a is created with BioRender.com released under a Creative Commons Attribution-NonCommercial-NoDerivs 4.0 International license. Source data are provided as a Source Data file.
Fig. 2
Fig. 2. Tumor epithelial basal to inflammatory transition (BIT) is regulated by inflammatory NF-κB family of transcription factors.
a Monocle trajectory projection of 8840 tumor epithelial cells from two naïve human BCC tumors with the same cluster information from (e). b Pseudotime analysis of 8840 tumor epithelial cells from two naïve human BCC tumors with the same UMAP projection from (a). c UMAP plot of scATAC-Seq data consisting of 8163 tumor epithelial cells from two naïve human BCC tumors with five distinct clusters. d UMAP plot of scRNA-Seq and scATAC-Seq data integration consisting of 8163 tumor epithelial cells from two naïve human BCC tumors. e Feature plots of the GeneIntegrationMatrix for CHI3L1, TAGLN, TACSTD2 and LY6D for scRNA-Seq and scATAC-Seq data integration of tumor epithelial cells from two naïve human BCC tumors as shown in (d). f Feature plot of the motif DeviationMatrix for NFKB1 motif in scATAC-Seq data with the same UMAP projection from (c). The higher the deviation score indicates greater enrichment of the TF motif. g Feature plots highlighting the expression of NF-κB family of transcription factors (NFKB1, NFKB2, RELA and RELB) in tumor state 3 (circled) for scRNA-Seq data with the same UMAP projection from (e). h Heatmap showing the expression of transcription factor (TF) regulators across tumor epithelial states from two naïve human BCC tumors from (e). TF regulators highly expressed in Tumor state 3 (TS3) are highlighted in green while TF regulators highly expressed in BST cluster are highlighted in orange. i Violin plot of NF-κB signaling signature gene scoring across tumor epithelial cells from two naïve human BCC tumors from (e). j Violin plot of NF-κB signaling signature gene scoring across tumor epithelial cells from two naïve and two drug-treated human BCC tumors from (b).
Fig. 3
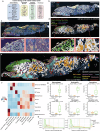
Fig. 3. BIT tumor epithelium is localized in a pro-inflammatory niche enriched with myeloid cells.
a CODEX antibody panel consisting of 41 protein markers of interest. b Representative whole slide CODEX image of human BCC tumor depicted as a six-color overlay image (n = 4 CODEX samples). Scale bar, 1000 μm. c Representative whole slide CODEX image and higher-magnification six-color overlay images of human BCC tumor (n = 4 CODEX samples). Scale bar, 1000 μm (whole slide image) and 100 μm (higher-magnification images). d Representative whole slide image and higher-magnification images depicting cell types annotated by CELESTA. e Identification of nine distinct spatial communities based on CELESTA-assigned cell types and their respective frequencies within each spatial community. f Heatmap depicting cell type enrichment of CELESTA-assigned cell types within each spatial community. g Absolute proportions (%) of macrophages, neutrophils, vasculature, T cells, fibroblasts, and dendritic cells in each of the three tumor spatial communities: Tumor (non-BIT/BST), BST and BIT. The center corresponds to the median value. The lower and upper hinges correspond to the 25th and 75th percentiles. The upper whisker extends from the hinge to the largest value no further than 1.5*IQR (Inter-Quartile Range). The lower whisker extends from lower hinge to the smallest value at most 1.5*IQR. P-value calculated using non-parametric Kruskal-Wallis test for multiple groups. The statistical comparisons were performed across all four samples included in the CODEX spatial analysis. h Density plots depicting distributions of the distances from the three tumor types: tumor (non-BIT/BST), BST, and BIT, to nearest macrophages and neutrophils across all four samples. Vertical dotted lines represent the mean distance for each tumor community. Source data are provided as a Source Data file.
Fig. 4
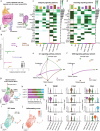
Fig. 4. TREM1 myeloid cell-derived IL1 and OSM signaling correlates with BIT.
a UMAP plot of tumor epithelium and myeloid populations consisting of 11375 cells for CellChat analysis (n = 2 naïve human BCC tumors). b Scatter plot depicting the dominant senders and receivers of outgoing and incoming interactions respectively in a 2D space based on signaling role analysis on the aggregated cell-cell communication network from all signaling pathways from data in (a). c Heatmap depicting signals contributing most to outgoing signaling of each cell group based on signaling role analysis on the aggregated cell-cell communication network from all signaling pathways. d Heatmap depicting signals contributing most to incoming signaling of each cell group based on signaling role analysis on the aggregated cell-cell communication network from all signaling pathways. e IL1 signaling pathway network from myeloid cells to BIT tumor epithelium. f OSM signaling pathway network from TREM1 myeloid cells to BIT and proliferative tumor epithelium. g UMAP plot of scRNA-Seq data of myeloid cell populations consisting of 3144 cells from four naïve human BCC tumors with five distinct clusters. h Percentage distribution of five myeloid cell populations across four naïve human BCC tumors in (g). Asterisk(*) indicates patient samples that were also analyzed in Figs. 1–3. i UMAP plot of scRNA-Seq data of myeloid cell populations consisting of 3144 cells from four naïve human BCC tumors in (g) colored by abundance of BIT tumor epithelium. j Feature plot of inflammatory signature gene scoring across myeloid cell populations from four naïve human BCC tumors in (g). k Stacked violin plot of expression levels of various key myeloid-associated markers for each of the five myeloid clusters from (g). Source data are provided as a Source Data file.
Fig. 5
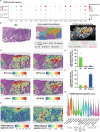
Fig. 5. BIT tumor epithelium arises in a specialized inflammatory environment defined by tumor-associated TREM1 myeloid cell gene signature.
a Dot plot depicting the expression levels of TREM1 myeloid cluster markers in the 16-gene TREM1 myeloid signature across myeloid cell populations in (g) stratified by abundance of BIT tumor epithelium in four naïve human BCC tumors. b Hematoxylin and Eosin (H&E) staining image (left), spatial DimPlot of Visium spatial Seurat clusters (middle) and CODEX spatial communities (right) of the same human BCC tumor (n = 2 patients). Scale bar = 500 μm. c Spatial Seurat gene signature scoring for BIT signature (top left) and BST signature (top right) on human BCC tumor. Spatial feature plots of CHI3L1 (bottom left) and TACSTD2 (bottom right) for human BCC tumor. d Spatial Seurat gene signature scoring for TREM1 myeloid signature and TREM2 myeloid signature on human BCC tumor. e Quantification of percentage of spots with high TREM1 myeloid signature score (top 10 percentile of signature score in Fig. 5d) in each of the three spatial Seurat clusters: BIT, BST and Stroma 1. Height of the bar represents the average percentage in each spatial Seurat cluster (n = 2 patients). f Quantification of percentage of spots with high TREM2 myeloid signature score (top 10 percentile of signature score in Fig. 5d) in each of the three spatial Seurat clusters: BIT, BST and Stroma 1. Height of the bar represents the average percentage in each spatial Seurat cluster (n = 2 patients). g Violin plot of TREM1 myeloid signature gene scoring across myeloid cells from naïve human BCC tumors, healthy skin tissue, eczema skin tissue, psoriatic skin tissue, alopecia areata scalp tissue, colorectal cancer and many other different types of cancer. Source data are provided as a Source Data file.
Fig. 6
Fig. 6. Il1 and Osm combination treatment induces BIT in BCC cells in vitro via NF-κB.
a Chil1 expression fold change upon 24-h treatment with various recombinant ligand proteins compared to PBS control in ASZ-001 (n = 2 biological replicates). b Principal-component analysis (PCA) of bulk RNA-seq data obtained from ASZ-001 upon treatment with various recombinant ligand proteins at 24-h and 48-h timepoints compared to PBS control (n = 2 biological replicates). c Scatterplot of genes with differential expression upon 48-h Il1a + Osm treatment against control (n = 2 biological replicates). Genes with expression fold change > 1 and p < 0.05 are marked in red, genes with expression fold change < −1 and p < 0.05 are marked in blue. Genes with expression fold change > 5 and p < 0.05 or fold change < −5 and p < 0.05 are marked in green and labeled with gene names. A total of 25120 genes were included in the differential gene expression analysis. Two-sided Wald test was used to compute p-value statistics between the control and treatment groups. P-values were corrected for multiple testing using Benjamini and Hochberg method. d Gene Ontology (GO) Terms associated with the top 100 upregulated genes upon 48-h Il1a + Osm treatment against control. A total of 26994 biological process terms were included in the GO Terms analysis. One-sided Fisher’s exact test was used to compute p-value statistics for each GO Term. P-values were corrected for multiple testing using Benjamini and Hochberg method. e Gene set enrichment analysis (GSEA) plots of inflammatory response gene signature (red) and Hallmark Hedgehog gene signature (blue) in RNA-Seq data obtained from ASZ-001 upon 48-h Il1a + Osm treatment against control (n = 2 biological replicates). A total of 13522 genes were included in the GSEA analysis. P-values were calculated using one-sided ROAST gene set testing. P-values were corrected for multiple testing using Benjamini and Hochberg method. f Motif enrichment analysis on ATAC-Seq peaks with increased chromatin accessibility at the promoters of upregulated genes upon 48-h Il1a + Osm treatment against control (n = 2 biological replicates). Significantly enriched motifs (fold enrichment ≥ 1.5 and -log10(p-value) ≥ 3) are highlighted in red. A total of 436 known motifs from HOMER Motif Database were included in the motif analysis. P-values were calculated using HOMER analysis pipeline. P-values were corrected for multiple testing using Benjamini and Hochberg method. g Example tracks of NFKB1 genomic occupancy sites near the Chil1 locus from CUT&RUN sequencing data obtained from ASZ-001 upon 48-hour Il1a + Osm treatment against IgG and PBS controls (n = 2 biological replicates). h Example tracks of accessible chromatin sites at the Chil1 locus from ATAC-Seq data obtained from ASZ-001 upon 48-hour Il1a + Osm treatment against control (n = 2 biological replicates). i Chil1 expression fold change upon 24 h Il1 + Osm ligand cocktail treatment, 24 h Il1 + Osm ligand cocktail treatment followed by cytokine withdrawal for 48 h, and 24 h Il1 + Osm ligand cocktail treatment followed by cytokine withdrawal and Il1 receptor antagonist treatment for 48 h respectively, compared to PBS control in ASZ-001 (n = 4 biological replicates). Data are presented as mean values +/- SD. j Chil1 expression fold change upon 24 h Il1 + Osm ligand cocktail treatment with or without 6 h pretreatment with NFKB inhibitors JSH23 or withaferin A (WFA) or JAK/STAT3 inhibitor ruxolitinib respectively in ASZ-001 (n = 4 biological replicates). Data are presented as mean values +/- SD. Source data are provided as a Source Data file.
Fig. 7
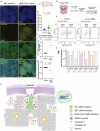
Fig. 7. IL1 and OSM combination treatment induces BIT in vivo and ex vivo, leading to resistance to SMOi therapy.
a Schematic representation of in vivo intra-tumoral Il1a + Osm ligand cocktail (or vehicle control) injection on allograft secondary BCC tumors in Nod-Scid mice derived from primary mouse BCC tumors from Ptch1+/-;p53f/f;K14Cre-ER;RFPf-s-f mouse model (far right). Intra-tumoral injections were performed at 3-day interval for 18 days. Left panels show representative RNAscope images of DAPI, Chil1 RNA and K14 protein staining of BCC tumors upon vehicle control injection; Right panels show representative RNAscope images of DAPI, Chil1 RNA and K14 protein staining of BCC tumors upon Il1a + Osm ligand cocktail injection. Experiments were performed in n = 3 mice (6 tumors). Scale bar = 250 μm. b Quantification of Chil1 RNA expression shown in (a) by pixel intensity measurements. Horizontal bars and error bars represent the mean +/- SD. P-value calculated using two-sided independent sample T test (****p < 0.0001) (n = 2180 pixel measurements in control group, n = 1799 pixel measurements in Il1a + Osm group). c Chil1 expression fold change upon Il1 + Osm ligand cocktail treatment compared to PBS control in mouse primary BCC tumor-derived organoids (n = 3 biological replicates). P-value calculated using two-sided independent sample T test (*p < 0.05). d Human patient-derived organoid (PDO) treatment strategies with IL1A + OSM or vehicle control. e Flow cytometry analysis showing levels of ApoGreen in the EPCAM+ cells from human PDOs. f Fold change in ApoGreen percentage between vehicle control and IL1 + OSM treated PDOs (n = 6 independent BCC patient tumors). g P-value statistic of fold change in ApoGreen percentage calculated using two-sided independent sample T test (**p < 0.01) (n = 6 independent BCC patient tumors). h Summary of overall model. Figure panels 7a, d,  f and 7 h are created with BioRender.com released under a Creative Commons Attribution-NonCommercial-NoDerivs 4.0 International license. Source data are provided as a Source Data file.

References

    1. Miller, K. D. et al. Cancer treatment and survivorship statistics, 2022. CA Cancer J. Clin.72, 409–436 (2022). - PubMed
    1. Mcmillin, D. W., Negri, J. M. & Mitsiades, C. S. The role of tumour-stromal interactions in modifying drug response: Challenges and opportunities. Nat. Rev. Drug Discov.12, 217–228 (2013). - PubMed
    1. Klemm, F. & Joyce, J. A. Microenvironmental regulation of therapeutic response in cancer. Trends Cell Biol.25, 198–213 (2015). - PMC - PubMed
    1. Hanahan, D. & Coussens, L. M. Accessories to the crime: functions of cells recruited to the tumor microenvironment. Cancer Cell21, 309–322 (2012). - PubMed
    1. El-Sayes, N., Vito, A. & Mossman, K. Tumor heterogeneity: a great barrier in the age of cancer immunotherapy. Cancers (Basel)13, 1–14 (2021). - PMC - PubMed

Publication types

MeSH terms

Substances