. 2024 Sep 17;15(1):8170.
doi: 10.1038/s41467-024-52414-2.

Longitudinal deep neural networks for assessing metastatic brain cancer on a large open benchmark

Affiliations

Longitudinal deep neural networks for assessing metastatic brain cancer on a large open benchmark

Katherine E Link et al. Nat Commun. .

Abstract

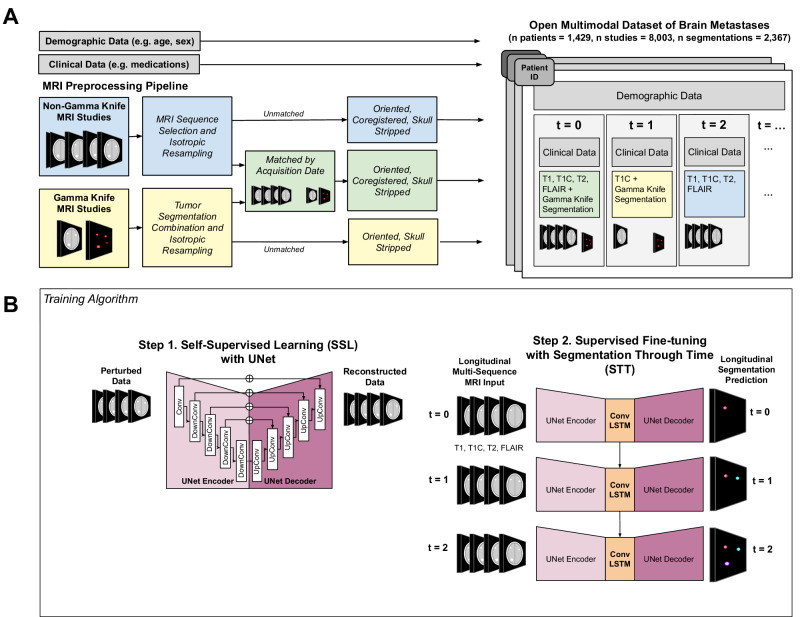
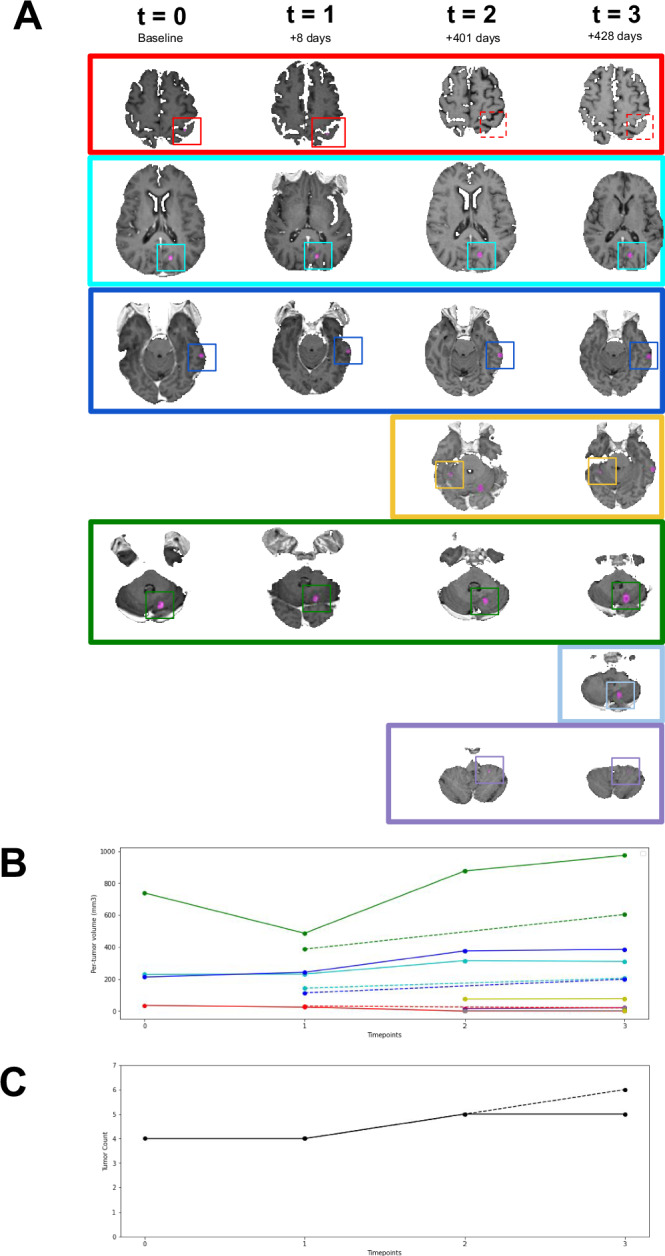
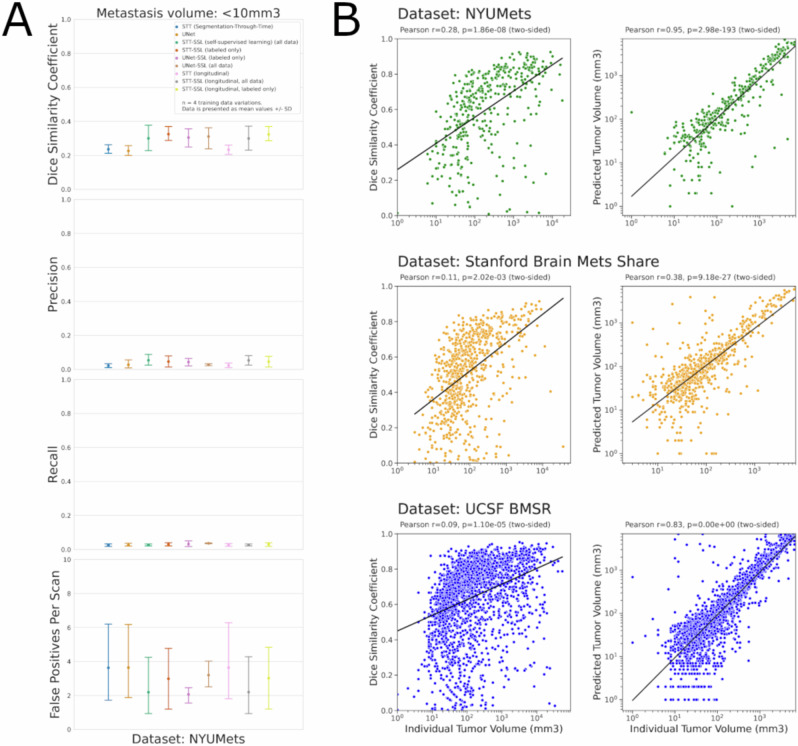
The detection and tracking of metastatic cancer over the lifetime of a patient remains a major challenge in clinical trials and real-world care. Advances in deep learning combined with massive datasets may enable the development of tools that can address this challenge. We present NYUMets-Brain, the world's largest, longitudinal, real-world dataset of cancer consisting of the imaging, clinical follow-up, and medical management of 1,429 patients. Using this dataset we developed Segmentation-Through-Time, a deep neural network which explicitly utilizes the longitudinal structure of the data and obtained state-of-the-art results at small (<10 mm3) metastases detection and segmentation. We also demonstrate that the monthly rate of change of brain metastases over time are strongly predictive of overall survival (HR 1.27, 95%CI 1.18-1.38). We are releasing the dataset, codebase, and model weights for other cancer researchers to build upon these results and to serve as a public benchmark.


Conflict of interest statement

The authors declare the following competing interests. E.K.O. reports consulting with Sofinnova Inc., Google Inc., income from Merck & Co., and Mirati Therapeutics, and equity in Artisight Inc. D.O. is a consultant and equity holder of Invenio Inc. D.K. reports consulting with Elekta Inc. K.E.L. is currently employed by NVIDIA. L.Y.J., M.N., S.N., J.D.A., K.B., T.Q., V.C., E.Y., and J.G.G. declare no competing interests. The work presented herein was performed exclusively within the NYU Langone Health System.

Figures

Fig. 1
Fig. 1. The creation of the NYUMets dataset and the segmentation-through-time model for understanding cancer dynamics.
A The NYUMets dataset brought together multiple resources within a large academic medical center spread across the Cancer Center clinical database, Radiology picture and archiving system (PACS), Radiation Oncology treatment planning system, and the hospital electronic health records (EHR) systems. B We designed a deep learning model to explicitly incorporate the longitudinal segmentations and imaging data called segmentation-through time ›(STT). STT has a UNet backbone with a recurrent neural network (RNN) to carry learned representations forward across timepoints. While there are many possible ways of utilizing this unique, real-world longitudinal data, we present this as an initial benchmark attempt. In order to maximize the utility of the unlabeled data, we also experimented with self-supervised learning (SSL), where we first pretrained the STT and UNet models with a reconstruction task before finetuning it for the segmentation task.
Fig. 2
Fig. 2. Metastatic brain tumor tracking using the NYUMets API.
A The NYUMets API provides autosegmentation and tracking of metastases across timepoints, enabling more efficient investigation of patient-level and population-level cancer dynamics. Metastase segmentations were inferred using the SSL STT model and longitudinal T1 post-contrast inputs. The model-generated segmentations are shown in pink. Each individual tumor segmentation is assigned a color. B Lines corresponding to each tumor’s volume over time are color-matched to (A). The dotted lines represent the volumes from gold-standard segmentations. C The total tumor count, shown here, and other aggregative metrics, such as total intracranial volume, can be plotted over time as well.
Fig. 3
Fig. 3. Longitudinal deep learning results.
A We evaluated the models across three primary metrics: Dice similarity coefficient, recall, and false positives per scan (FP/scan). Our models show state-of-the-art performance on segmentation and detection of very small (<10 mm3) metastases on the NYUMets test dataset. N = 4 experiments with the four training data variations (T1 post vs T1 post + T2, gold labels vs. gold + silver labels). B We plotted the relationship between the Dice similarity coefficient and individual tumor volumes, as well as predicted tumor volumes and individual tumor volumes (one green dot = one NYUMets segmented metastasis) after inference using the STT model. These relationships were also demonstrated on our external test sets, Stanford BrainMetsShare and UCSF Brain Metastases Stereotactic Radiosurgery (BMSR) dataset, using the same model (one orange dot = one Stanford segmented metastasis). Pearson correlations were performed with the two-sided alternative hypothesis.
Fig. 4
Fig. 4. Metastatic brain cancer dynamics in the NYUMets dataset.
A Line graph demonstrating rates of new tumors per patient with the X-axis representing time in months and the y-axis as the number of cumulative tumors treated. Each line is an individual patient connecting two points: the total number of tumors treated to date at t_0 (initial gamma knife treatment) and t_1 (second gamma knife treatment), allowing the slope to equal the rate of new tumor influx, i.e., the number of new tumors developed between t_0 and t_1 divided by time in months. The median time between t_0 and t_1 was 5.5 months (IQR 2.5–10.8 months). Patients were segmented into quartiles based on the rate of tumor influx, each represented by a color (Quartile 1 = Blue, Quartile 2 = Red, Quartile 3 = Green, Quartile 4 = Yellow). B Kaplan–Meier curve demonstrating these rates of tumor influx were highly predictive of overall survival (log-rank: p < 0.001). C Forest plot of multivariable cox-regression analysis. Controlling for tumor histology, performance status, age, and initial tumor burden demonstrates that the rate of monthly tumor changes as being strongly predictive of OS (HR 1.27 per doubling rate of new tumor development, p < 0.001). The measure of the center for error bars is the hazard ratio, with bars extending to 95% CI.

References

    1. Acosta, J. N., Falcone, G. J., Rajpurkar, P. & Topol, E. J. Multimodal biomedical AI. Nat. Med.28, 1773–1784 (2022). - PubMed
    1. Acosta, J. N., Falcone, G. J. & Rajpurkar, P. The need for medical artificial intelligence that incorporates prior images. Radiology10.1148/radiol.212830 (2022). - PubMed
    1. Suh, C. H., Jung, S. C., Kim, K. W. & Pyo, J. The detectability of brain metastases using contrast-enhanced spin-echo or gradient-echo images: a systematic review and meta-analysis. J. Neurooncol.129, 363–371 (2016). - PubMed
    1. Litière, S., Collette, S., de Vries, E. G. E., Seymour, L. & Bogaerts, J. RECIST - learning from the past to build the future. Nat. Rev. Clin. Oncol.14, 187–192 (2017). - PubMed
    1. Abramson, R. G., McGhee, C. R., Lakomkin, N. & Arteaga, C. L. Pitfalls in RECIST data extraction for clinical trials: beyond the basics. Acad. Radiol.22, 779–786 (2015). - PMC - PubMed

Publication types

LinkOut - more resources