. 2024 Sep 17;14(1):21698.
doi: 10.1038/s41598-024-70782-z.

Understanding processes underlying cross-taxon congruence in species composition along elevational gradients

Affiliations

Understanding processes underlying cross-taxon congruence in species composition along elevational gradients

Carolina S Ramos et al. Sci Rep. .

Abstract

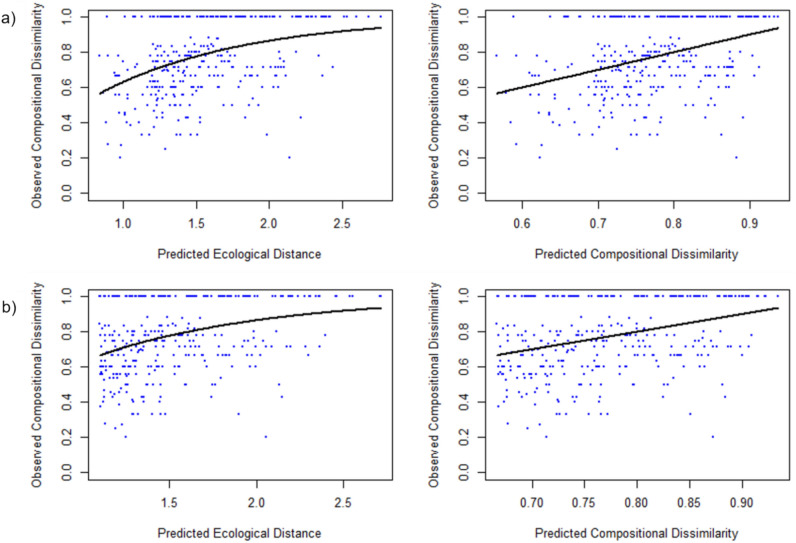
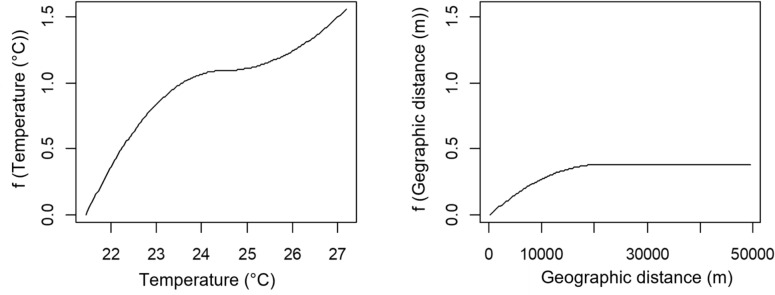
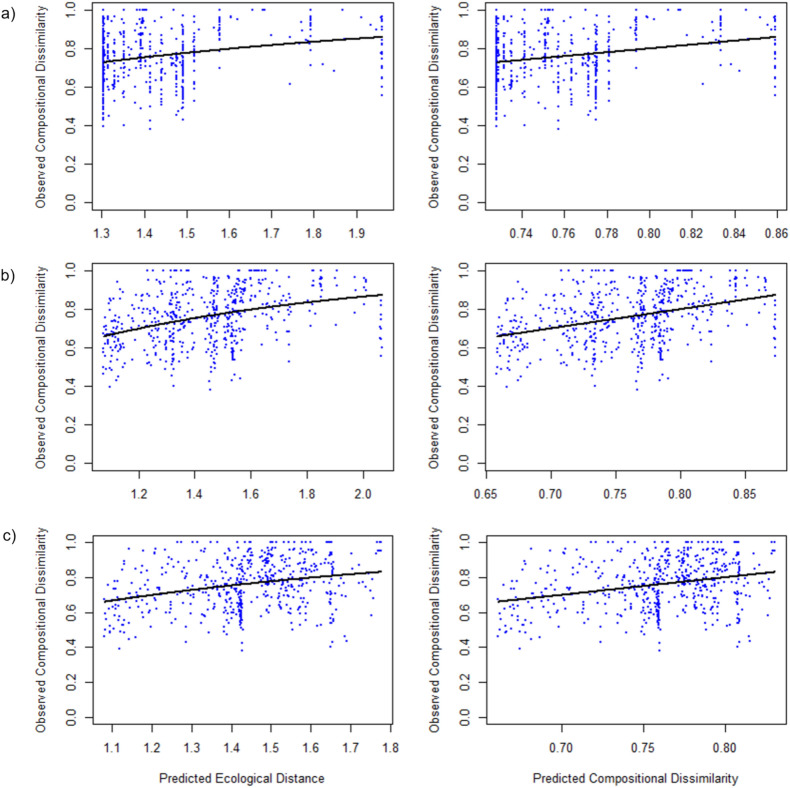
Changes in species diversity of different taxa along environmental gradients are usually correlated, resulting in a pattern called cross-taxon congruence. This pattern can be due to functional relationships between taxa, a common response to niche-related processes, or stochastic processes. However, it remains unclear the extent to which they contribute to the association among patterns of changes in species composition, (i.e., beta diversity), and whether these changes are related to species nestedness and turnover. Here we described patterns of change in the taxonomic composition of plant and orthopteran assemblages along an elevational gradient in Cordoba province, central Argentina. We assessed cross-taxon congruence and identified the main environmental variables accounting for such patterns. Mantel correlations showed congruence between the patterns of taxonomic dissimilarity of plants and orthopterans. According Generalized disiimilarity models (GDM) the main environmental variables driving the patterns were temperature for both taxa, and changes in soil nutrient content for plants, spatial effects were also found. Beta diversity was mainly due to species turnover for orthopterans and plants, indicating replacement by species adapted to elevational conditions. Niche-related process, such as environmetal filtering, along with neutral processes may have contributed to cross-taxon congruence in beta diversity.


Conflict of interest statement

The authors declare no competing interests.

Figures

Fig. 1
Fig. 1
Elevational dissimilarity patterns of orthopteran and plant species composition for the mountains.
Fig. 2
Fig. 2
Orthopteran observed dissimilarity vs GDM-predicted ecological distance, points are each site pair, the line indicating the model predicted dissimilarity (left) and Observed dissimilarity vs. GDM-predicted dissimilarity, featuring the line of equality for reference (right). (a) Model with temperature dissimilarity and geographic distance; (b) model with temperature dissimilarity.
Fig. 3
Fig. 3
Orthopteran GDM fitted spline functions for the predictor variables included in the model with lowest AIC. On the x-axis, variables are in their native scales and on the y-axis, the transformed GDM values. The overall importance of each predictor is indicated by the maximum value of the spline function (y-axis). Steeper slopes indicate greater dissimilarity per unit change in the predictor variable.
Fig. 4
Fig. 4
Plant observed dissimilarity vs GDM-predicted ecological distance, points are each site pair, the line indicating the model predicted dissimilarity (left) and Observed dissimilarity vs. GDM-predicted dissimilarity, featuring the line of equality for reference (right). (a) Model with soil nutrient component dissimilarity; (b) Model with soil nutrient component dissimilarity and geographic distance; (c) model with temperature dissimilarity.
Fig. 5
Fig. 5
Plants GDM fitted spline functions for the predictor variables included in the models with lowest AIC. On the x-axis, variables are in their native scales and on the y-axis, the transformed GDM values. The overall importance of each predictor is indicated by the maximum value of the spline function (y-axis). Steeper slopes indicate greater dissimilarity per unit change in the predictor variable.

References

    1. Gioria, M., Bacaro, G. & Feehan, J. Evaluating and interpreting cross-taxon congruence: Potential pitfalls and solutions. Acta Oecologica37, 187–194 (2011).
    1. Rooney, R. C. & Azeria, E. T. The strength of cross-taxon congruence in species composition varies with the size of regional species pools and the intensity of human disturbance. J. Biogeogr.42, 439–451 (2015).
    1. McKnight, M. W. et al. Putting beta-diversity on the map: Broad-scale congruence and coincidence in the extremes. PLoS Biol.5, 2424–2432 (2007). - PMC - PubMed
    1. Ramos, C. S., Picca, P., Pocco, M. E. & Filloy, J. Disentangling the role of environment in cross-taxon congruence of species richness along elevational gradients. Sci. Rep.11, 4711 (2021). - PMC - PubMed
    1. Westgate, M. J., Barton, P. S., Lane, P. W. & Lindenmayer, D. B. Global meta-analysis reveals low consistency of biodiversity congruence relationships. Nat. Commun.5, 1–8 (2014). - PubMed

LinkOut - more resources