. 2024 Sep 17;14(1):21701.
doi: 10.1038/s41598-024-72174-9.

Y-box binding protein 1/cyclin A1 axis specifically promotes cell cycle progression at G2/M phase in ovarian cancer

Affiliations

Y-box binding protein 1/cyclin A1 axis specifically promotes cell cycle progression at G2/M phase in ovarian cancer

Yuichi Murakami et al. Sci Rep. .

Abstract

Y-box binding protein 1 (YBX1) promotes oncogenic transformation and tumor growth. YBX1 plays a role in regulation of cell cycle promotion via upregulation of cell cycle-related genes. In ovarian cancer, YBX1 also promotes tumor growth, but the mechanisms of YBX1 in cell growth and cell cycle in ovarian cancer remain not to be fully understood. Here, we investigated whether YBX1-dependent cancer cell proliferation was specifically associated with expression of cell cycle related genes in ovarian cancer. Protein and mRNA expression levels of YBX1 and cell cycle-related genes in ovarian cancer cell lines and tissues were determined by western blot analysis, immunohistochemical analysis and reverse transcription-quantitative PCR. Cell cycle analysis was performed by flow cytometry. Luciferase assay and Chromatin immunoprecipitation assay were used to investigate a transcriptional function of YBX1. YBX1 silencing induced marked growth suppression in 4 cell lines (group A), moderate suppression in 5 cell lines (group B), and no suppression in 3 cell lines (group C) among 12 ovarian cancer cell lines in culture. The YBX1 silencing induced cell cycle arrest at G2/M phase and suppressed expression of cyclin A1 gene in group A and B cell lines, but not in group C cell lines. Cyclin A1 silencing specifically suppressed cell proliferation in group A cell lines and partially in group B cell lines, but not at all in group C cell lines. YBX1 mRNA levels were significantly correlated with cyclin A1 mRNA levels in patients with high-grade serous carcinoma. Augmented YBX1 expression plays a key role in tumor growth promotion in ovarian cancer in its close association with cyclin A1.

Keywords: Cell cycle; Cyclin A1; G2/M arrest; Ovarian cancer; YBX1.


Conflict of interest statement

The authors declare no competing interests.

Figures
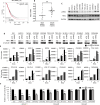
Fig. 1
Fig. 1
Growth inhibition in ovarian cancer cell lines following transfection with YBX1 siRNA#1. (A) Kaplan–Meier analysis of patients with HGSC showing high and low expression of YBX1 (Kaplan–Meier plotter database). (B) Comparison of 5-year survival rates in patients with HGSC showing high and low expression of YBX1 mRNA (GEO dataset accession no. GDS3297). **p = 0.00165. (C) Expression levels of YBX1 in 12 cell lines, as assessed by western blot analysis. (D) Western blot analysis showed that treatment with YBX1 siRNA#1 for 3 days inhibited the expression of YBX1 in all cell lines. (EF) Cell growth was examined on days 1, 3, and 5 after transfection with YBX1 siRNA#1 (E). Based on cell growth inhibition levels after transfection with siRNA#1 for 5 days, the 12 cell lines were classified into 3 groups: marked inhibition (group A), moderate inhibition (group B), and no inhibition (group C) (F). Student’s t-tests were used to compare differences between groups. p < 0.05; ∗∗p < 0.01. Data were represented as mean ± standard deviation for 3 independent experiments. Black, control siRNA; gray, YBX1 siRNA#1.
Fig. 2
Fig. 2
Effects of YBX1 siRNA#1 on the cell cycle. (AC) Percentages of cells in G0/G1 (A), S (B), and G2/M (C) phases following transfection with YBX1 siRNA #1 for 3 days. The percentages were determined by gating the FACS plot (Supplementary Figure S4). Student’s t-tests were used to compare differences between control siRNA and YBX1 siRNA#1 transfection. *p < 0.05; **p < 0.01. Error bars indicate standard deviations for 3 independent experiments.
Fig. 3
Fig. 3
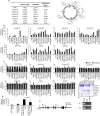
Effects of YBX1 siRNA on the expression levels of YBX1, cyclin A1, cyclin A2, cyclin B1, cyclin D1, cyclin E1, CDC6, and CDC20 mRNAs in ovarian cancer cell lines. (A) The eight selected genes are listed. Correlations of YBX1 with other genes are presented according to Spearman scores based on gene ontology analysis (TCGA database, n = 316) of HGSC, and the chromosomal locations of the 8 genes are indicated. The right panel of the illustrated model shows the sites of action of 7 cell cycle-related genes in the cell cycle. (B) RT-qPCR analysis showing mRNA expression levels of cell cycle-related genes in ovarian cancer cells. Student’s t-tests were used to compare differences between YBX1 siRNA#1-transfection groups and the control group. *p < 0.05; **p < 0.01. Error bars indicate standard deviations for 3 independent experiments. (C) RT-qPCR analysis showing mRNA expression levels of 7 genes in ovarian cancer cell lines following transfection with YBX1 siRNA#1 for 3 days. Expression levels were expressed as ratios relative to the expression in the corresponding negative control based on 3 independent assays. Student’s t-tests were used to compare differences between YBX1 siRNA#1-transfection groups and the control group. *p < 0.05; **p < 0.01. Error bars indicate standard deviations for 3 independent experiments. A heatmap plot of cell cycle-related genes from the comparison of the YBX1 siRNA#1-transfection group and the control group was presented. High expression levels in the YBX1 siRNA#1-transfection group are indicated in red, and low expression levels are indicated in blue. (D) JHOC-5 cells were transfected with luciferase reporter constructs containing the 1166 bp 5′-flanking region of the cyclin A1 gene with YBX1 siRNA#1 for 2 days. The firefly luciferase activity was normalized to the Renilla luciferase activity. Student’s t-tests were used to compare differences between YBX1 siRNA#1-transfection groups and the control group. **p < 0.01. Error bars indicate standard deviations for 3 independent experiments. (E) Schematic representation of potential YBX1 binding sites (Black boxes) and primer locations (arrows) used for ChIP assay in the promoter region of Cyclin A1 gene. (F) The YBX1 binding to the cyclin A1 promoter by ChIP assay in JHOC-5 cells.
Fig. 4
Fig. 4
Effects of YBX1 knockdown by siRNA#1 and siRNA#3 on protein expression of cell cycle-related genes. (A) Expression of cell cycle-related genes as assessed by western blot analysis. (B) Effects of YBX1 siRNAs (siRNA#1 and siRNA#3) on the expression of cell cycle-related genes in cell lines following transfection with YBX1 siRNAs for 3 days. α-tubulin was used as a loading control.
Fig. 5
Fig. 5
Effects of cyclin A1 knockdown by cyclin A1 siRNA on cell growth, and the expression levels of YBX1 and cell cycle-related genes in HGSC and OCCC tumors. (A) Cell growth of ovarian cancer cell lines on days 1, 3, and 5 after transfection with cyclin A1 siRNA. Student’s t-tests were used to compare differences between control- and cyclin A1 siRNA-transfected cells. *p < 0.05; **p < 0.01. Error bars indicate standard deviations for 3 independent experiments. (BD) Percentages of cells in G0/G1 (B), S (C), and G2/M (D) phases following transfection with cyclin A1 siRNA for 3 days. Percentages were determined by gating the FACS plot. Student’s t-tests were used to compare differences between control- and cyclin A1 siRNA-transfected cells. *p < 0.05; **p < 0.01. Error bars indicate standard deviations for 3 independent experiments. (E) Expression levels of YBX1 and cyclin A1, as assessed by RT-qPCR analysis in HGSC (n = 50) and OCCC tumors (n = 51). The statistical significance was determined using the Mann–Whitney U tests. (F, G) Correlation of YBX1 mRNA expression levels with the mRNA expression of cyclin A1 in HGSC (n = 50) (F) and OCCC tumors (n = 51) (G). The statistical significance of the correlations was determined using Pearson’s correlation coefficients and p values.

References

    1. Otto, T. & Sicinski, P. Cell cycle proteins as promising targets in cancer therapy. Nat. Rev. Cancer17, 93–115 (2017). - PMC - PubMed
    1. Batra, A. & Winquist, E. Emerging cell cycle inhibitors for treating metastatic castration-resistant prostate cancer. Expert Opin. Emerg. Drugs23, 271–282 (2018). - PubMed
    1. Dall’Acqua, A. et al. Inhibition of CDK4/6 as therapeutic approach for ovarian cancer patients: Current evidences and future perspectives. Cancers (Basel)13, 1–20 (2021). - PMC - PubMed
    1. Bai, S. et al. Targeting therapeutic resistance and multinucleate giant cells in CCNE1-amplified HR-proficient ovarian cancer. Mol. Cancer Ther.21, 1473–1484 (2022). - PMC - PubMed
    1. Kohno, K., Izumi, H., Uchiumi, T., Ashizuka, M. & Kuwano, M. The pleiotropic functions of the Y-box-binding protein, YB-1. BioEssays25, 691–698 (2003). - PubMed