. 2024 Sep 17;7(1):1162.
doi: 10.1038/s42003-024-06872-5.

Deficiency of Tlr7 and Irf7 in mice increases the severity of COVID-19 through the reduced interferon production

Affiliations

Deficiency of Tlr7 and Irf7 in mice increases the severity of COVID-19 through the reduced interferon production

Chenxiao Wang et al. Commun Biol. .

Abstract

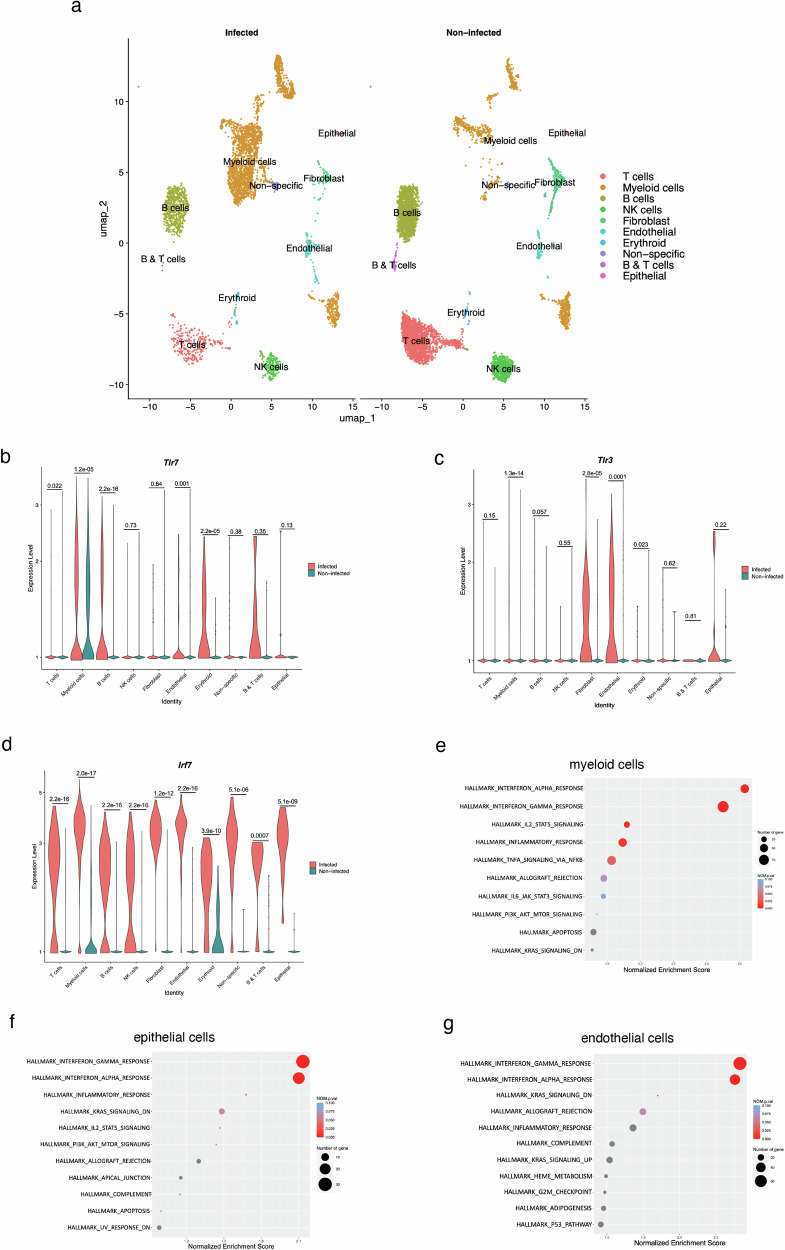
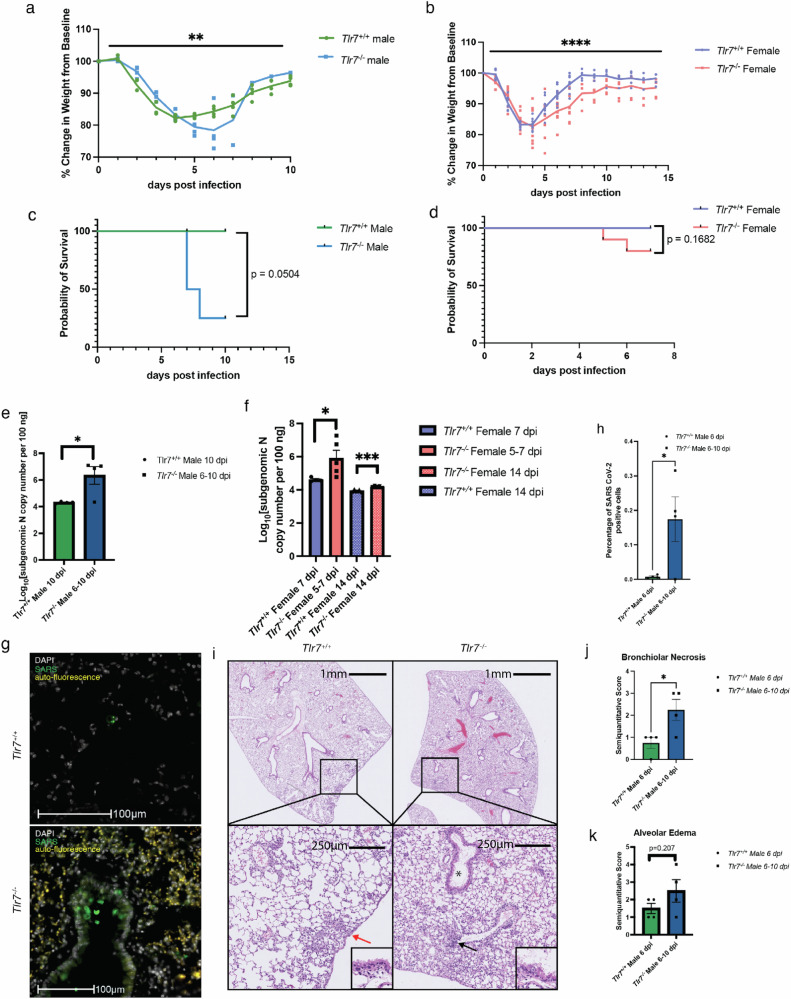
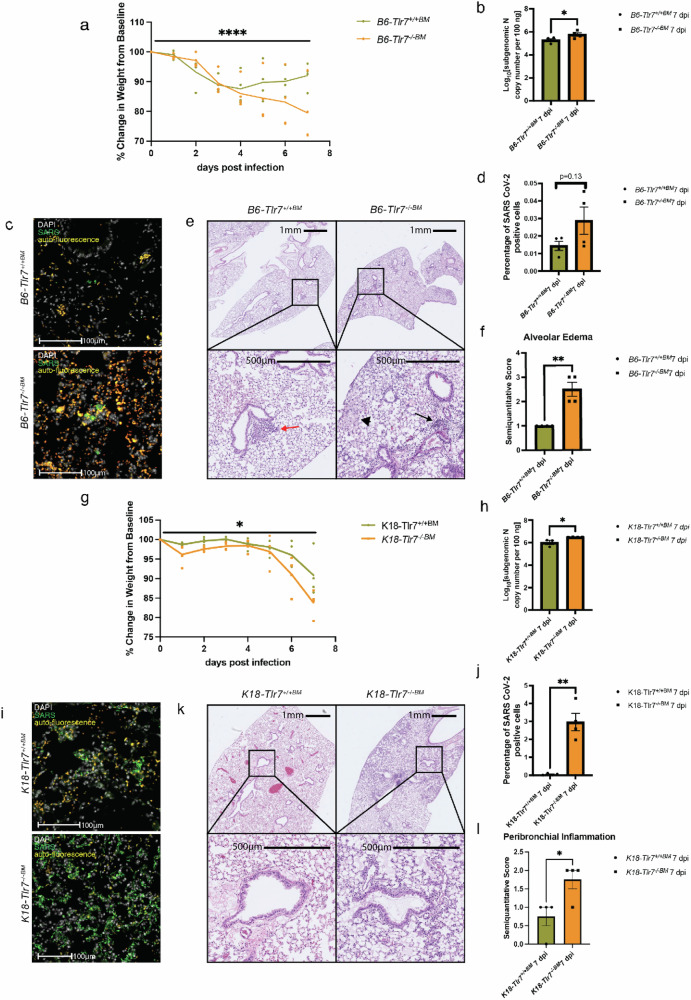
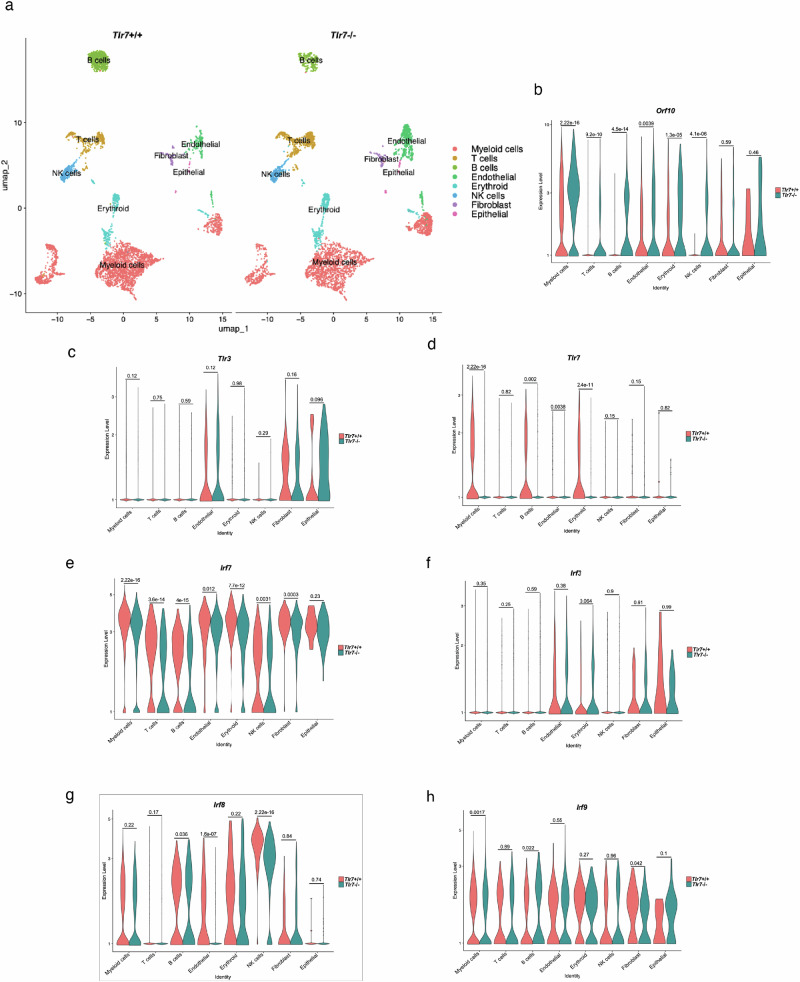
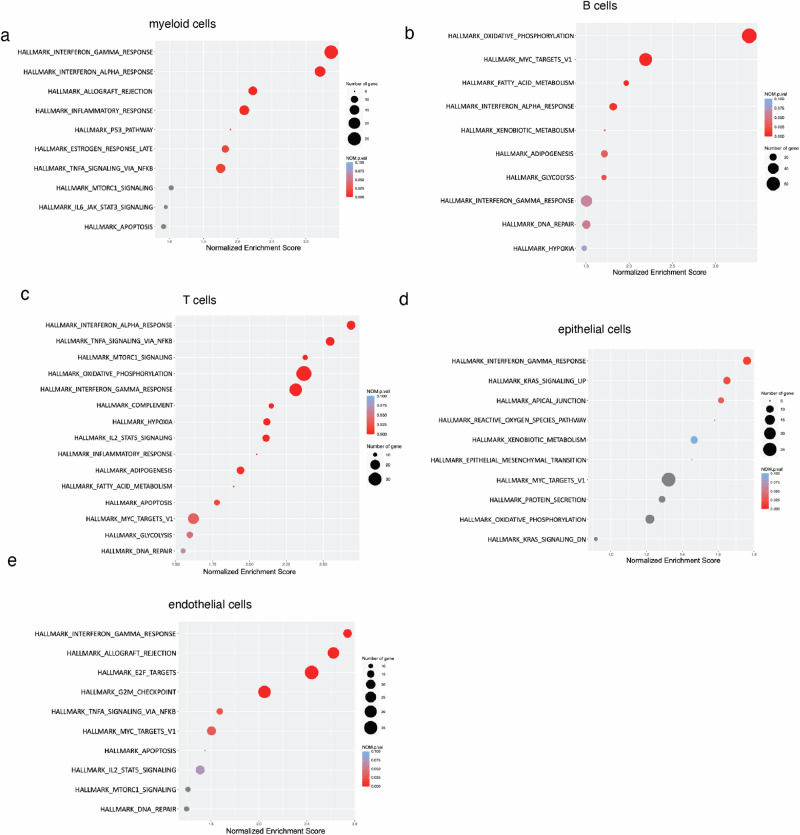
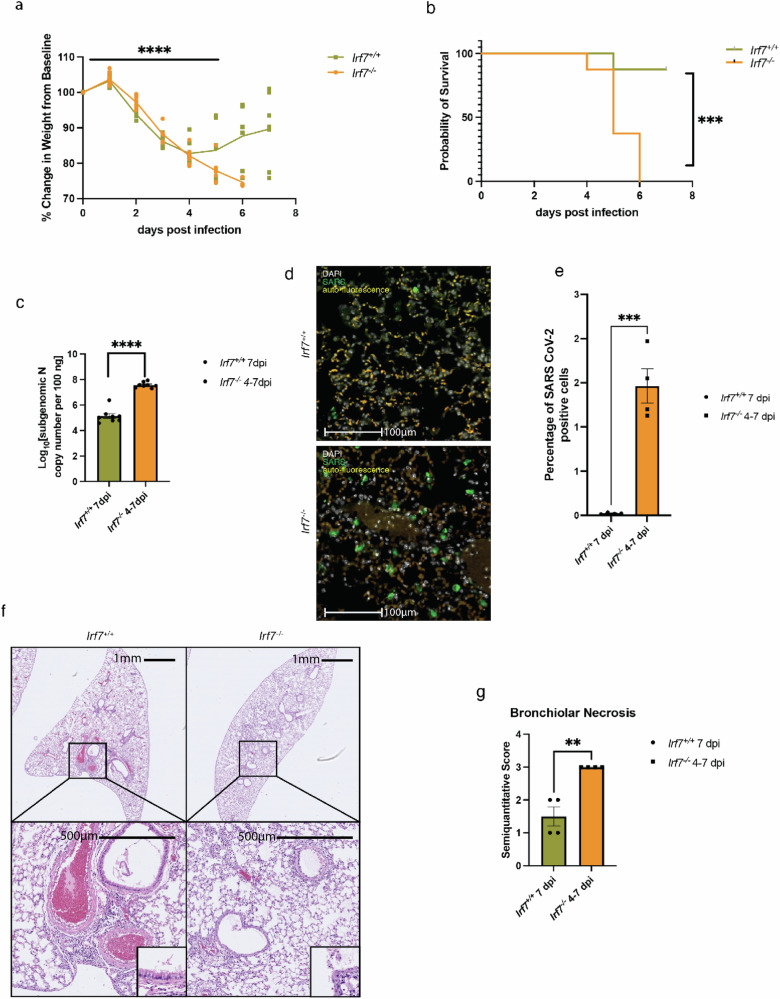
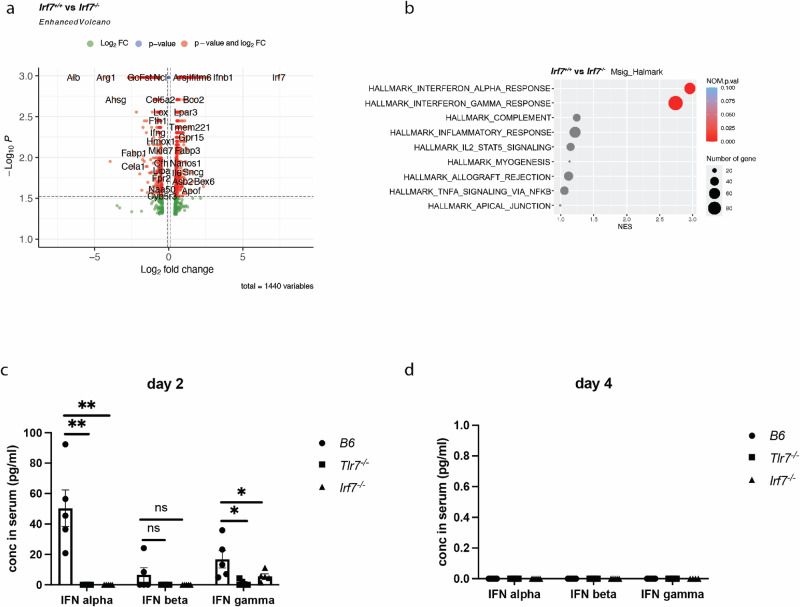
Toll-like receptor 7 (Tlr7) deficiency-accelerated severe COVID-19 is associated with reduced production of interferons (IFNs). However, the underlying mechanisms remain elusive. To address these questions, we utilize Tlr7 and Irf7 deficiency mice, single-cell RNA analysis together with bone marrow transplantation approaches. We demonstrate that at the early phase of infection, SARS-CoV-2 causes the upregulation of Tlr7, Irf7, and IFN pathways in the lungs of the infected mice. The deficiency of Tlr7 and Irf7 globally and/or in immune cells in mice increases the severity of COVID-19 via impaired IFN activation in both immune and/or non-immune cells, leading to increased lung viral loads. These effects are associated with reduced IFN alpha and gamma levels in the circulation. The deficiency of Tlr7 tends to cause the reduced production and nuclear translocation of interferon regulatory factor 7 (IRF7) in the lungs of the infected mice, indicative of reduced IRF7 activation. Despite higher amounts of lung viral antigen, Tlr7 or Irf7 deficiency resulted in substantially reduced production of antibodies against SARS-CoV-2, thereby delaying the viral clearance. These results highlight the importance of the activation of TLR7 and IRF7 leading to IFN production on the development of innate and adaptive immunity against COVID-19.


Conflict of interest statement

The authors declare no competing interests.

Figures

Fig. 1
Fig. 1. Upregulation of Tlr7, Irf7 and IFN pathways in the early phase of SARS-CoV-2 infection.
a Major clusters and respective cell types for two 12-week-old female MA30 infected B6 mice (1×10⁴ TCID 50) at 2 DPI and two 12-week-old non-infected B6 mice by scRNA-seq data. Uniform manifold approximation and projection (UMAP) for dimension reduction plot with major cell types of scRNA-seq. Single-cell suspensions from whole infected lungs at 2 DPI and non-infected lungs were processed and sequenced. We identified 10 major clusters including T cells, Myeloid cells, B cells, NK cells, Fibroblast, Endothelial, Erythroid, Non-specific, B & T cells, Epithelial. bd Expression of Tlr7, Tlr3, and Irf7 in the infected and non-infected lungs. eg Pathway analysis in myeloid cells, epithelial, and endothelial cells in the infected compared with non-infected lungs.
Fig. 2
Fig. 2. Global Tlr7 deficiency increases the severity of COVID-19 in mice.
a Male Tlr7–/– mice lost more body weight compared to age-matched male Tlr7+/+ mice post-MA30 infection. 12-week-old male Tlr7–/– mice (n = 4) and age-matched Tlr7+/+ (n = 4) male mice were intranasally inoculated with MA30 infection (1 × 10⁴ TCID 50). Body weights were monitored daily. Results are shown as mean ± SEM. The body weight difference is analyzed by a mixed-effects model. P = 0.0030. b Female Tlr7–/– mice lost more body weight compared to age-matched female Tlr7+/+ mice post-MA30 infection. 12-week-old female Tlr7-/- mice (n = 10) and age-matched Tlr7+/+ (n = 9) female mice were administrated with MA30 infection (1 × 10⁴ TCID 50). Body weights were monitored daily. Results are shown as mean ± SEM. The body weight difference is analyzed by a mixed model. P < 0.0001. c Survival analysis of male Tlr7–/– mice and age-matched male Tlr7+/+ mice post MA30 infection. 12-week-old male Tlr7–/– mice (n = 4) and age-matched Tlr7+/+ (n = 5) male mice were administrated with MA30 infection (1 × 10⁴ TCID 50). The comparison of survival curves is analyzed by the Log-rank (Mantel-Cox) test. P = 0.0504. d Survival analysis of female Tlr7–/– mice and age-matched male Tlr7+/+ mice post MA30 infection. 12-week-old female Tlr7–/– mice (n = 10) and age-matched Tlr7+/+ (n = 9) female mice were administrated with MA30 infection (1 × 10⁴ TCID 50). The comparison of survival curves is analyzed by the Log-rank (Mantel-Cox) model. P = 0.1682. e Male Tlr7–/– mice were detected with higher viral load in lungs compared to age-matched male Tlr7+/+ mice post MA30 infection at 6-10 DPI. 12-week-old male Tlr7–/– mice (n = 4) and age-matched Tlr7+/+ (n = 4) male mice were administrated with MA30 infection (1 × 10⁴ TCID 50) and lung tissue was collected at 6–10 DPI. Subgenomic viral load was detected by qRT-PCR. Results are shown as mean ± SEM. Comparison between Tlr7–/– mice and Tlr7+/+ mice is analyzed by unpaired t-test. P = 0.0229. f Female Tlr7–/– mice were detected with higher viral load in lungs compared to age-matched female Tlr7+/+ mice post MA30 infection at 5–7 DPI and 14 DPI. 12-week-old female Tlr7–/– mice (n = 5 for 5-7 DPI and 14 DPI) and age-matched Tlr7+/+ (n = 4 for 7 DPI, n = 5 for 14 DPI) male mice were administrated with MA30 infection (1 × 10⁴ TCID 50) and lung tissue was collected at endpoints. Subgenomic viral load was detected by qRT-PCR. Results are shown as mean ± SEM. Comparison between Tlr7–/– mice and Tlr7+/+ mice is analyzed by unpaired t-test. P = 0.0317 for 5-7 DPI; P = 0.0009 for 14 DPI. g, h Representative images and quantitative analysis of SARS-CoV-2 spike protein (green) immunofluorescence staining. Nuclei were stained with DAPI (white). Auto-fluorescence is presented with a yellow signal. 12-week-old male Tlr7–/– mice (n = 4) at 6-10 DPI and age-matched Tlr7+/+ (n = 4) at 6 DPI were included for analysis. Comparison is analyzed by unpaired t-test. P = 0.0429. ik Representative images and quantitative histology analysis of H and E staining of infected Tlr7+/+ and Tlr7–/– mice. 12-week-old male Tlr7–/– mice (n = 4) at 6–10 DPI and age-matched Tlr7+/+ (n = 4) at 6 DPI were included for analysis. Tlr7+/+ mice have minimal to mild pulmonary pathology characterized by scattered interstitial inflammation. Tlr7–/– mice exhibit mild to moderate pathology with widespread interstitial infiltrate and edema. Interstitial inflammation in Tlr7+/+ mice is limited to isolated foci of histiocytic and neutrophilic inflammation (red arrow). In Tlr7–/– mice, all pulmonary compartments are affected with alveoli containing edema, inflammatory cells infiltrate alveolar septae and surround vessels (black arrow), and bronchioles are lined by epithelial cells exhibiting degeneration and necrosis (black asterisks). Inset: higher magnification of bronchiolar epithelial degeneration and necrosis. Comparison is analyzed by unpaired t-test. P = 0.0321 of bronchiolar necrosis. P = 0.207 for alveolar edema.
Fig. 3
Fig. 3. Tlr7 deficiency in hematopoietic cells increases the severity of COVID-19.
Bone marrow transplantation was performed on recipient B6 mice at 8 weeks old. After 10 weeks of reconstitution, B6-Tlr7-/-BM (n = 4) and B6-Tlr7+/+BM (n = 4) male mice shown in Figs. 3a to 3f were administrated with MA30 infection (1 × 10⁴ TCID 50) and euthanized at 7 DPI. a B6-Tlr7-/-BM mice lost more body weight compared to B6-Tlr7+/+BM mice post MA30 infection. Body weights were monitored daily. Results are shown by mean ± SEM. Body weight difference is analyzed by two-way ANOVA. P < 0.0001. b B6-Tlr7-/-BM mice were detected with higher viral load in lungs compared to B6-Tlr7+/+BM mice post MA30 infection at 7 DPI. Subgenomic viral load was detected by qRT-PCR. Results are shown by mean ± SEM. Comparison between B6-Tlr7-/-BM mice and B6-Tlr7+/+BM mice is analyzed by unpaired t-test. P = 0.0459. c, d Representative images and quantitative analysis of SARS-CoV-2 spike protein (green) immunofluorescence staining. Nuclei were stained with DAPI (white). Auto-fluorescence is presented with yellow signal. Results are shown as mean ± SEM. Comparison is analyzed by unpaired t-test. P = 0.1333. ef Representative images and quantitative histology analysis of H and E staining of infected B6-Tlr7-/-BM mice and B6-Tlr7+/+BM mice. B6-Tlr7+/+BM mice have minimal pulmonary pathology compared to B6-Tlr7-/-BM with mild to moderate pulmonary pathology. Pathology in B6-Tlr7+/+BM mice is composed of small areas of perivascular to interstitial inflammation (red arrow). Pathology in B6-Tlr7-/-BM mice consists predominately of pulmonary edema (black arrowhead) and perivascular inflammation (black arrow). Results are shown as mean ± SEM. Comparison is analyzed by unpaired t-test. P = 0.0321 of bronchiolar necrosis. P = 0.0020. Bone marrow transplantation was performed on recipient K18 mice at 8 weeks old. After 10 weeks of reconstitution, K18-Tlr7-/-BM (n = 4) and K18-Tlr7+/+BM (n = 4) male mice shown in Figs. 3g to 3l were administrated with SARS-CoV-2 WA (2.5 × 10² TCID 50) and euthanized at 7 DPI. g K18-Tlr7-/-BM mice lost more body weight compared to K18-Tlr7+/+BM mice post MA30 infection. Body weights were monitored daily. Results are shown as mean ± SEM. Body weight difference were analyzed using two-way ANOVA. P = 0.0126. h K18-Tlr7-/-BM mice were detected with higher viral load in lungs compared to K18-Tlr7+/+BM mice post MA30 infection at 7 DPI. Subgenomic viral load were detected by qRT-PCR. Results are shown as mean ± SEM. Comparison between K18-Tlr7-/-BM mice and K18-Tlr7+/+BM mice were analyzed using an unpaired t-test. P = 0.0286. i, j Representative images and quantitative analysis of SARS-CoV-2 spike protein (green) immunofluorescence staining. Nuclei were stained with DAPI (white). Auto-fluorescence is presented with a yellow signal. Results are shown as mean ± SEM. Comparison is analyzed by unpaired t-test. P = 0.0010. k, l Representative images and quantitative histology analysis of H and E staining of infected K18-Tlr7-/-BM mice and K18-Tlr7+/+BM mice. Comparison is analyzed by unpaired t-test. P = 0.0300.
Fig. 4
Fig. 4. scRNA seq mapping shows down-regulated Irf7 in multiple cell populations of the infected Tlr7–/– mice compared with the infected Tlr7+/+ mice.
a Major clusters and respective cell types for 12-week-old female MA30 infected Tlr7+/+ mice (n = 2) at 2DPI (1 × 10⁴ TCID 50) and 12- week-old female MA30 infected Tlr7-/- mice (n = 2) at 2DPI (1 × 10⁴ TCID 50) by scRNA-seq data. UMAP for dimension reduction plot with major cell types of scRNA-seq. Single-cell suspensions from whole infected lungs at 2 DPI were processed and sequenced. We identified 10 major clusters including Myeloid cells, T cells, B cells, Endothelial, Erythroid, NK cells, Fibroblast, and Epithelial. bh Expression of Orf10, Tlr7, Tlr3, Irf7, Irf3, Irf8 and Irf9 in the Tlr7+/+ and Tlr7–/– lungs.
Fig. 5
Fig. 5. scRNA seq mapping shows down-regulated IFN pathways in multiple cell populations of the infected Tlr7-/- mice compared with the infected Tlr7+/+ mice.
ae Pathway analysis in myeloid cells, B cells, T cells, epithelial, and endothelial cells in the Tlr7+/+ compared with Tlr7–/– lungs for 12-week-old female MA30 infected Tlr7+/+ mice (n = 2) at 2DPI (1 × 10⁴ TCID 50) and 12- week-old female MA30 infected Tlr7–/– mice (n = 2) at 2DPI (1 × 10⁴ TCID 50) by scRNA-seq data.
Fig. 6
Fig. 6. Irf7 deficiency increases the severity of COVID-19.
12-week-old male and female Irf7-/- mice (n = 8) and age-matched male and female Irf7+/+ (n = 8) mice were administrated with MA30 infection (1×10⁴ TCID 50). a Irf7-/- mice lost more body weight compared to Irf7+/+ mice post MA30 infection. Body weights were monitored daily. Results are shown by mean ± SEM. Because of the data missing at 6 and 7 DPI, body weights from 0 to 5 DPI are analyzed by mixed-effects analysis. P < 0.0001. b Survival analysis of Irf7-/- mice and age-matched Irf7+/+ mice post MA30 infection. Comparison of survival curves is analyzed by Log-rank (Mantel-Cox) test. P = 0.0008. c Irf7-/- mice were detected with higher viral load in lung compared to Irf7+/+ mice post MA30 infection at 4-7 DPI. Subgenomic viral load of 12-week-old male Irf7-/- mice (n = 8) and age-matched male Irf7+/+ (n = 8) mice was detected by qRT-PCR. Results are shown by mean ± SEM. Comparison is analyzed by unpaired t-test. P < 0.0001. d, e Representative images and quantitative analysis of SARS-CoV-2 spike protein (green) immunofluorescence staining. Nuclei were stained with DAPI (white). Auto-fluorescence is presented with yellow signal. Comparison of 12-week-old male Irf7-/- mice (n = 4) and age-matched male Irf7+/+ (n = 4) mice is analyzed by unpaired t-test. P = 0.0003. f, g Representative images and quantitative histology analysis of H and E staining of 12-week-old male Irf7-/- mice (n = 4) and age-matched male Irf7+/+ (n = 4) mice. Irf7+/+ mice and Irf7-/- mice exhibit mild pulmonary pathology. Pathology in Irf7+/+ mice consists of perivascular to interstitial infiltration by mononuclear cells. Inset: Normal bronchiolar epithelium. Pathology in Irf7-/- mice is characterized by moderate to severe bronchiolar necrosis with interstitial to perivascular inflammation. Inset: necrosis of bronchiolar epithelial cells in Irf7-/- mouse. Comparison is analyzed by unpaired t-test. P = 0.0020.
Fig. 7
Fig. 7. Gene and pathway changes in MA30 infected-Irf7+/+ and Irf7–/– mice, and serum IFN levels in the infected B6 mice, Irf7-/- mice, and Tlr7-/- mice.
a, b 12-week-old Irf7-/- (n = 3) and age-matched Irf7+/+ (n = 3) males were inoculated with MA30 infection (1 × 10⁴ TCID 50). Lungs were collected at 2 DPI for Bulk RNA analysis. 965 genes were up-regulated and 467 genes down-regulated in Irf7+/+ mice compared with Irf7–/– mice (a) (also shown in Supplementary data 2). Pathway analysis showed activation of 9 pathways in Irf7+/+ mice compared with Irf7–/– mice (b). c, d. 12-week-old B6, Tlr7-/- and lrf7-/- mice were inoculated with MA30 infection (1 × 10⁴ TCID 50). Serums were collected at 2 DPI (n = 5 for each group) or 4 DPI (n = 5 for each B6 mice, n = 4 for Tlr7-/- mice, n = 3 for Irf7-/- mice). IFN-alpha, IFN-beta, IFN-gamma levels in serums were detected by ProcartaPlex Immunoassays at 2DPI and 4DPI. One-tailed unpaired t-test was performed to evaluate the statistical significance between two groups. Values are presented as mean ± SEM. *P < 0.05. **P < 0.01. P = 0.0015 between B6 IFN alpha level and Tlr7-/- IFN alpha level at 2 DPI. P = 0.0015 between B6 IFN alpha level and Irf7-/- IFN alpha level at 2 DPI. P = 0.1021 between B6 IFN beta level and Tlr7-/- IFN beta level at 2 DPI. P = 0.1021 between B6 IFN beta level and Irf7-/- IFN beta level at 2 DPI. P = 0.0137 between B6 IFN gamma level and Tlr7-/- IFN gamma level at 2 DPI. P = 0.0477 between B6 IFN gamma level and Irf7-/- IFN gamma level at 2 DPI.
Fig. 8
Fig. 8. Measurement of IgG antibody reactivity of Tlr7-/- mice and Irf7-/- mice towards recombinant SARS-CoV-2 spike glycoprotein.
a Nonlinear fit curves of IgG antibody reactivity of MA30 (1×10⁴ TCID 50) infected female Tlr7+/+ mice (n = 4) and Tlr7-/- mice (n = 5) at 14 DPI. The half-maximal IgG absorbance serum dose (AD50) titer of Tlr7+/+group is 15699. The AD50 titer of Tlr7-/- group is 9349. b Comparison of absorbance at 450 nm between Tlr7+/+ mice and Tlr7-/- mice at 6250 and 31250 times dilution. Results are shown by mean ± SEM. Comparison is analyzed by unpaired t-test. P = 0.1027 for 6250 times dilution; p = 0.0292 for 31250 times dilution. c Nonlinear fit curves of IgG antibody reactivity of MA30 (1 × 10⁴ TCID 50) infected male B6-Tlr+/+BM (n = 4) and B6-Tlr7-/-BM(n = 4) mice at 7 DPI. The AD50 titer of B6-Tlr+/+BM group is 716.9. The AD50 titer of B6-Tlr7-/-BM group is 372.1. d Comparison of absorbance at 450 nm between B6-Tlr7-/-BM (n = 4) and B6-Tlr7+/+BM(n = 4) mice at 250 and 1250 times dilution. Results are shown by mean ± SEM. Comparison is analyzed by unpaired t-test. P = 0.0322 for 250 times dilution; p = 0.0486 for 1250 times dilution. e Nonlinear fit curves of IgG antibody reactivity of MA30 (1 × 10⁴ TCID 50) infected male K18-Tlr7+/+BM (n = 4) and K18-Tlr7-/-BM (n = 4) mice at 7 DPI. The AD50 titer of K18-Tlr7+/+BM group is 329.1. The AD50 titer of K18-Tlr7-/-BM group is 273.7. f Comparison of absorbance at 450 nm between K18-Tlr7+/+BM(n = 4) and K18-Tlr7-/-BM (n = 4) mice at 250 and 1250 times dilution. Results are shown by mean ± SEM. Comparison is analyzed by unpaired t-test. P = 0.0278 for 250 times dilution; p = 0.0557 for 1250 times dilution. g Nonlinear fit curves of IgG antibody reactivity of MA30 (1 × 10⁴ TCID 50) infected male and female Irf7+/+ mice (n = 8) and Irf7-/- mice (n = 4) at 5–7 DPI. The AD50 titer of Irf7+/+group is 490.0. The IgG levels of Irf7-/- group are too low to fit a nonlinear curve. h Comparison of absorbance at 450 nm between Irf7+/+ mice and Irf7-/- mice at 250 and 1250 times dilution. Results are shown by mean ± SEM. Comparison is analyzed by unpaired t-test. P = 0.0088 for 250 times dilution; p = 0.0397 for 1250 times dilution.

References

    1. Polatoğlu, I., Oncu-Oner, T., Dalman, I. & Ozdogan, S. COVID-19 in early 2023: Structure, replication mechanism, variants of SARS-CoV-2, diagnostic tests, and vaccine & drug development studies. MedComm (2020)4, e228 (2023). - PMC - PubMed
    1. Carabelli, A. M. et al. SARS-CoV-2 variant biology: immune escape, transmission and fitness. Nat. Rev. Microbiol.21, 162–177 (2023). - PMC - PubMed
    1. Wang, C. et al. COVID-19 and influenza infections mediate distinct pulmonary cellular and transcriptomic changes. Commun. Biol.6, 1265 (2023). - PMC - PubMed
    1. Beck, D. B. & Aksentijevich, I. Susceptibility to severe COVID-19. Science370, 404–405 (2020). - PubMed
    1. Davis, H. E., McCorkell, L., Vogel, J. M. & Topol, E. J. Long COVID: major findings, mechanisms and recommendations. Nat. Rev. Microbiol.21, 133–146 (2023). - PMC - PubMed

Publication types

MeSH terms

Associated data