. 2024 Oct;25(10):1871-1883.
doi: 10.1038/s41590-024-01961-3. Epub 2024 Sep 17.

Epigenetic tuning of PD-1 expression improves exhausted T cell function and viral control

Affiliations

Epigenetic tuning of PD-1 expression improves exhausted T cell function and viral control

Sarah A Weiss et al. Nat Immunol. 2024 Oct.

Abstract

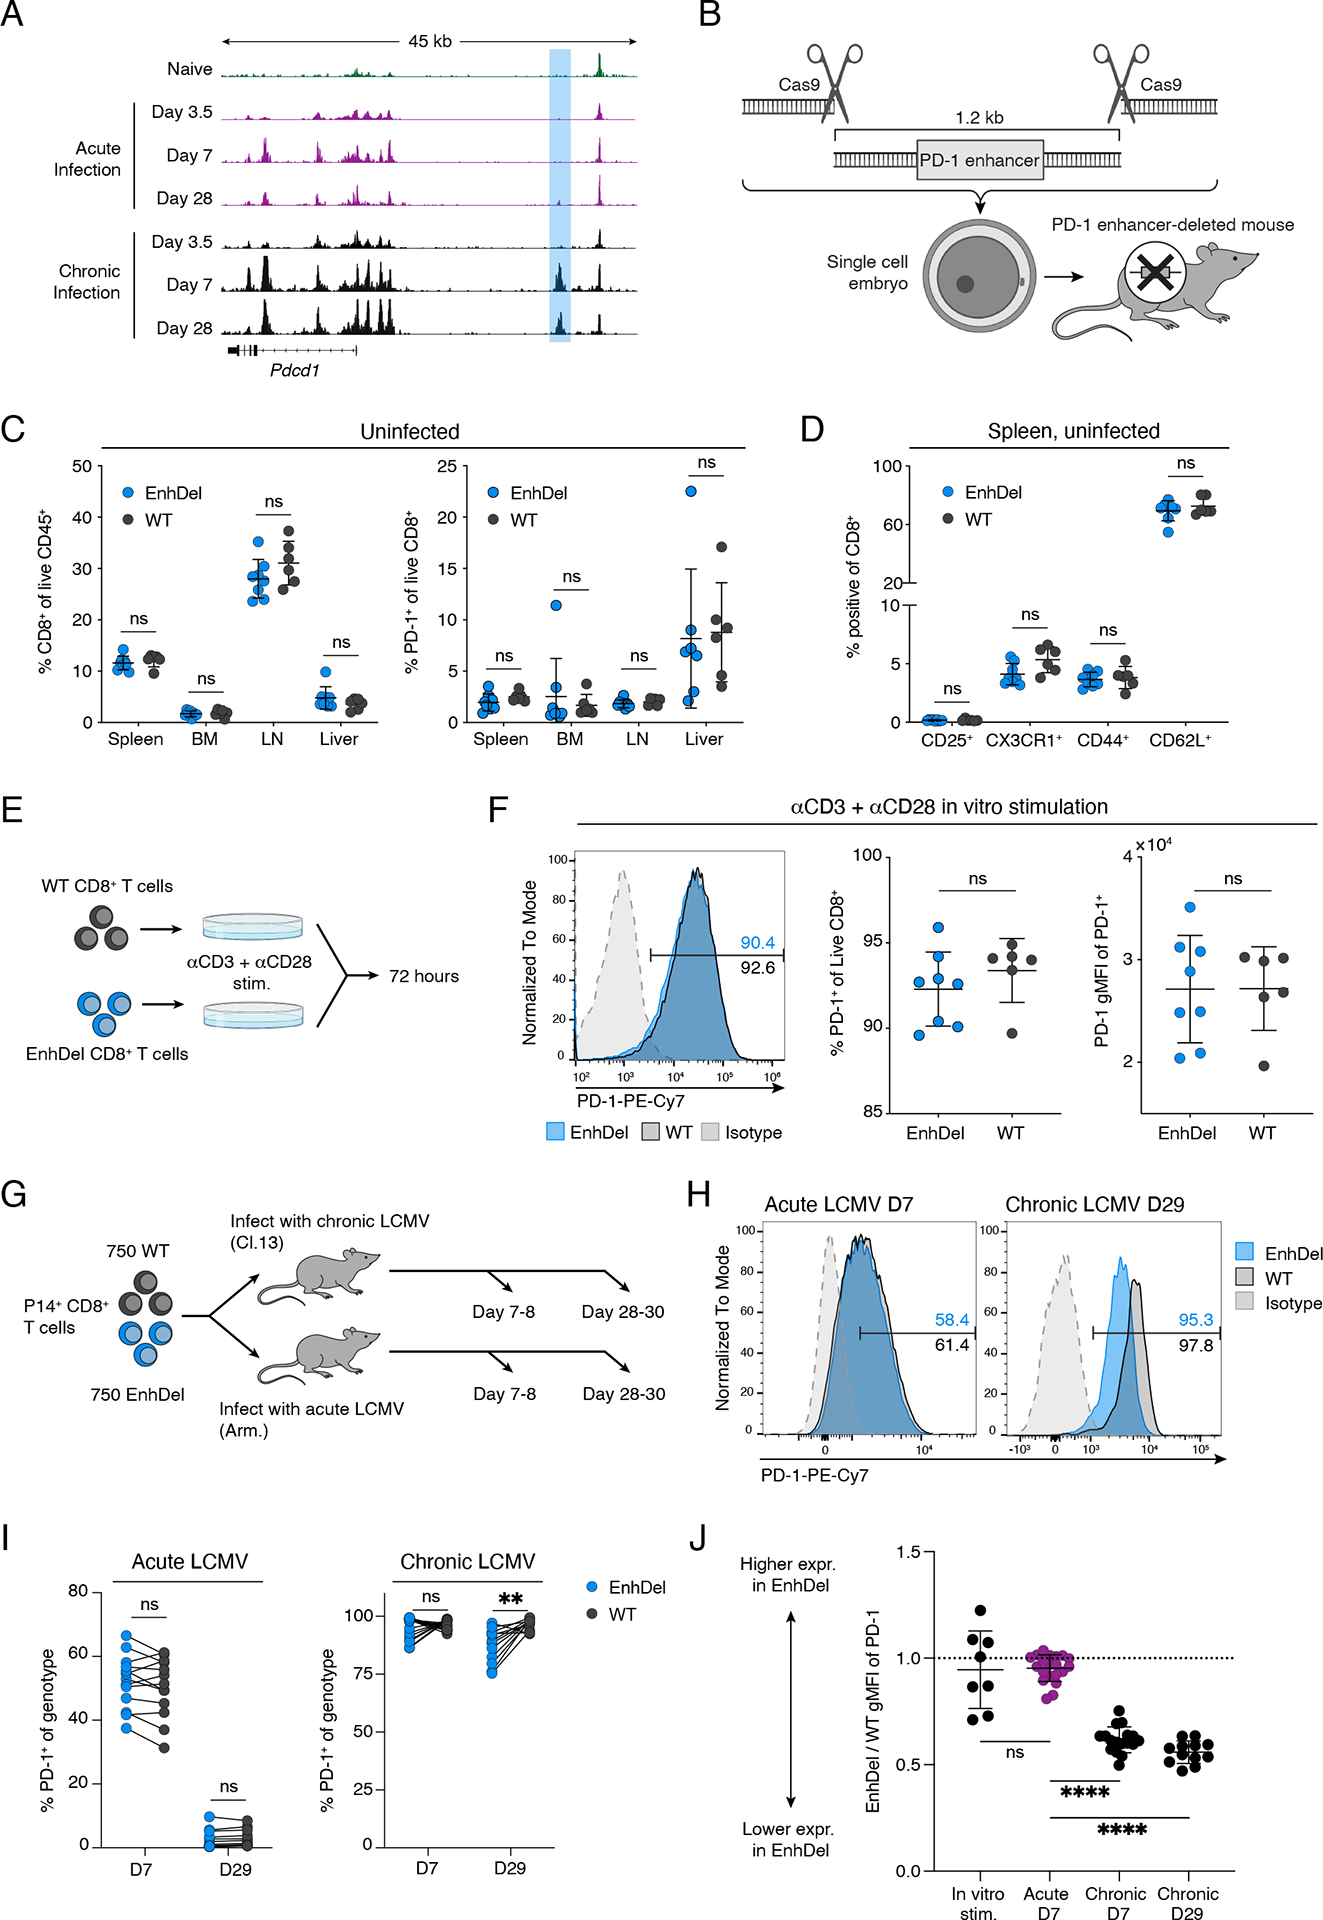
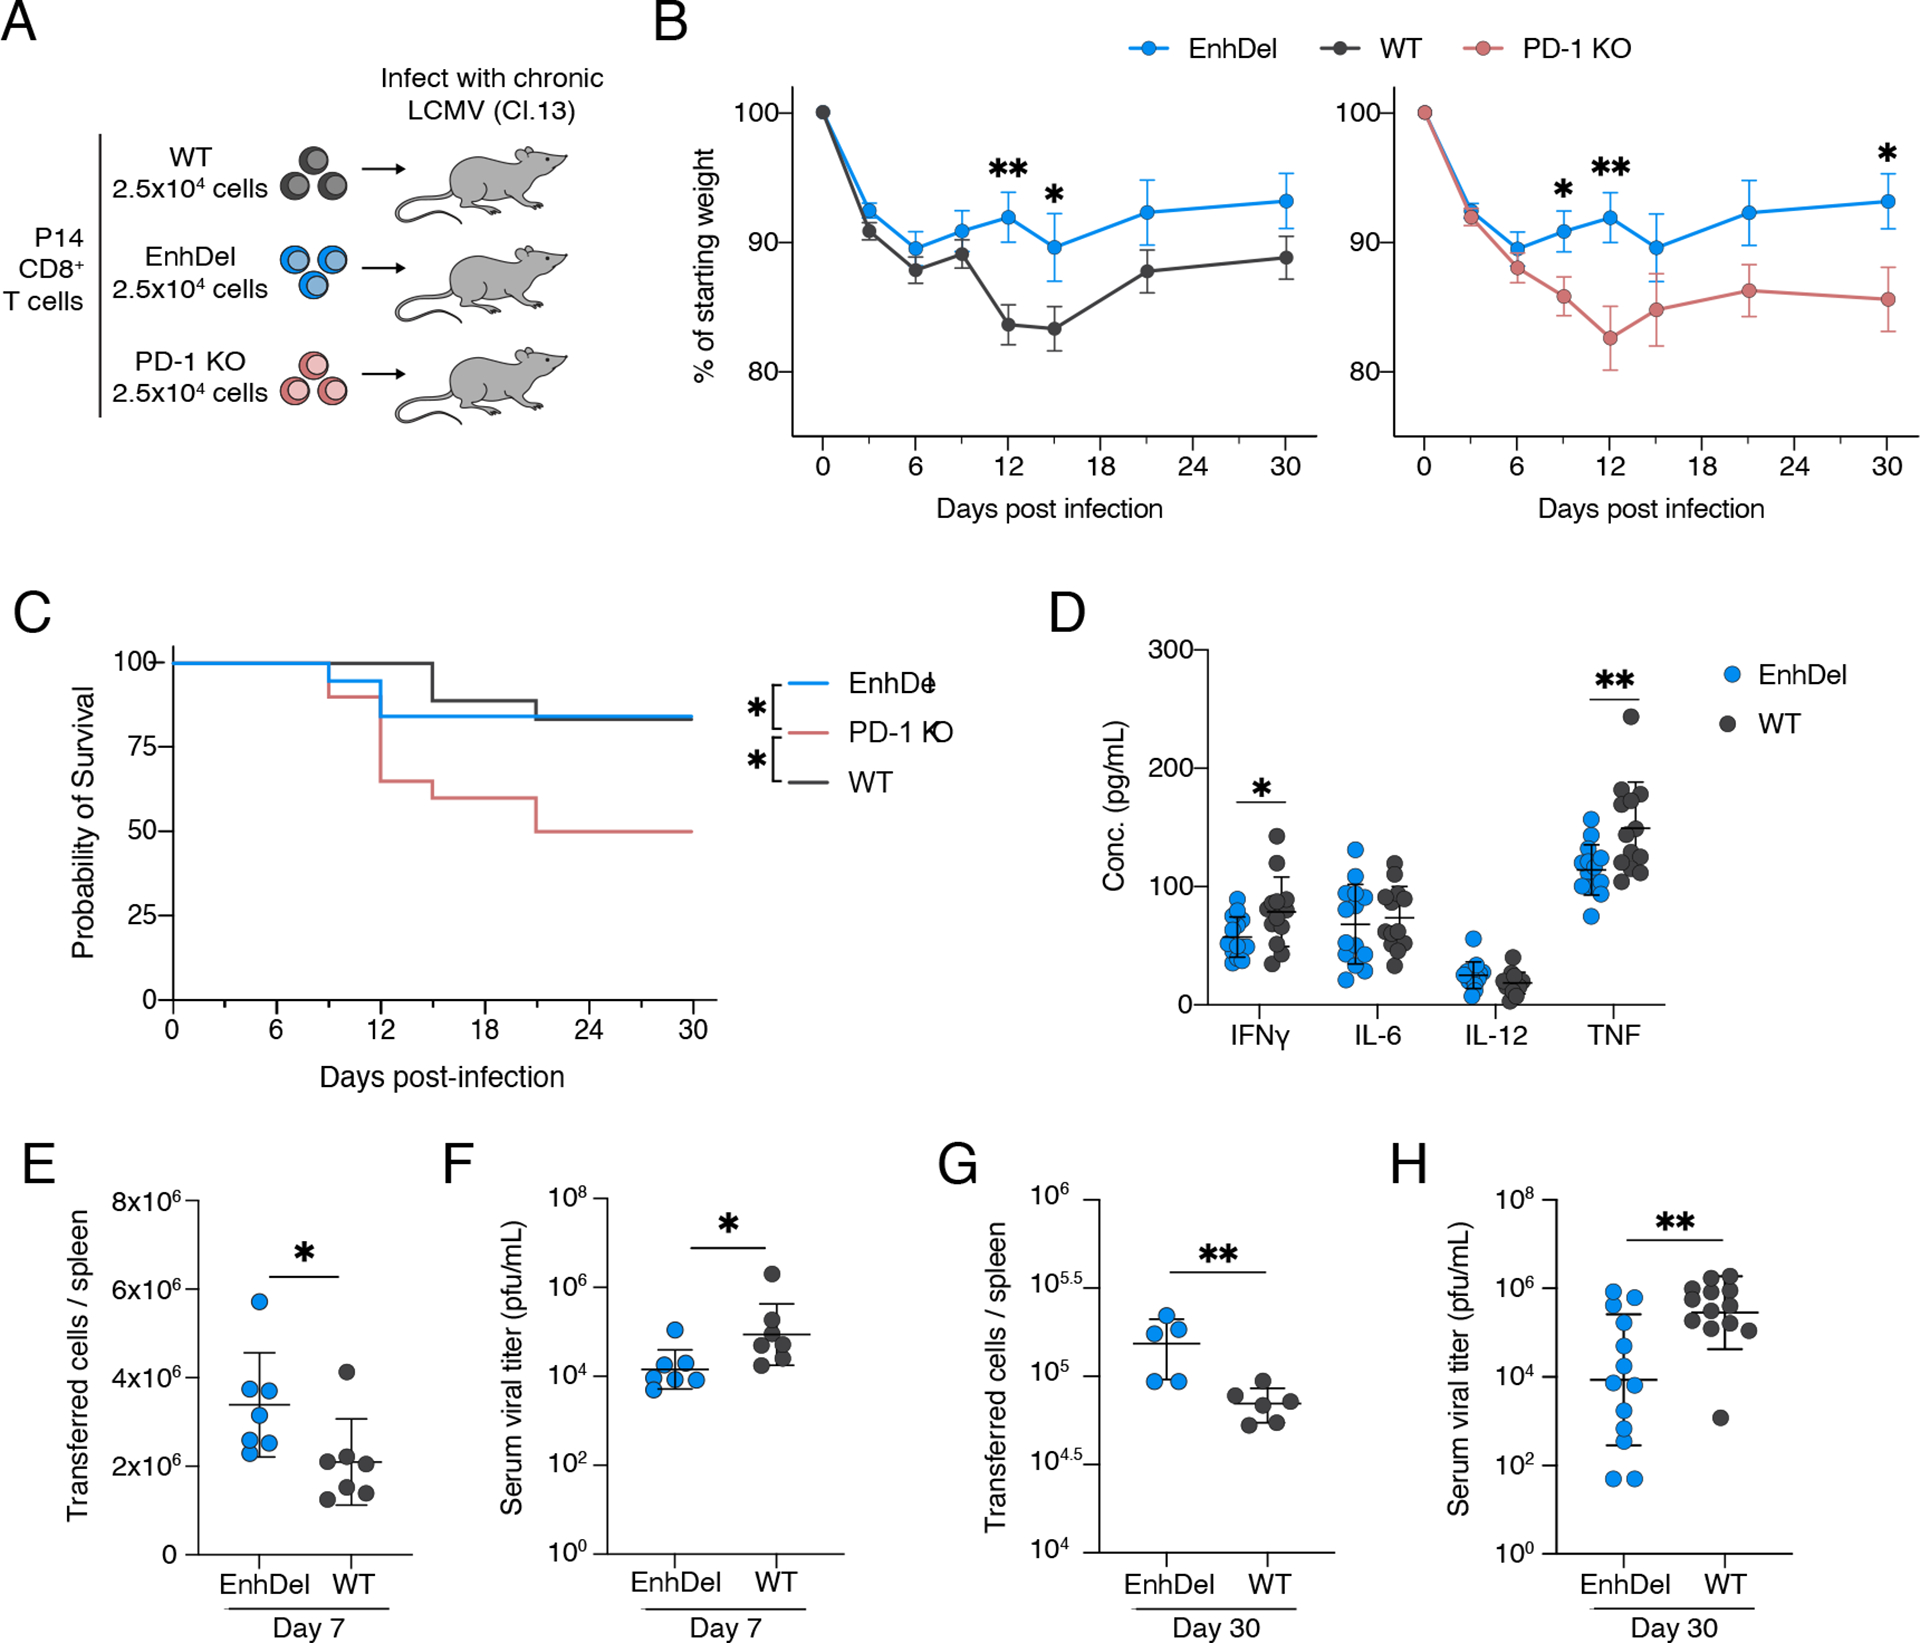
PD-1 is a key negative regulator of CD8+ T cell activation and is highly expressed by exhausted T cells in cancer and chronic viral infection. Although PD-1 blockade can improve viral and tumor control, physiological PD-1 expression prevents immunopathology and improves memory formation. The mechanisms driving high PD-1 expression in exhaustion are not well understood and could be critical to disentangling its beneficial and detrimental effects. Here, we functionally interrogated the epigenetic regulation of PD-1 using a mouse model with deletion of an exhaustion-specific PD-1 enhancer. Enhancer deletion exclusively alters PD-1 expression in CD8+ T cells in chronic infection, creating a 'sweet spot' of intermediate expression where T cell function is optimized compared to wild-type and Pdcd1-knockout cells. This permits improved control of chronic infection without additional immunopathology. Together, these results demonstrate that tuning PD-1 via epigenetic editing can reduce CD8+ T cell dysfunction while avoiding excess immunopathology.


Conflict of interest statement

A.H.S. has patents/pending royalties on the PD-1 pathway from Roche and Novartis and has research funding from IOME, AbbVie, Taiwan Bio and Calico unrelated to the submitted work. A.H.S. serves on advisory boards for Elpiscience, Monopteros, Alixia, IOME, Corner Therapeutics, BioEntre, GlaxoSmithKline, Amgen and Janssen. She also is on scientific advisory boards for the Massachusetts General Cancer Center, Program in Cellular and Molecular Medicine at Boston Children’s Hospital, the Human Oncology and Pathogenesis Program at Memorial Sloan Kettering Cancer Center, Perlmutter Cancer Center at NYU, the Gladstone Institutes, and the Bloomberg-Kimmel Institute for Cancer Immunotherapy at Johns Hopkins. She is an academic editor for the Journal of Experimental Medicine. W.N.H. and D.R.S have a patent application on T cell exhaustion-specific enhancers held by the Dana-Farber Cancer Institute. W.N.H. is a co-founder, employee of, and equity holder in Arsenal Biosciences. W.N.H. holds equity in Tango Therapeutics and Arsenal Biosciences. B.C.M. has consulted for Cellarity, LifeOmic, and Telix Pharmaceuticals. The remaining authors declare no competing interests.

Figures

Figure 1:
Figure 1:. An exhaustion-associated PD-1 enhancer reduces PD-1 expression specifically in CD8+ T cells during chronic infection
(A) ATAC-seq tracks at Pdcd1 from transferred P14+ CD8+ T cells from naive mice, LCMV Armstrong- or LCMV Clone 13-infected mice at D3.5, D7, and D28. Blue shading highlights the exhausted-associated -23.8 kb region. (B) Diagram of CRISPR-Cas9 editing strategy to generate the enhancer-deleted mouse model. (C) Percentage of CD8+ within Live CD45+ cells, and percentage of PD-1+ within CD8+ cells from tissues of uninfected EnhDel (n = 8) or WT (n = 6) mice. One of two experiments. (D) Percentage of CD8+ T cells expressing listed markers from uninfected EnhDel (n = 8) or WT (n = 6) mice. One of two experiments. (E) Diagram of EnhDel and WT CD8+ T cell in vitro activation assay with 72 hours of αCD3 and αCD28 stimulation. (F) Following in vitro stimulation, (left) representative flow cytometry plot of PD-1 expression, (center) percentage of PD-1+ of Live CD8+ cells and (right) gMFI of PD-1+ cells from EnhDel (n = 8) or WT (n = 5) mice. One of two experiments. (G) Diagram of P14+ EnhDel/WT co-transfer system. Cells were transferred prior to infection (LCMV Cl. 13 or Arm.), then assayed at early and late timepoints. (H) Representative flow cytometry plots of PD-1 expression from early LCMV Arm. (left) and late LCMV Cl. 13 (right) from the P14+ co-transfer model. (I) Percentage of PD-1+ within EnhDel or WT cells from LCMV Arm. (n = 13) (left) and LCMV Cl. 13 (D7: n = 17, D29: n = 12) (right) from the P14+ co-transfer model. Two of two experiments combined, significance calculated using a paired two-sided Student’s t-test. (J) Relative gMFI (within PD-1+ cells) of EnhDel cells compared to an average of WT cells following in vitro stimulation (n = 8), or co-transferred WT cells following infection (Arm. D7: n = 20; Cl. 13 D7: n = 17; Cl. 13 D29: n = 12). (C), (D), (F), (J) Significance calculated using an unpaired two-sided Student’s t-test, without multiple comparison adjustment. Error bars represent mean and standard deviation. Asterisks used to indicate significance correspond to the following: ns, not significant (P> 0.05), *P≤ 0.05, **P≤ 0.01, ***P≤0.001 and ****P≤0.0001.
Figure 2:
Figure 2:. Enhancer deletion increases exhausted CD8+ T cell numbers and modulates subset distribution
(A) Calculated number of P14+ EnhDel and WT cells per spleen at D28–30 following co-transfer and LCMV Cl. 13 infection (n = 23 mice). Three of three experiments combined, significance calculated using a paired two-sided Student’s t-test. Paired samples connected. (B) Ratio of co-transferred P14+ EnhDel cells to WT cells at D28–30 following LCMV Arm. (n = 21 mice) or Cl. 13 infection (n = 23 mice). Two of two experiments combined for Arm., three of three combined for Cl. 13. Significance calculated using an unpaired two-sided Student’s t-test. Error bars represent mean and standard deviation. (C) Ratio of co-transferred P14+ EnhDel cells to WT cells over time following infection with LCMV Arm. or Cl. 13. Two to three experiments combined per infection type per timepoint (Cl. 13 D7: n = 17 mice; Arm. D7: n = 18 mice; Cl. 13 D14–15: n = 13 mice; Arm. D14–15: n = 10 mice; Cl. 13 D28–30: n = 23 mice; Arm. D28–30: n = 21 mice; Cl. 13 D50–60: n = 23 mice; Arm. D50–60: n = 8 mice). Significance calculated using an unpaired two-sided Student’s t-test, without multiple comparison adjustment. Error bars represent mean and SEM. (D) Representative flow cytometry plots of exhausted subset gating strategy. Slamf6 TIM3+ cells further subgated based on CX3CR1 expression. (E) Within PD-1+ cells, relative gMFI of P14+ EnhDel cells compared to co-transferred WT cells in Arm. or Cl. 13 infection by exhausted subset (Arm. D7: n = 20, Cl. 13 D7: n = 17; Cl. 13 D28–30: n = 11). Two of two experiments combined per infection type per timepoint. Significance calculated using an unpaired two-sided Student’s t-test, error bars represent mean and standard deviation. (F) Percentage of indicated exhausted subset of P14+ co-transferred EnhDel or WT cells at D28–30 (n = 11 mice) after Cl. 13 infection. Two of two experiments combined, significance calculated using a paired two-sided Student’s t-test. Paired samples connected.
Figure 3:
Figure 3:. Enhancer deletion increases early proliferation and late survival in exhausted CD8+ T cells
(A) Representative flow cytometry plots of BrdU staining in prog. exhausted EnhDel (left) and WT (right) cells at D7 after Cl. 13 infection with P14+ co-transfer. (B) Percentage of BrdU-positive cells within a given subset (left: prog., center: eff.-like, right: term.) and genotype (EnhDel, WT) at the indicated timepoints (D7: n = 17, D15: n = 13, D29: n = 13) in the Cl. 13 co-transfer model. Two of two experiments combined, significance calculated using a paired two-sided Student’s t-test. Paired samples connected. (C) Representative flow cytometry plots of Annexin V staining in term. exhausted EnhDel (left) and WT (right) cells at D28 after Cl. 13 infection with P14+ co-transfer. (D) Percentage of Annexin V-positive cells within a given subset (left: prog., center: eff.-like, right: term.) and genotype (EnhDel, WT) at the indicated timepoints (D7: n = 17, D15: n = 13, D29: n = 11) in the Cl. 13 co-transfer model. Two of two experiments combined, significance calculated using a paired two-sided Student’s t-test. Paired samples connected. Asterisks used to indicate significance correspond to the following: ns, not significant (P> 0.05), *P≤ 0.05, **P≤ 0.01, ***P≤0.001 and ****P≤0.0001.
Figure 4:
Figure 4:. Genetic perturbation of PD-1 expression does not generate novel exhausted CD8+ T cell subsets
(A) Diagram of experimental design for in vivo triple transfer (P14+ EnhDel, WT, and PD-1 KO cells) prior to LCMV Cl. 13 infection, isolation by sorting on day 30 after infection, and subsequent scRNA-seq. (B) Representative flow cytometry plot of gating strategy for transferred (CD44+GFP) EnhDel (CD45.1+), PD-1 KO (CD45.2+), and WT (CD45.1+CD45.2+) cells. (C) UMAP projection of scRNA-seq profiles from 27,362 exhausted CD8+ T cells from D30 LCMV Cl. 13, colored by cluster. Clustering determined from all cells across all samples (n = 6). (D) UMAP projections of scRNA-seq profiles from all cells across all samples (n = 6), colored by expression of indicated genes. Top left: Tox, top center: Tcf7, top right: Havcr2, bottom left: Cx3cr1, bottom center: Cd101, bottom right: Mki67. (E) Galaxy plots depicting the cell density in UMAP space for EnhDel (left), PD-1 KO (center), and WT (right) cells (n = 2 samples per plot). (F) Frequency of each genotype within each cluster, normalized to total cell number per scRNA-seq sample (n = 2 samples per bar). EnhDel frequency was compared to WT and to PD-1 KO frequency for each cluster, with significance determined by two-sided Fisher’s exact test, ***P≤0.001. (G) Diagram of experimental design for in vivo paired co-transfer (P14+ EnhDel and WT, P14+ EnhDel and PD-1 KO) prior to LCMV Cl. 13 infection, isolation by sorting on day 30 after infection by transferred genotype and exhausted subset, and subsequent ATAC-seq. (H) ATAC-seq tracks at the Pdcd1 locus for progenitor (Prog.) and terminally exhausted (Term.) WT, EnhDel, and PD-1 KO CD8+ T cells. n = 2 samples for each track. (I) Spearman correlation of ATAC-seq profiles from progenitor and terminally exhausted WT, EnhDel, and PD-1 KO CD8+ T cells, hierarchically clustered. (J) Pie charts displaying pairwise differential accessibility analysis of all chromatin accessible regions in prog. (top row) or term. (bottom row) EnhDel vs. PD-1 KO (left column), EnhDel vs. WT (center column), and PD-1 KO vs. WT (right column) samples. Percentage of non-differential regions in grey, percentage of differentially accessible regions colored by more accessible genotype.
Figure 5:
Figure 5:. Enhancer deletion promotes an effector transcriptional state distinct from WT and PD-1 KO T cells
(A) Principal component analysis (PCA) of scRNA-seq-derived pseudobulk samples for WT, EnhDel, and PD-1 KO cells from each cluster (n = 2 samples per genotype). Top left: prog., top right: eff.-like, bottom left: trans., bottom right: term. (B) Heatmap of the pseudobulk normalized expression per gene, averaged across sample replicates (n = 2 per genotype). Genes ordered by gene weight in axis 2 from the PCA model (PC2 loading). A manually curated set of genes is highlighted. (C) Scatterplot of scaled enrichment scores (sscore) from GSEA for all gene sets tested (11,392 total) comparing EnhDel and PD-1 KO cells within a given cluster, ranked by sscore with select gene sets labeled. Progenitor (left) and terminally exhausted (right) clusters shown. (D) Scatterplot of scaled enrichment scores (sscore) from GSEA for all gene sets tested (11,392 total) comparing EnhDel and WT cells within a given cluster, ranked by sscore with select gene sets labeled. Progenitor (left) and terminally exhausted (right) clusters shown. (E) Pre-ranked GSEA of an effector-versus-exhausted CD8+ T cell signature (GSE9650_EFFECTOR_VS_EXHAUSTED_CD8_TCELL_UP) in EnhDel versus WT (top) and EnhDel versus PD-1 KO (bottom) differentially expressed genes, analyzed separately by cluster (left: prog., center-left: eff.-like, center-right: trans., right: term.). Rank of genes marked at the bottom. (F) Pre-ranked GSEA of an oxidative phosphorylation signature (HALLMARK_OXIDATIVE_PHOSPHORYLATION) in EnhDel versus WT (top) and EnhDel versus PD-1 KO (bottom) differentially expressed genes, analyzed separately by cluster (left: prog., center-left: eff.-like, center-right: trans., right: term.). Rank of genes marked at the bottom.
Figure 6:
Figure 6:. Enhancer deletion creates both intermediate and unique functional properties compared to PD-1 KO and WT
(A) Diagram of EnhDel and WT, or EnhDel and PD-1 KO, P14+ CD8+ T cell co-transfer into recipient animals followed by LCMV Cl. 13 infection and analysis at day 28–30. (B) Percentage of transferred cells recovered from each genotype (n = 8). (C) Percentage of each exhausted subset within each genotype (n = 8). (D) Top: example flow cytometry plot for IFNγ following ex vivo peptide stimulation from EnhDel/PD-1 KO co-transfer recipients (left) and EnhDel/WT co-transfer recipients (right). Bottom: within a given genotype and within a given subset, percentage of IFNγ+ cells. Left: EnhDel or PD-1 KO (n = 8); right, EnhDel or WT (eff.-like: n = 7, prog. and term.: n = 12). (E) Top: example flow cytometry staining for Gzmb from EnhDel/PD-1 KO co-transfer recipients (left) and EnhDel/WT co-transfer recipients (right). Bottom: within a given genotype and within a given subset, percentage of Gzmb+ cells. Left: EnhDel or PD-1 KO (n = 11); right: EnhDel or WT (n = 12). (F) Top: example flow cytometry staining for Tox from EnhDel/PD-1 KO co-transfer recipients (left) and EnhDel/WT co-transfer recipients (right). Bottom: within a given genotype and within a given subset, percentage of Tox+ cells. Left: EnhDel or PD-1 KO (n = 11); right: EnhDel or WT (n = 12). (G) Within a given genotype (left, EnhDel or PD-1 KO, n = 8; right, EnhDel or WT, n = 13) and within a given subset, percentage of KLRG1+ cells. (H) Within a given genotype (left, EnhDel or PD-1 KO, n = 8; right, EnhDel or WT, n = 11) and within a given subset, percentage of Annexin V+ cells. (B), (C), (D), (E), (F), (G), (H): two of two experiments combined, significance calculated using a paired two-sided Student’s t-test. Paired samples connected with lines. Asterisks used to indicate significance correspond to the following: ns, not significant (P> 0.05), *P≤ 0.05, **P≤ 0.01, ***P≤0.001 and ****P≤0.0001.
Figure 7:
Figure 7:. Enhancer deletion improves viral control while limiting host damage
(A) Diagram of EnhDel, WT, or PD-1 KO P14+ CD8+ T cell single transfer into recipient animals followed by LCMV Cl. 13 infection, weight monitoring and day 30 viral titer assessment. (B) Percentage of starting weight following LCMV Cl. 13 infection, with weight assessed every 3–9 days. Left: EnhDel-recipient animals (n = 17–20) versus WT-recipient animals (n = 15–18). Right: EnhDel-recipient animals (n = 17–20) versus PD-1 KO-recipient animals (n = 10–20). Two of two experiments combined, significance calculated using an unpaired two-sided Student’s t-test. Dots denote mean, error bars denote SEM. (C) Survival curves of EnhDel-recipients (n = 20), PD-1 KO-recipients (n = 20), and WT-recipients (n = 18) following LCMV Cl. 13 infection. Two of two experiments combined, significance calculated using a log-rank test. (D) Serum concentrations of the indicated cytokines (x-axis) from EnhDel-recipients (n = 14) and WT-recipients (n = 14) at D7 of infection. Two of two experiments combined. Statistics calculated using an unpaired two-sided Student’s t-test. Error bars represent mean and standard deviation. (E) Calculated number of P14+ EnhDel (n = 7) and WT (n = 7) cells per spleen at D7. Significance calculated using an unpaired two-sided Student’s t-test. Error bars represent mean and standard deviation. (F) Serum viral titer at D7 of infection in EnhDel-recipients (n = 7) versus WT-recipients (n = 7). Statistics calculated using an unpaired two-sided Student’s t-test. Error bars represent mean and standard deviation. (G) Calculated number of P14+ EnhDel (n = 5) and WT (n = 6) cells per spleen at D30. Significance calculated using an unpaired two-sided Student’s t-test. Error bars represent mean and standard deviation. (H) Serum viral titer at day 30 of infection in EnhDel-recipients (n = 13) versus WT-recipients (n = 13). Two of two experiments combined, statistics calculated using an unpaired two-sided Student’s t-test. Error bars represent mean and standard deviation. Asterisks used to indicate significance correspond to the following: ns, not significant (P> 0.05), *P≤ 0.05, **P≤ 0.01, ***P≤0.001 and ****P≤0.0001.

References

    1. Zajac AJ, et al., Viral immune evasion due to persistence of activated T cells without effector function. J. Exp. Med, 1998. 188(12): p. 2205–2213. - PMC - PubMed
    1. John Wherry E, et al., Viral Persistence Alters CD8 T-Cell Immunodominance and Tissue Distribution and Results in Distinct Stages of Functional Impairment. J. Virol, 2003. 77(8): p. 4911–4927. - PMC - PubMed
    1. Barber DL, et al., Restoring function in exhausted CD8 T cells during chronic viral infection. Nature, 2006. 439(7077): p. 682–687. - PubMed
    1. Jin H-T, et al., Cooperation of Tim-3 and PD-1 in CD8 T-cell exhaustion during chronic viral infection. Proc. Natl. Acad. Sci. U. S. A, 2010. 107(33): p. 14733–14738. - PMC - PubMed
    1. Wherry EJ, et al., Molecular Signature of CD8 T Cell Exhaustion during Chronic Viral Infection. Immunity, 2007. 27(5): p. 824. - PubMed

MeSH terms

Substances