. 2024 Sep 5:42:316-327.
doi: 10.1016/j.bioactmat.2024.08.037. eCollection 2024 Dec.

3D bioprinted breast cancer model reveals stroma-mediated modulation of extracellular matrix and radiosensitivity

Affiliations

3D bioprinted breast cancer model reveals stroma-mediated modulation of extracellular matrix and radiosensitivity

Theo Desigaux et al. Bioact Mater. .

Abstract

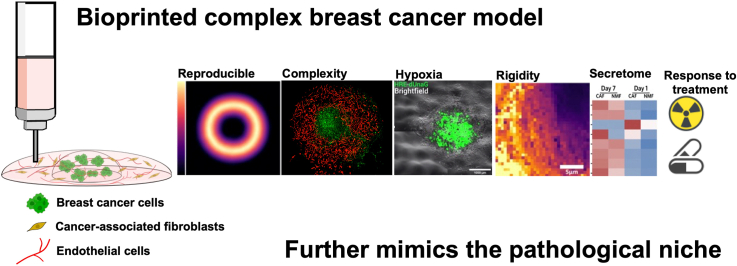
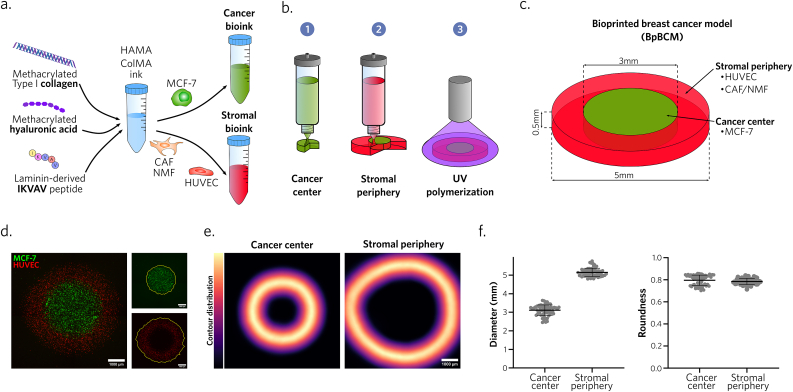
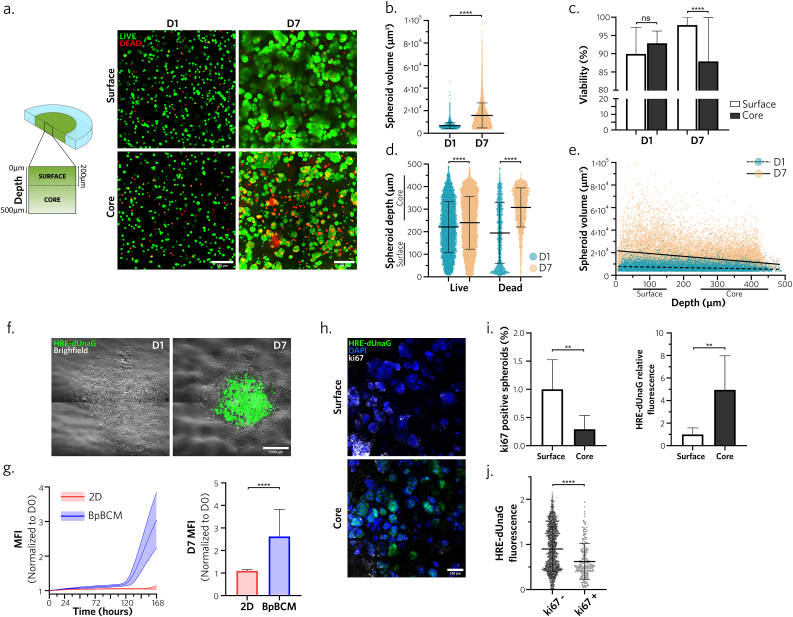
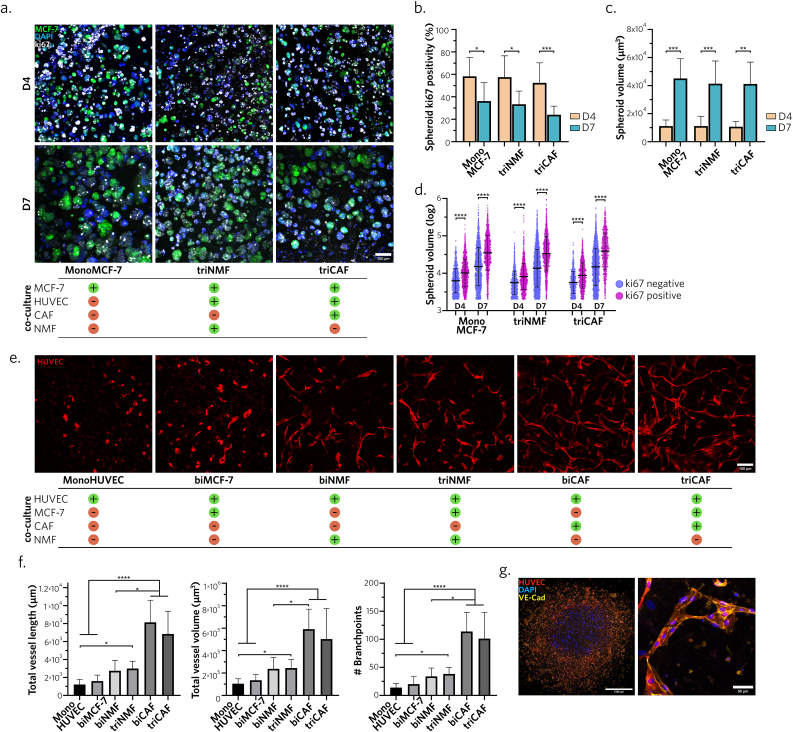
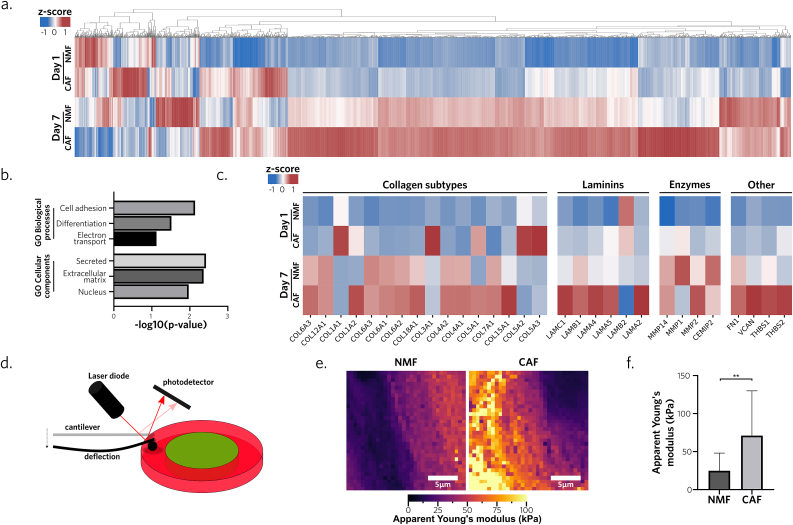
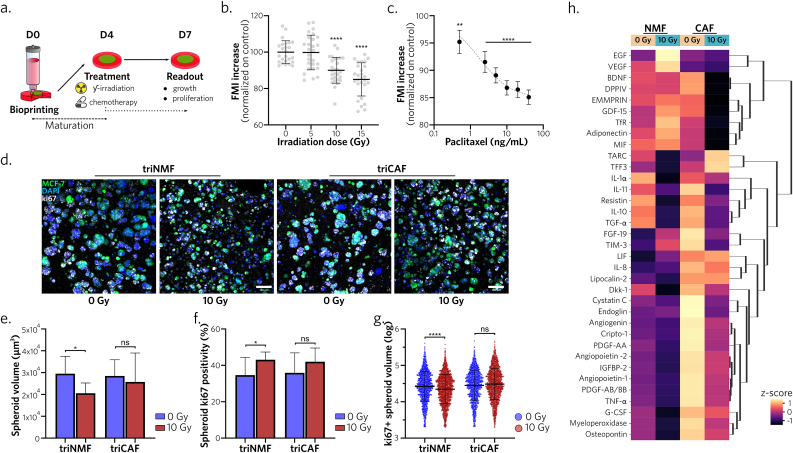
Deciphering breast cancer treatment resistance remains hindered by the lack of models that can successfully capture the four-dimensional dynamics of the tumor microenvironment. Here, we show that microextrusion bioprinting can reproducibly generate distinct cancer and stromal compartments integrating cells relevant to human pathology. Our findings unveil the functional maturation of this millimeter-sized model, showcasing the development of a hypoxic cancer core and an increased surface proliferation. Maturation was also driven by the presence of cancer-associated fibroblasts (CAF) that induced elevated microvascular-like structures complexity. Such modulation was concomitant to extracellular matrix remodeling, with high levels of collagen and matricellular proteins deposition by CAF, simultaneously increasing tumor stiffness and recapitulating breast cancer fibrotic development. Importantly, our bioprinted model faithfully reproduced response to treatment, further modulated by CAF. Notably, CAF played a protective role for cancer cells against radiotherapy, facilitating increased paracrine communications. This model holds promise as a platform to decipher interactions within the microenvironment and evaluate stroma-targeted drugs in a context relevant to human pathology.

Keywords: Bioprinting; Cancer microenvironment; Extracellular matrix.


Conflict of interest statement

All authors declare that there is no conflict of interest.

Figures

Image 1
Graphical abstract
Fig. 1
Fig. 1
Microextrusion bioprinting reproducibly produces millimeter-sized breast cancer models with distinct cancer and stromal areas. a. Bioink formulation schematic. b. Schematic representation of the 3-step bioprinting process. c. Bioprinted breast cancer model (BpBCM) design. d. BpBCM epifluorescence imaging 4h post-printing with MCF-7 GFP+ (green) in the center and HUVEC mKate+ (red) in the periphery (left). Scale bar: 1000 μm. Cancer center and stromal periphery contour detection (right). e,f. Cancer center and stromal periphery contour distribution (e, scale bar: 1000 μm), and quantifications of contour diameter and roundness (f) (N = 3, n = 62). Shown as mean ± s.d.
Fig. 2
Fig. 2
BpBCM cancer center develops a necrotic-like hypoxic core with a proliferative surface a. BpBCM printed with MCF-7 cells in the cancer bioink and an empty ink for the periphery were incubated in Calcein-AM for live cells staining (green) and EthD-1 for dead cells staining (red) on day 1 and day 7. Shown are representative confocal scanning layer in the surface (<200 μm from medium contact) and core (>200 μm from medium contact) areas from 3D confocal acquisitions. Scale bars: 100 μm. b. Live spheroid volume quantifications on day 1 and 7 (N = 3, n = 18). c. Percent of viable cells in the model, in the surface and the core on day 1 and 7 (N = 3, n = 18). d. Live and dead cells depths in the model on day 1 and 7. e. Linear regression between live spheroid volume and depth on day 1(slope = −5.254) and day 7 (slope = −25.10). f. Timelapse imaging of BpBCM printed with MCF-7 transduced with HRE-dUnaG hypoxia reporter (green) merged with brightfield image on day 1 and day 7. Scale bar: 1000 μm. g. Quantification of HRE-dUnaG reporter mean fluorescence intensity over time (left) and at day 7 (right), in 2D MCF-7 HRE-dUnaG cells (red) and printed in the center of BpBCM (blue) (N = 3, n = 15–24). h. Immunofluorescence for ki67 (gray). BpBCM models printed with MCF-7 HRE-dUnaG reporter (green), nuclei stained with DAPI (blue). Scale bar: 100 μm. j. Spheroid positivity to ki67 (left) and HRE-dUnaG reporter fluorescence, and (j) unique spheroid HRE-dUnaG fluorescence in function of ki67 status (N = 3, n = 8). All data represent mean ± s.d., and each datapoint represents a single spheroid (b, d, e, j). P-values were determined with two-tailed Mann-Whitney test (b,g,i,j) or Kruskal-Wallis test followed by Dunn's post-hoc test (c, d). ns, not significant. **p < 0.01; ****p < 0.0001.
Fig. 3
Fig. 3
BpBCM stromal compartment favors overtime maturation of cancer cells and microvascular structures a. Representative ki67 immunostaining (gray), and stained nuclei using DAPI (blue), of BpBCM models printed with MCF-7 GFP+ (green) in co-culture conditions. Scale bar: 100 μm. b,c. Spheroid volume (b) and ki67 spheroid positivity (c) on day 4 and 7 in the different culture conditions (N = 3, n = 10–13). d. Spheroid, either positive or negative for ki67, volume distribution (log scale). e. Representative 3D acquisition maximum intensity projection of the BpBCM stroma after 7 days of culture. BpBCM models were printed with HUVEC mKate+ (red) in the stromal periphery in different co-culture conditions. Scale bar: 100 μm. f. 3D network analysis and quantification of total vessel length, volume and number of branchpoints (N = 3, n = 10–14). g. Immunostaining of triCAF model for VE-Cadherin (yellow), HUVEC mKate+ (red), nuclei (blue), full model imaging (left), and close up on one representative vessel (right). Scale bars: 1000 μm (left), 50 μm (right). All data represent mean ± s.d. Each dot represents a single spheroid (d). P-values were calculated with Kruskal-Wallis test corrected by Dunn's multiple comparison test. *P < 0.05; **P < 0.01; ***P < 0.001; ****P < 0.0001.
Fig. 4
Fig. 4
CAF remodel ECM protein composition and mechanical properties a. Proteomics heatmap of the relative abundance of 2408 quantified proteins in BpBCM in tri-culture with either CAF or NMF on day 1 and day 7. b. Enrichment analysis of overexpressed GO biological processes and cellular components in triCAF compared to triNMF condition on day 7. Processes are ordered in decreasing p-values. c. Heatmap of extracellular matrix specific proteins: collagen subtypes, laminin chains, restriction enzymes and other fibrillar and matricellular proteins (N = 3). d. Schematic representation of the atomic force microscopy force-spectroscopy protocol. Stromal area was probed using a colloidal probe after 7 days of maturation in triNMF or triCAF conditions. e. Stromal region scan by atomic force microscopy in force spectroscopy representing local apparent Young's modulus. Scale bar: 5 μm. f. Mean region apparent Young's modulus in NMF and CAF BpBCM stroma (N = 2). Shown as mean ± s.d. P values were calculated with Fisher's exact test (b), and Mann-Whitney two-tailed test (f).**P < 0.01.
Fig. 5
Fig. 5
BpBCM response to radiotherapy is modulated in the presence of CAF a. Schematic representation of the treatment protocol. Models matured for 4 days before treatment application and analysis 72h post-treatment. b, c. BpBCM in triCAF co-culture conditions. MCF-7 GFP + Fluorescence Mean Intensity (FMI) after irradiation (b, N = 3, n = 12–16) and paclitaxel (c, N = 3, n = 24–27) 72h post-treatment at specified doses, compared to non treated control. d. Representative immunostaining for ki67 (gray), MCF-7 GFP+ (green), nuclei (blue) of triNMF and triCAF models after 0 or 10 Gy irradiations. Scale bar: 100 μm. e,f. Quantifications of mean spheroid volume (e) and ki67 positivity (f). g. ki67 positive spheroids volume distribution (N = 3, n = 15–16). h. Clustered heatmap of detected cytokines in conditioned medium from day 4 to day 7 (N = 4). All data represent mean ± s.d., each datapoint represents a single spheroid (g). P-values were calculated with Kruskal-Wallis test followed by Dunn's post-hoc test. *P < 0.05; **P < 0.01; ****P < 0.0001; ns: not significant.

References

    1. Sung H., et al. Global cancer statistics 2020: GLOBOCAN estimates of incidence and mortality worldwide for 36 cancers in 185 countries. CA A Cancer J. Clin. 2021;71:209–249. - PubMed
    1. Luque-Bolivar A., Pérez-Mora E., Villegas V.E., Rondón-Lagos M. Resistance and overcoming resistance in breast cancer. Breast Cancer. 2020;12:211–229. - PMC - PubMed
    1. Quail D.F., Joyce J.A. Microenvironmental regulation of tumor progression and metastasis. Nat. Med. 2013;19:1423–1437. - PMC - PubMed
    1. Place A.E., Jin Huh S., Polyak K. The microenvironment in breast cancer progression: biology and implications for treatment. Breast Cancer Res. 2011;13:227. - PMC - PubMed
    1. Fernández-Nogueira P., et al. Cancer-associated fibroblasts in breast cancer treatment response and metastasis. Cancers. 2021;13:3146. - PMC - PubMed