. 2024 Jun 6;6(10):101128.
doi: 10.1016/j.jhepr.2024.101128. eCollection 2024 Oct.

HBV-related HCC development in mice is STAT3 dependent and indicates an oncogenic effect of HBx

Affiliations

HBV-related HCC development in mice is STAT3 dependent and indicates an oncogenic effect of HBx

Marc Ringelhan et al. JHEP Rep. .

Abstract

Background & aims: Although most hepatocellular carcinoma (HCC) cases are driven by hepatitis and cirrhosis, a subset of patients with chronic hepatitis B develop HCC in the absence of advanced liver disease, indicating the oncogenic potential of hepatitis B virus (HBV). We investigated the role of HBV transcripts and proteins on HCC development in the absence of inflammation in HBV-transgenic mice.

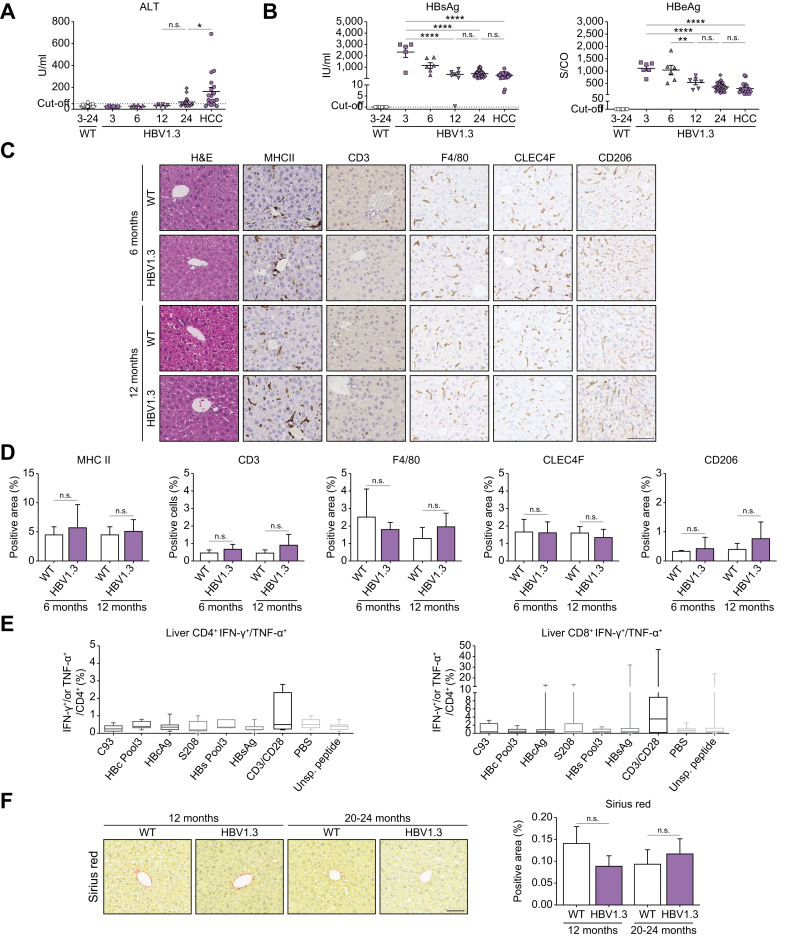
Methods: HBV-transgenic mice replicating HBV and expressing all HBV proteins from a single integrated 1.3-fold HBV genome in the presence or absence of wild-type HBx (HBV1.3/HBVxfs) were analyzed. Flow cytometry, molecular, histological and in vitro analyses using human cell lines were performed. Hepatocyte-specific Stat3- and Socs3-knockout was analyzed in HBV1.3 mice.

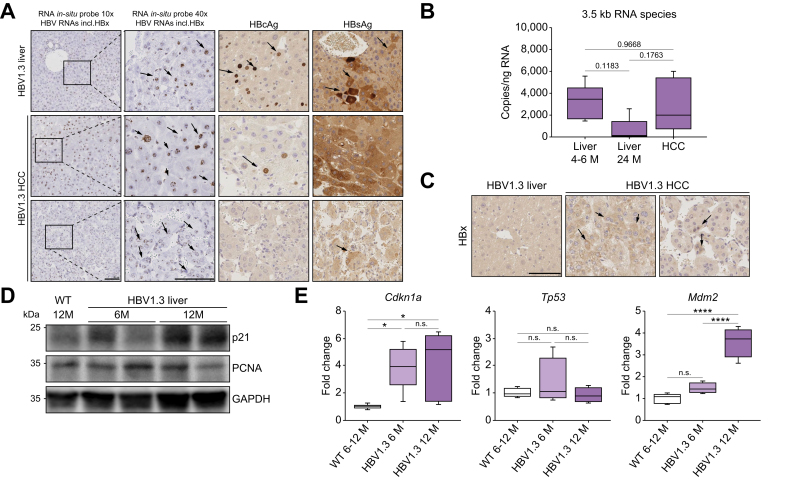
Results: Approximately 38% of HBV1.3 mice developed liver tumors. Protein expression patterns, histology, and mutational landscape analyses indicated that tumors resembled human HCC. HBV1.3 mice showed no signs of active hepatitis, except STAT3 activation, up to the time point of HCC development. HBV-RNAs covering HBx sequence, 3.5-kb HBV RNA and HBx-protein were detected in HCC tissue. Interestingly, HBVxfs mice expressing all HBV proteins except a C-terminally truncated HBx (without the ability to bind DNA damage binding protein 1) showed reduced signs of DNA damage response and had a significantly reduced HCC incidence. Importantly, intercrossing HBV1.3 mice with a hepatocyte-specific STAT3-knockout abrogated HCC development.

Conclusions: Expression of HBV-proteins is sufficient to cause HCC in the absence of detectable inflammation. This indicates the oncogenic potential of HBV and in particular HBx. In our model, HBV-driven HCC was STAT3 dependent. Our study highlights the immediate oncogenic potential of HBV, challenging the idea of a benign highly replicative phase of HBV infection and indicating the necessity for an HBV 'cure'.

Impact and implications: Although most HCC cases in patients with chronic HBV infection occur after a sequence of liver damage and fibrosis, a subset of patients develops HCC without any signs of advanced liver damage. We demonstrate that the expression of all viral transcripts in HBV-transgenic mice suffices to induce HCC development independent of inflammation and fibrosis. These data indicate the direct oncogenic effects of HBV and emphasize the idea of early antiviral treatment in the 'immune-tolerant' phase (HBeAg-positive chronic HBV infection).

Keywords: HBV; HBV x-protein; HBx; HCC; Hepatitis B; Hepatocellular carcinoma; STAT3.


Figures

Image 1
Graphical abstract
Fig. 1
Fig. 1
HBV1.3 mice spontaneously develop tumors resembling human HCC. (A) Top: Graphical summary of experimental design (created with BioRender.com). Below: IHC staining for HBcAg and HBsAg in representative liver sections of control (WT) and HBV1.3 mice at 24 months of age (scale bar: 100 μm). (B) Macroscopic pictures of unaffected WT mouse liver and HBV1.3 liver with tumor nodules (arrows indicate tumors) and bar graph of total number of mice analyzed at 20–24 months of age (cases without tumor in white and livers with HCC in purple) of WT and HBV1.3 mice (Fisher’s exact test, ∗∗∗p <0.001). (C) Representative H&E and IHC staining of collagen IV, GP73, and ki67 of WT and HCC-bearing HBV1.3 mice (scale bar: 100 μm). (D) aCGH displaying chromosomal aberrations in micro-dissected HCC samples (gains in red and losses in blue). Each row resembles an HCC sample. (E) Quantification and IHC staining for AFP, HBcAg, and HBsAg in HCC of HBV1.3 mice (n = 25; three different staining patterns of HCC are shown, scale bar: 100 μm). (F) Quantitative RT-qPCR for up/downregulated genes in HCC of HBV1.3 mice (n = 12) compared with and normalized to 24-month-old WT liver tissue (n = 6). Box plots indicate interquartile range and median of relative expression. The whiskers extend above and below min. to max., t test, two-tailed with Welch’s correction: ∗p <0.05, ∗∗p <0.01. aCGH, array-based comparative genomic hybridization; AFP, alpha-fetoprotein; GP73, Golgi protein-73; HBcAg, hepatitis B core antigen; HBsAg, hepatits B surface antigen; HCC, hepatocellular carcinoma; H&E, hematoxylin and eosin; IHC, immunohistochemistry; ki67, antigen KI-67/MKI67; RT-qPCR, quantitative reverse transcription polymerase chain reaction; WT, wild-type.
Fig. 2
Fig. 2
HBV1.3 mice develop HCC in the absence of inflammation. (A) Serum ALT levels and (B) HBsAg and HBeAg levels in serum of HBV1.3 and WT mice at the indicated months of age and in HBV1.3 mice with HCC (ns = not significant, ∗p <0.05, ∗∗p <0.01, ∗∗∗∗p <0.0001 in ordinary one-way ANOVA). (C) Representative H&E and IHC staining for MHCII, CD3, F4/80, CLEC4F, CD206 at indicated time points (scale bar: 100 μm) and (D) quantification of positive cells/positive area at 6 and 12 months of age (data represent mean with SD; WT n = 3–5; HBV1.3 n = 4–6 for each time point, ordinary one-way ANOVA). (E) Flow cytometry analysis of CD4+ and CD8+ T cells isolated from livers of 24-month-old HBV1.3 mice after ex vivo stimulation with indicated antigens/controls and intracellular staining for IFN-γ and TNF-α. Box plots (indicating interquartile range and median) represent pooled data for TNF-α and/or INF-γ positive cells. The whiskers extend above and below min. to max. (for single stains and quantification see Fig. S2). (F) Sirius Red staining of livers from WT and HBV1.3 mice at indicated time points and quantification of positive area (data represent mean with SD; n = 4–5, ordinary one-way ANOVA; ns: not significant. ALT, alanine aminotransferase; CD206, cluster of differentiation 206; CD3, cluster of differentiation 3; CD4, cluster of differentiation 4; CD8, cluster of differentiation 8; CLEC4F, C-type lectin domain family 4 member F; F4/80, EGF-like module-containing mucin-like hormone receptor-like 1; HBcAg, hepatitis B core antigen; HBeAg, hepatitis B e-antigen; HBsAg, hepatits B surface antigen; HCC, hepatocellular carcinoma; H&E, hematoxylin and eosin; IFN-γ Interferon gamma; IHC, immunohistochemistry; MHCII, major histocompatibility complex class II; SD, standard deviation; TNF-α, tumor necrosis factor alpha; WT, wild-type.
Fig. 3
Fig. 3
Expression of 3.5-kb RNA species and HBx in HCC. (A) Representative pictures of RNA in situ hybridization on FFPE slides using a labeling probe covering all HBV transcripts including HBx and IHC for HBcAg and HBsAg on consecutive FFPE cuts of HBV1.3 liver and HCC tissue (scale bar: 100 μm). (B) Amount of HBV 3.5-kb RNA species by ddPCR using HBV primers for 3.5-kb RNA in liver and HCC tissue at indicated time points (p values indicated, ordinary one-way ANOVA, n = 5 per group). (C) IHC staining for HBx protein in liver and HCC tissue of HBV1.3 mice (40 × magnification). (D) Western blot analysis for p21, PCNA, and GAPDH as loading control in liver tissue of WT and HBV1.3 mice at 6 and 12 months of age. (E) RT-qPCR for expression of Cdkn1a, Tp53, and Mdm2 in liver tissue of control (WT; n = 3) and HBV1.3 (n = 4) mice at 6 and 12 months of age. Box plots (indicating interquartile range and median) show relative expression. The whiskers extend above and below minimum to maximum, ns = not significant, ∗p <0.05, ∗∗∗∗p <0.0001, ordinary one-way ANOVA. Cnkn1a, Cyclin Dependent Kinase Inhibitor 1A; ddPCR, droplet digital polymerase chain reaction; FFPE, formalin-fixed, paraffin-embedded; GAPDH, glyceraldehyde-3-phosphate dehydrogenase; HBcAg, hepatitis B core antigen; HBsAg, hepatits B surface antigen; HCC, hepatocellular carcinoma; IHC, immunohistochemistry; p21, CDK-inhibitor 1; Mdm2, mouse double minute 2 homolog; PCNA, proliferating cell nuclear antigen; RT-qPCR, quantitative reverse transcription polymerase chain reaction; Tp53, Tumor Protein P53; WT, wild-type.
Fig. 4
Fig. 4
Functional knockout of HBx in HBVxfs mice reduces signs of DNA damage. (A) Representative H&E and IHC staining for HBcAg and HBsAg at indicated time points in WT, HBV1.3, and HBVxfs livers (scale bar: 100 μm). (B) Quantification of HBcAg-positive hepatocytes and HBsAg-positive area (data represent mean with SD; n = 5–6; ns = not significant, ∗p <0.05, ∗∗p <0.01, ∗∗∗p <0.001, ordinary one-way ANOVA). (C) Western blot analysis of SMC6 in cell lysates from HepG2 cells 48 h after transduction with empty, HBx, or XFS expressing adenovirus. (D) Relative activity of HBV X and HBV Core promoter driven luciferase reporter constructs after co-transfection with empty vector or constructs expressing HBx, HBx.R96E, or HBx-XFS as indicated (data represent mean with SD; ∗∗∗p <0.001, ∗∗∗∗p <0.0001, ordinary one-way ANOVA). (E) Representative IHC staining of livers from WT, HBV1.3, and HBVxfs mice for γH2AX, ClCaspase3, and ki67 at indicated time points (scale bar: 100 μm) and quantification of % positive hepatocytes at 6 and 12 months of age (data represent mean with SD; n = 4–5, ordinary one-way ANOVA). (F) RT-qPCR for Cdkn1a, Mdm2, Atm, and Tp53 in liver tissue of 6- and 12-month-old control, HBV1.3, and HBVxfs mice (data represent mean with SD of relative gene expression; WT n = 3–6; HBV1.3 n = 4–5, HBVxfs n = 4–5 each time point; ∗p <0,05, ∗∗p <0,01, ∗∗∗∗p <0,0001, ordinary one-way ANOVA). γH2AX, phosphorylation of the H2A histone family member X; Atm, protein kinase ataxia telangiectasia mutated; ClCaspase3, Cleaved Caspase-3; H&E, hematoxylin and eosin; HBcAg, hepatitis B core antigen; HBsAg, hepatits B surface antigen; IHC, immunohistochemistry; ki67, antigen KI-67/MKI67; p21, CDK-inhibitor 1; Mdm2, mouse double minute 2 homolog; RT-qPCR, quantitative reverse transcription polymerase chain reaction; SMC6, Structural Maintenance of Chromosomes 6; Tp53, Tumor Protein P53; WT, wild-type; XFS, X frame-shift.
Fig. 5
Fig. 5
HBV1.3 mice expressing WT HBx develop significantly more HCC compared with HBVxfs. (A) Macroscopic pictures of HBV1.3 and HBVxfs livers with tumor nodules (arrows indicate tumors) and bar graph indicating number of HCCs in total number of HBV1.3 (same group of mice from Fig. 1) and HBVxfs mice analyzed (unaffected livers in white and livers with tumors in purple, Fisher’s exact test, ∗∗∗∗p <0.0001). (B) Quantification of maximum tumor nodule size measured in H&E-stained FFPE sections and total number of tumor nodules found in one liver (data represent mean with SD, ∗p <0.05, t test). (C) HBsAg and HBeAg levels in serum of WT, HBVxfs mice and HBVxfs mice with HCC at the indicated time points (top graph). Below, quantification of HBV 3.5-kb RNA species analyzed by ddPCR in liver and HCC tissue of HBVxfs mice at indicated time points (ns = not significant, ∗∗∗∗p <0.0001, ordinary one-way ANOVA). (D) H&E and IHC staining of Collagen IV, GP73, and ki67 (scale bar, 100 μm) of HCC from HBV1.3 and HBVxfs mice. (E) aCGH of micro-dissected tumor samples displaying chromosomal aberrations (gains red and losses blue) in HBV1.3 and HBVxfs mice. Each row resembles a tumor sample, frequency of chromosomal aberrations is visualized. (F) Heatmap visualizing expression pattern of indicated genes in tumor tissue of HBV1.3 and HBVxfs animals analyzed in triplicate by RT-qPCR. Color code indicates downregulation (green) and upregulation (red) (0.02–130 in fold change, normalized to WT liver tissue). aCGH, array-based comparative genomic hybridization; ddPCR, droplet digital polymerase chain reaction; FFPE, formalin-fixed, paraffin-embedded; GP73, Golgi protein-73; H&E, hematoxylin and eosin; HBcAg, hepatitis B core antigen; HBeAg, hepatitis B e-antigen; HBsAg, hepatits B surface antigen; HCC, hepatocellular carcinoma; IHC, immunohistochemistry; ki67, antigen KI-67/MKI67; RT-qPCR, quantitative reverse transcription polymerase chain reaction; SD, standard deviation; WT, wild-type.
Fig. 6
Fig. 6
HCC in HBV1.3 critically depends on STAT3 activation. (A) Representative IHC staining for pSTAT3 in WT, HBV1.3 and HBVxfs liver tissue at 24 months of age and three examples for low, medium and high pSTAT3-positive HCCs in HBV1.3 and HBVxfs mice (scale bar, 50 μm). (B) Quantification of pSTAT3-positive hepatocyte nuclei shown as box plots indicating interquartile range and median. The whiskers extend above and below minimum to maximum (ns = not significant, ∗p <0.05 in Brown-Forsythe and Welsh ANOVA; n = 6–14). (C) RT-qPCR for gp130 in liver tissue of 6-month-old WT (n = 3), HBV1.3 (n = 5), and HBVxfs (n = 5) mice (data represent mean with SEM; ∗∗p <0.005, ∗∗∗∗p <0.0001, ordinary one-way ANOVA). (D) Breeding scheme for hepatocyte-specific knockout of STAT3 (HBV1.3_AlbCreSTAT3f/f = HBV1.3_STAT3Δhep) and SOCS3 (HBV1.3_AlbCreSOCS3f/f = HBV1.3_SOCSΔhep) in HBV1.3 mice (created with BioRender.com). (E) Representative IHC staining for pSTAT3 in liver tissue of 12 months old WT, HBV1.3, HBV1.3_STAT3Δhep and HBV1.3_SOCS3Δhep mice. (scale bar, 50 μm) (F) Incidence of HCC development in HBV1.3, HBV1.3_STAT3Δhep and HBV1.3_SOCS3Δhep mice. Compared were HBV1.3 (n=29: including HBV.1.3_STAT3f/f and HBV1.3_SOCS3f/f) vs. HBV1.3_STAT3Δhep (n=21) mice using Fisher's exact test (∗p <0.05) and HBV1.3_STAT3Δhep (n = 21) vs. HBV1.3_SOCS3Δhep (n = 32) mice using Fisher’s exact test (∗∗p <0.005). gp130, Glycoprotein 130; HCC, hepatocellular carcinoma; IHC, immunohistochemistry; pSTAT3, phosphorylated Signal transducer and activator of transcription 3; RT-qPCR, quantitative reverse transcription polymerase chain reaction; SOCS3, Suppressor of cytokine signaling 3; WT, wild-type.

References

    1. Liu Z., Jiang Y., Yuan H., et al. The trends in incidence of primary liver cancer caused by specific etiologies: results from the Global Burden of Disease Study 2016 and implications for liver cancer prevention. J Hepatol. 2019;70:674–683. - PubMed
    1. Trepo C., Chan H.L., Lok A. Hepatitis B virus infection. Lancet. 2014;384:2053–2063. - PubMed
    1. World Health Organization . 2017. Global Hepatitis Report.https://www.who.int/news-room/fact-sheets/detail/hepatitis-b Available from:
    1. Akinyemiju T., Abera S., Ahmed M., et al. The burden of primary liver cancer and underlying etiologies from 1990 to 2015 at the global, regional, and national level: results from the Global Burden of Disease Study 2015. JAMA Oncol. 2017;3:1683–1691. - PMC - PubMed
    1. Chen C.J., Yang H.I. Natural history of chronic hepatitis B REVEALed. J Gastroenterol Hepatol. 2011;26:628–638. - PubMed

LinkOut - more resources