

doi: 10.12688/wellcomeopenres.19764.1.
eCollection 2023.
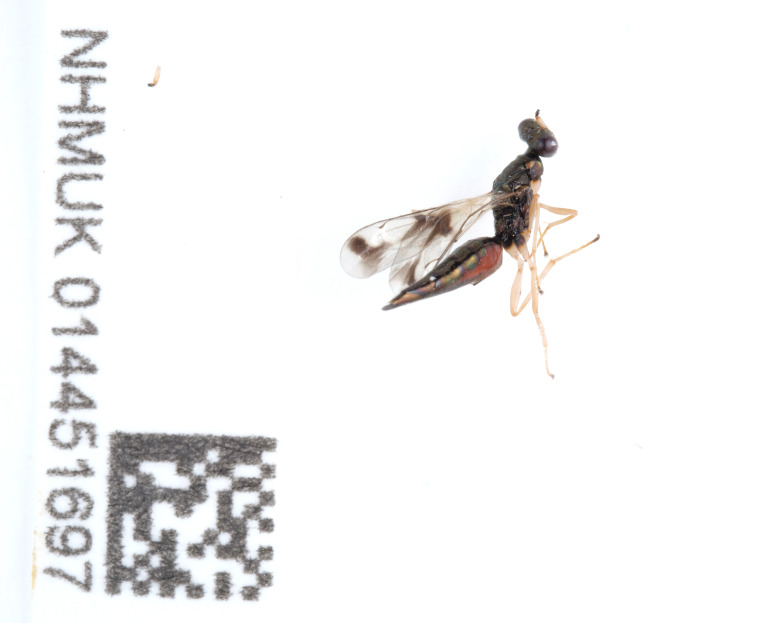
The genome sequence of a chalcid wasp, Gastracanthus pulcherrimus (Westwood, 1833)
Affiliations
- PMID: 39290573
- PMCID: PMC11406124
- DOI: 10.12688/wellcomeopenres.19764.1
Item in Clipboard
The genome sequence of a chalcid wasp, Gastracanthus pulcherrimus (Westwood, 1833)
Wellcome Open Res.
.
Abstract
We present a genome assembly from an individual female Gastracanthus pulcherrimus (a chalcid wasp; Arthropoda; Insecta; Hymenoptera; Pteromalidae). The genome sequence is 1,010.0 megabases in span. Most of the assembly is scaffolded into 5 chromosomal pseudomolecules. The mitochondrial genome has also been assembled and is 24.4 kilobases in length.
Keywords: Gastracanthus pulcherrimus; Hymenoptera; chalcid wasp; chromosomal; genome sequence.
Copyright: © 2023 Broad GR et al.
Conflict of interest statement
No competing interests were disclosed.
Figures
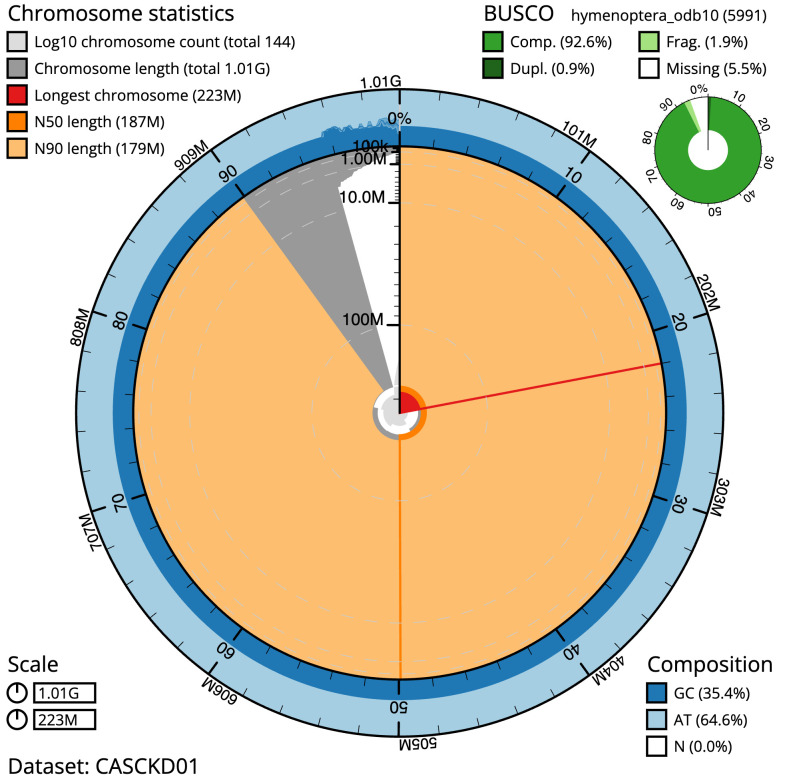
The BlobToolKit Snailplot shows N50 metrics and BUSCO gene completeness. The main plot is divided into 1,000 size-ordered bins around the circumference with each bin representing 0.1% of the 1,010,024,266 bp assembly. The distribution of scaffold lengths is shown in dark grey with the plot radius scaled to the longest scaffold present in the assembly (222,508,353 bp, shown in red). Orange and pale-orange arcs show the N50 and N90 scaffold lengths (186,761,157 and 179,352,141 bp), respectively. The pale grey spiral shows the cumulative scaffold count on a log scale with white scale lines showing successive orders of magnitude. The blue and pale-blue area around the outside of the plot shows the distribution of GC, AT and N percentages in the same bins as the inner plot. A summary of complete, fragmented, duplicated and missing BUSCO genes in the hymenoptera_odb10 set is shown in the top right. An interactive version of this figure is available at
https://blobtoolkit.genomehubs.org/view/iyGasPulc2.1/dataset/CASCKD01/snail .
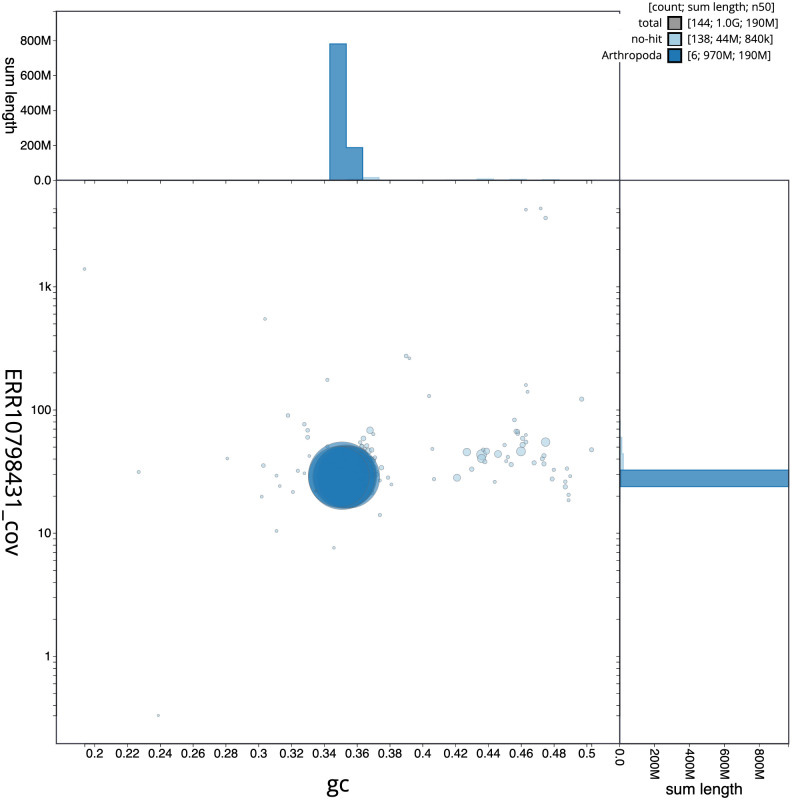
Scaffolds are coloured by phylum. Circles are sized in proportion to scaffold length. Histograms show the distribution of scaffold length sum along each axis. An interactive version of this figure is available at
https://blobtoolkit.genomehubs.org/view/iyGasPulc2.1/dataset/CASCKD01/blob .
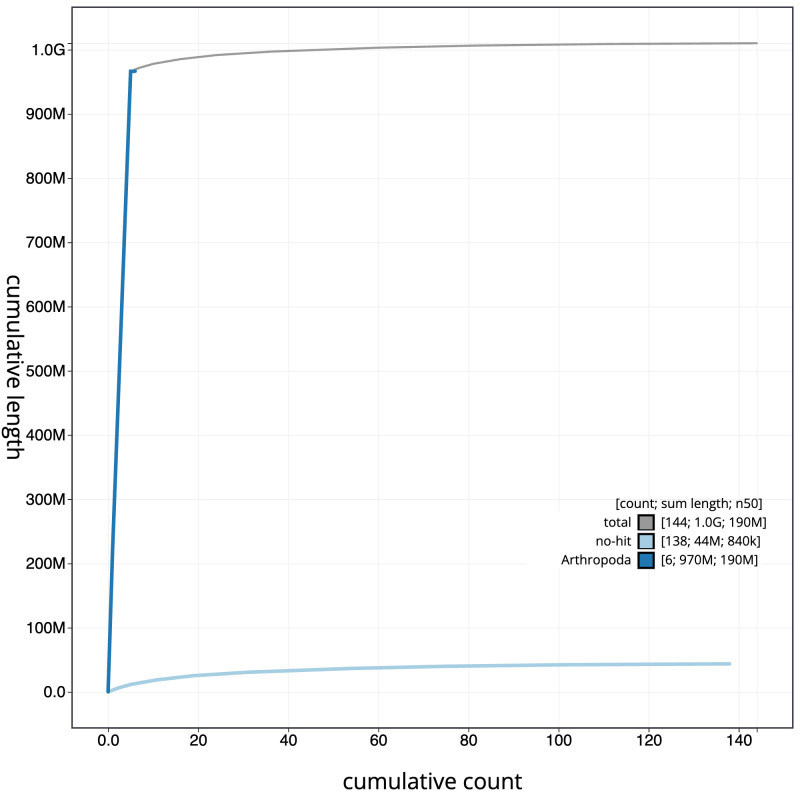
The grey line shows cumulative length for all scaffolds. Coloured lines show cumulative lengths of scaffolds assigned to each phylum using the buscogenes taxrule. An interactive version of this figure is available at
https://blobtoolkit.genomehubs.org/view/iyGasPulc2.1/dataset/CASCKD01/cumulative .
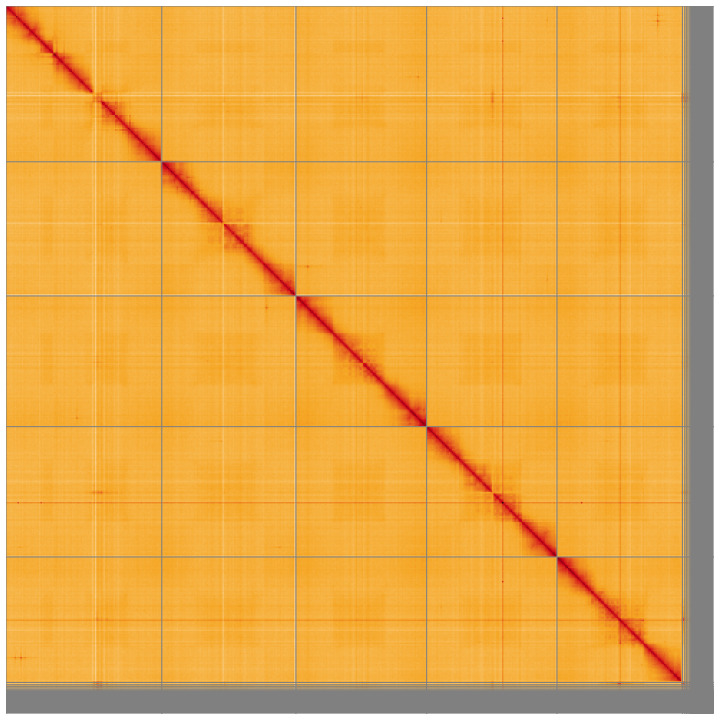
Chromosomes are shown in order of size from left to right and top to bottom. An interactive version of this figure may be viewed at
https://genome-note-higlass.tol.sanger.ac.uk/l/?d=Yrs3ERn6RL-maDBtEFqvcA .
References
-
- Burks R, Mitroiu MD, Fusu L, et al. : From hell’s heart I stab at thee! A determined approach towards a monophyletic Pteromalidae and reclassification of Chalcidoidea (Hymenoptera). J Hymenopt Res. 2022;94(2):13–88. 10.3897/jhr.94.94263 - DOI
Grants and funding
LinkOut - more resources
Full Text Sources
