Plasma miRNAs across the Alzheimer's disease continuum: Relationship to central biomarkers
- PMID: 39291737
- PMCID: PMC11567826
- DOI: 10.1002/alz.14230
Plasma miRNAs across the Alzheimer's disease continuum: Relationship to central biomarkers
Abstract
Introduction: MicroRNAs (miRNAs) play important roles in gene expression regulation and Alzheimer's disease (AD) pathogenesis.
Methods: We investigated the association between baseline plasma miRNAs and central AD biomarkers from the Alzheimer's Disease Neuroimaging Initiative (ADNI; N = 803): amyloid, tau, and neurodegeneration (A/T/N). Differentially expressed miRNAs and their targets were identified, followed by pathway enrichment analysis. Machine learning approaches were applied to investigate the role of miRNAs as blood biomarkers.
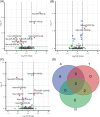
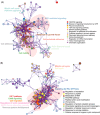
Results: We identified nine, two, and eight miRNAs significantly associated with A/T/N positivity, respectively. We identified 271 genes targeted by amyloid-related miRNAs with estrogen signaling receptor-mediated signaling among the enriched pathways. Additionally, 220 genes targeted by neurodegeneration-related miRNAs showed enrichment in pathways including the insulin growth factor 1 pathway. The classification performance of demographic information for A/T/N positivity was increased up to 9% with the inclusion of miRNAs.
Discussion: Plasma miRNAs were associated with central A/T/N biomarkers, highlighting their potential as blood biomarkers.
Highlights: We performed association analysis of microRNAs (miRNAs) with amyloid/tau/neurodegeneration (A/T/N) biomarker positivity. We identified dysregulated miRNAs for A/T/N biomarker positivity. We identified Alzheimer's disease biomarker-specific/common pathways related to miRNAs. miRNAs improved the classification for A/T/N positivity by up to 9%. Our study highlights the potential of miRNAs as blood biomarkers.
Keywords: Alzheimer's disease; amyloid; biomarkers; classification; microRNAs; neurodegeneration; plasma; tau.
© 2024 The Author(s). Alzheimer's & Dementia published by Wiley Periodicals LLC on behalf of Alzheimer's Association.
Conflict of interest statement
Dr. Saykin receives support from multiple NIH grants (P30 AG010133, P30 AG072976, R01 AG019771, R01 AG057739, U19 AG024904, R01 LM013463, R01 AG068193, T32 AG071444, U01 AG068057, U01 AG072177, and U19 AG074879). He has also received support from Avid Radiopharmaceuticals, a subsidiary of Eli Lilly (in kind contribution of PET tracer precursor) and participated on scientific advisory boards (Bayer Oncology, Eisai, Novo Nordisk, and Siemens Medical Solutions USA, Inc.) and an observational study monitoring board (MESA, NIH NHLBI), as well as external advisory committees for multiple NIA grants. He also serves as editor‐in‐chief of
Figures


References
MeSH terms
Substances
Grants and funding
- RF1 AG057768/AG/NIA NIH HHS/United States
- R01 LM012535/GF/NIH HHS/United States
- IU Health-IU School of Medicine Strategic Neuroscience Research Initiative
- P30 AG072976/AG/NIA NIH HHS/United States
- T32 AG071444/AG/NIA NIH HHS/United States
- SFB1286/Deutsche Forschungsgemeinschaft
- U01 AG058589/GF/NIH HHS/United States
- EuroImmun
- Biogen
- U01 AG068221/AG/NIA NIH HHS/United States
- P50 GM115318/GM/NIGMS NIH HHS/United States
- R01 AG019771/AG/NIA NIH HHS/United States
- R01 AG084624/AG/NIA NIH HHS/United States
- U01 AG072177/AG/NIA NIH HHS/United States
- P30 AG010133/AG/NIA NIH HHS/United States
- Alzheimer's Disease Neuroimaging Initiative
- R01 LM013463/GF/NIH HHS/United States
- P30 AG013846/GF/NIH HHS/United States
- Alzheimer's Drug Discovery Foundation
- Servier
- UL1 TR001108/GM/NIGMS NIH HHS/United States
- Lumosity
- U19 AG074879/AG/NIA NIH HHS/United States
- Bristol-Myers Squibb Company
- U01 AG024904/AG/NIA NIH HHS/United States
- Piramal Imaging
- P30 AG072976/GF/NIH HHS/United States
- U01 AG068057/AG/NIA NIH HHS/United States
- P30 AG010133/GF/NIH HHS/United States
- T32 AG071444/GF/NIH HHS/United States
- Takeda Pharmaceutical Company
- ALZ/Alzheimer's Association/United States
- Genentech, Inc.
- ERA-NET Neuron project
- R01 AG057739/GF/NIH HHS/United States
- P30 AG013846/AG/NIA NIH HHS/United States
- U01 AG068057/GF/NIH HHS/United States
- Araclon Biotech
- R01 AG019771/GF/NIH HHS/United States
- P30 AG10133/GF/NIH HHS/United States
- Meso Scale Diagnostics, LLC
- Novartis Pharmaceuticals Corporation
- U01 AG072177/GF/NIH HHS/United States
- CereSpir, Inc.
- UL1 TR001108/TR/NCATS NIH HHS/United States
- BioClinica, Inc.
- U19 AG024904/AG/NIA NIH HHS/United States
- GE Healthcare
- Indiana Clinical and Translational Science Institute
- GRK2824/Deutsche Forschungsgemeinschaft
- R01 AG061788/GM/NIGMS NIH HHS/United States
- RF1 AG072654/AG/NIA NIH HHS/United States
- U01 AG058589/AG/NIA NIH HHS/United States
- P50GM115318/GM/NIGMS NIH HHS/United States
- R01 AG068193/GF/NIH HHS/United States
- RF1 AG057768/GF/NIH HHS/United States
- AbbVie
- RF1 AG072654/GF/NIH HHS/United States
- German Federal Ministry of Science and Education
- Transition Therapeutics
- German Federal Ministry of 1 Science and Education
- R01 AG19771/GF/NIH HHS/United States
- Cogstate
- U19 AG024904/GF/NIH HHS/United States
- U01 AG024904/GF/NIH HHS/United States
- U19 AG074879/GF/NIH HHS/United States
- EB/NIBIB NIH HHS/United States
- R03 AG063250/GF/NIH HHS/United States
- R01 AG061788/AG/NIA NIH HHS/United States
- Johnson & Johnson Pharmaceutical Research & Development LLC
- RF1AG078299/GF/NIH HHS/United States
- F. Hoffmann-La Roche Ltd
- Pfizer Inc.
- Elan Pharmaceuticals, Inc.
- K01 AG049050/AG/NIA NIH HHS/United States
- R01 AG057739/AG/NIA NIH HHS/United States
- Eli Lilly and Company
- R01 AG068193/AG/NIA NIH HHS/United States
- R01 LM012535/LM/NLM NIH HHS/United States
- IXICO Ltd.
- EXC 2067/1 390729940/Germany's Excellence Strategy
- NeuroRx Research
- R03 AG063250/AG/NIA NIH HHS/United States
- RF1 AG078299/AG/NIA NIH HHS/United States
- Merck & Co., Inc.
- 16LW0055/GoBIO project miRassay
- Janssen Alzheimer Immunotherapy Research & Development, LLC
- EPI-3E/The EU Joint Programme- Neurodegenerative Diseases (JPND)
- R01DK122503/GF/NIH HHS/United States
- K01 AG049050/GM/NIGMS NIH HHS/United States
- U01AG068221/GF/NIH HHS/United States
- Neurotrack Technologies
- Fujirebio
- Lundbeck
- Eisai Inc.
- R01 LM013463/LM/NLM NIH HHS/United States
- W81XWH-12-2-0012/Department of Defense
- 1738/Deutsche Forschungsgemeinschaft
- R01 DK122503/DK/NIDDK NIH HHS/United States
LinkOut - more resources
Full Text Sources
Medical

