The plasma miRNAome in ADNI: Signatures to aid the detection of at-risk individuals
- PMID: 39291752
- PMCID: PMC11567822
- DOI: 10.1002/alz.14157
The plasma miRNAome in ADNI: Signatures to aid the detection of at-risk individuals
Abstract
Introduction: MicroRNAs are short non-coding RNAs that control proteostasis at the systems level and are emerging as potential prognostic and diagnostic biomarkers for Alzheimer's disease (AD).
Methods: We performed small RNA sequencing on plasma samples from 847 Alzheimer's Disease Neuroimaging Initiative (ADNI) participants.
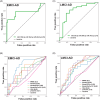
Results: We identified microRNA signatures that correlate with AD diagnoses and help predict the conversion from mild cognitive impairment (MCI) to AD.
Discussion: Our data demonstrate that plasma microRNA signatures can be used to not only diagnose MCI, but also, critically, predict the conversion from MCI to AD. Moreover, combined with neuropsychological testing, plasma microRNAome evaluation helps predict MCI to AD conversion. These findings are of considerable public interest because they provide a path toward reducing indiscriminate utilization of costly and invasive testing by defining the at-risk segment of the aging population.
Highlights: We provide the first analysis of the plasma microRNAome for the ADNI study. The levels of several microRNAs can be used as biomarkers for the prediction of conversion from MCI to AD. Adding the evaluation of plasma microRNA levels to neuropsychological testing in a clinical setting increases the accuracy of MCI to AD conversion prediction.
Keywords: Alzheimer's disease; blood biomarker; cognitive decline; microRNA; mild cognitive impairment; plasma; small non‐coding RNA.
© 2024 The Author(s). Alzheimer's & Dementia published by Wiley Periodicals LLC on behalf of Alzheimer's Association.
Conflict of interest statement
The authors declare no conflicts of interest. Author disclosures are available in the Supporting information.
Figures


References
MeSH terms
Substances
Grants and funding
- RF1 AG057768/AG/NIA NIH HHS/United States
- T32 AG071444/AG/NIA NIH HHS/United States
- U19AG068753/GF/NIH HHS/United States
- U19 AG024904/AG/NIA NIH HHS/United States
- 16LW0055/GoBIO Project miRassay
- U19AG024904/GF/NIH HHS/United States
- EPINEURODEVO/German Federal Ministry of Science and Education
- RF1AG072654/GF/NIH HHS/United States
- EPI-3E/EU Joint Programme- Neurodegenerative Diseases (JPND)
- R01 DK122503/DK/NIDDK NIH HHS/United States
- U01 AG068221/AG/NIA NIH HHS/United States
- R01 AG019771/AG/NIA NIH HHS/United States
- R01 AG084624/AG/NIA NIH HHS/United States
- U01 AG072177/AG/NIA NIH HHS/United States
- P30 AG010133/AG/NIA NIH HHS/United States
- U19AG074879/GF/NIH HHS/United States
- U01AG068057/GF/NIH HHS/United States
- 20SFRN35460034/American Heart Association
- U19 AG074879/AG/NIA NIH HHS/United States
- P30AG072976/GF/NIH HHS/United States
- T32AG071444/GF/NIH HHS/United States
- U01 AG068057/AG/NIA NIH HHS/United States
- P30 AG013846/AG/NIA NIH HHS/United States
- P30 AG072978/AG/NIA NIH HHS/United States
- ADNI4/GF/NIH HHS/United States
- RF1AG057768/GF/NIH HHS/United States
- U01AG072177/GF/NIH HHS/United States
- SFB1286/DFG (Deutsche Forschungsgemeinschaft) Priority Program
- AG067188/GF/NIH HHS/United States
- R01LM013463/GF/NIH HHS/United States
- U01AG068221-01A1/GF/NIH HHS/United States
- GRK2824/DFG (Deutsche Forschungsgemeinschaft) Priority Program
- R01 AG080670/AG/NIA NIH HHS/United States
- RF1 AG072654/AG/NIA NIH HHS/United States
- 1738/DFG (Deutsche Forschungsgemeinschaft) Priority Program
- AARG-NTF-20-643020/ALZ/Alzheimer's Association/United States
- R01AG080670/GF/NIH HHS/United States
- U01 AG058589/AG/NIA NIH HHS/United States
- RF1AG078299/GF/NIH HHS/United States
- R01AG019771/GF/NIH HHS/United States
- P30AG010133/GF/NIH HHS/United States
- R01 AG057739/AG/NIA NIH HHS/United States
- R01 AG068193/AG/NIA NIH HHS/United States
- P30AG013846/GF/NIH HHS/United States
- P30 AG072976/AG/NIA NIH HHS/United States
- R01AG057739/GF/NIH HHS/United States
- EXC 2067/1 390729940/Germany's Excellence Strategy
- RF1 AG078299/AG/NIA NIH HHS/United States
- P30AG073107/GF/NIH HHS/United States
- P30AG072978/GF/NIH HHS/United States
- P30PENNADRC/GF/NIH HHS/United States
- U01AG058589/GF/NIH HHS/United States
- P30 AG073107/AG/NIA NIH HHS/United States
- R01DK122503/GF/NIH HHS/United States
- R01AG068193/GF/NIH HHS/United States
- U19 AG068753/AG/NIA NIH HHS/United States
- R01 LM013463/LM/NLM NIH HHS/United States
LinkOut - more resources
Full Text Sources
Medical

