. 2024 Oct 23;90(10):e0146624.
doi: 10.1128/aem.01466-24. Epub 2024 Sep 18.

Frequent and asymmetric cell division in endosymbiotic bacteria of cockroaches

Affiliations

Frequent and asymmetric cell division in endosymbiotic bacteria of cockroaches

Tomohito Noda et al. Appl Environ Microbiol. .

Abstract

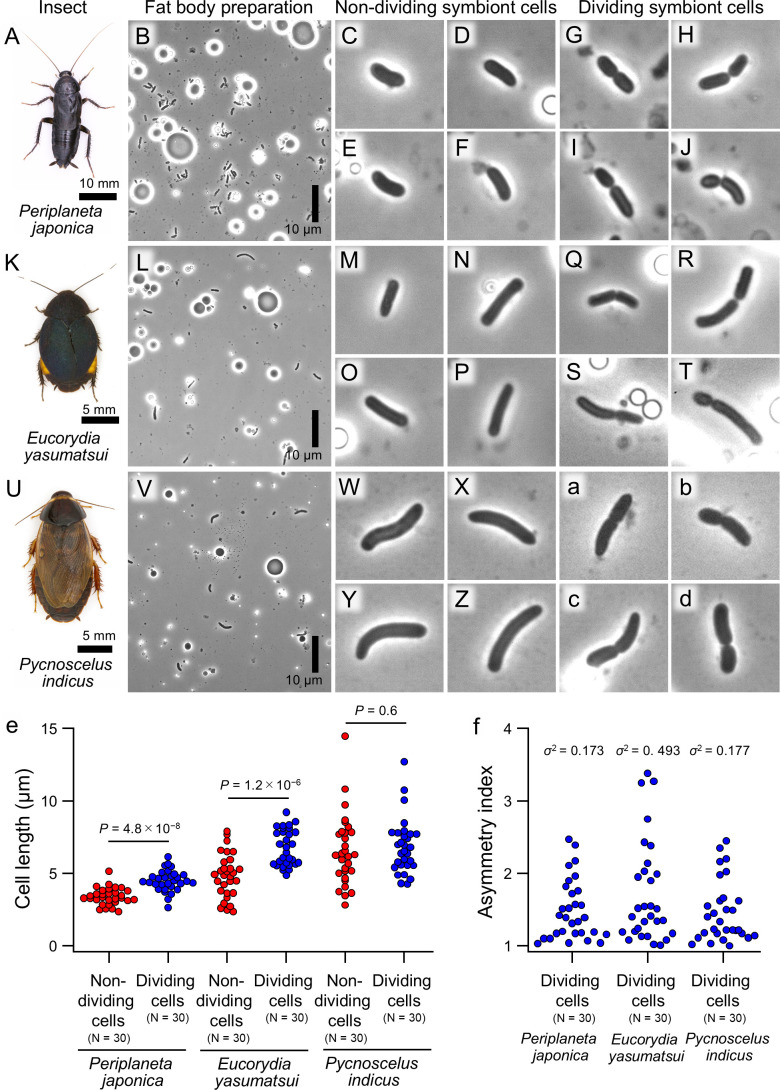
Many insects are obligatorily associated with and dependent on specific microbial species as essential mutualistic partners. In the host insects, such microbial mutualists are usually maintained in specialized cells or organs, called bacteriocytes or symbiotic organs. Hence, potentially exponential microbial growth cannot be realized but must be strongly constrained by spatial and resource limitations within the host cells or tissues. How such endosymbiotic bacteria grow, divide, and proliferate is important for understanding the interactions and dynamics underpinning intimate host-microbe symbiotic associations. Here we report that Blattabacterium, the ancient and essential endosymbiont of cockroaches, exhibits unexpectedly high rates of cell division (20%-58%) and, in addition, the cell division is asymmetric (average asymmetry index >1.5) when isolated from the German cockroach Blattella germanica. The asymmetric division of endosymbiont cells at high frequencies was observed irrespective of host tissues (fat bodies vs ovaries) or developmental stages (adults vs nymphs vs embryos) of B. germanica, and also observed in several different cockroach species. By contrast, such asymmetric and frequent cell division was observed neither in Buchnera, the obligatory bacterial endosymbiont of aphids, nor in Pantoea, the obligatory bacterial gut symbiont of stinkbugs. Comparative genomics of cell division-related genes uncovered that the Blattabacterium genome lacks the Min system genes that determine the cell division plane, which may be relevant to asymmetric cell division. These observations combined with comparative symbiont genomics provide insight into what processes and regulations may underpin the growth, division, and proliferation of such bacterial mutualists continuously constrained under within-host conditions.IMPORTANCEDiverse insects are dependent on specific bacterial mutualists for their survival and reproduction. Due to the long-lasting coevolutionary history, such symbiotic bacteria tend to exhibit degenerative genomes and suffer uncultivability. Because of their microbiological fastidiousness, the cell division patterns of such uncultivable symbiotic bacteria have been poorly described. Here, using fine microscopic and quantitative morphometric approaches, we report that, although bacterial cell division usually proceeds through symmetric binary fission, Blattabacterium, the ancient and essential endosymbiont of cockroaches, exhibits frequent and asymmetric cell division. Such peculiar cell division patterns were not observed with other uncultivable essential symbiotic bacteria of aphids and stinkbugs. Gene repertoire analysis revealed that the molecular machinery for regulating the bacterial cell division plane are lost in the Blattabacterium genome, suggesting the possibility that the general trend toward the reductive genome evolution of symbiotic bacteria may underpin their bizarre cytological/morphological traits.

Keywords: Blattabacterium; Blattella germanica; Buchnera; Escherichia coli; Pantoea; aphid; cell division; cockroach; stinkbug; symbiotic bacteria.


Conflict of interest statement

The authors declare no conflict of interest.

Figures

Fig 1
Fig 1
Morphology of Blattabacterium symbiont cells prepared from fat bodies of the adult German cockroach B. germanica. (A) An adult insect. (B) Dissected fat bodies. (C–O) Phase-contrast microscopic images of isolated symbiont cells. (C) A low magnification image. (D–I) Magnified images of non-dividing symbiont cells. (J–O) Magnified images of dividing symbiont cells. (P) Comparison of lengths of non-dividing and dividing symbiont cells. The difference is significant statistically (Student’s t-test: P = 1.0 x 10⁻⁹). Also, see Table S1. (Q) Asymmetry indices of dividing symbiont cells defined as the length of the longer daughter cell divided by the length of the shorter daughter cell. Also, see Table S2. Panels (D–O) are 10 μm x 10 µm squares.
Fig 2
Fig 2
Backscattered electron scanning electron microscopic images of Blattabacterium symbiont cells of B. germanica. (A and B) Symbiont cells are packed in a bacteriocyte, which is embedded within the fat body. (C and D) Symbiont cells are associated with developing oocytes in the ovary. Arrows indicate symbiont cells in asymmetric division. Abbreviations: bn, bacteriocyte nucleus; oc, oocyte; fc, follicle cell.
Fig 3
Fig 3
Morphology of Blattabacterium symbiont cells prepared from adult ovaries, nymphal ovaries, and embryos of the German cockroach B. germanica. (A–J) Data from ovaries dissected from adult insects. (A) Dissected ovaries. (B–J) Phase-contrast microscopic images of isolated symbiont cells. (B) A low magnification image. (C–F) Magnified images of non-dividing symbiont cells. (G–J) Magnified images of dividing symbiont cells. (K–U) Data from ovaries dissected from 2nd instar nymphs. (K) A 2nd instar nymph. (L) Dissected ovaries. (M–U) Phase-contrast microscopic images of isolated symbiont cells. (M) A low magnification image. (N–Q) Magnified images of non-dividing symbiont cells. (R-U) Magnified images of dividing symbiont cells. (V–e) Data from embryos dissected from oothecae. (V) An embryo. (W–e) Phase-contrast microscopic images of isolated symbiont cells. (W) A low magnification image. (X–a) Magnified images of non-dividing symbiont cells. (b–e) Magnified images of dividing symbiont cells. (f) Comparisons of lengths of non-dividing symbiont cells from adult ovaries, nymphal ovaries, and embryos, and also lengths of dividing symbiont cells from adult ovaries, nymphal ovaries, and embryos. The differences within the categories, namely non-dividing cells and dividing cells respectively, are not significant statistically (Tukey HSD test: P > 0.9, P > 0.7), whereas the differences between the categories for each material, namely adult ovaries, nymphal ovaries, or embryos, are all statistically significant (Student’s t-test: P = 1.1 x 10⁻¹¹, P = 3.6 x 10⁻¹¹, P = 2.1 x 10⁻¹³). Also, see Table S1. (g) Asymmetry indices of dividing symbiont cells defined as the length of the longer daughter cell divided by the length of the shorter daughter cell, for adult ovaries, nymphal ovaries, and embryos. Also, see Table S2. Panels (C–J), (N–U), and (X–e) are 10 μm x 10 µm squares.
Fig 4
Fig 4
Morphology of Blattabacterium symbiont cells prepared from different cockroach species. (A–J) Data from the Japanese cockroach Periplaneta japonica. (A) An adult insect. (B–J) Phase-contrast microscopic images of isolated symbiont cells. (B) A low magnification image. (C–F) Magnified images of non-dividing symbiont cells. (G–J). Magnified images of dividing symbiont cells. (K–T) Data from the azure cockroach Eucorydia yasumatsui. (K) An adult insect. (L–T) Phase-contrast microscopic images of isolated symbiont cells. (L) A low magnification image. (M–P) Magnified images of non-dividing symbiont cells. (Q–T). Magnified images of dividing symbiont cells. (U–d) Data from the Indian cockroach Pycnoscelus indicus. (U) An adult insect. (V–d) Phase-contrast microscopic images of isolated symbiont cells. (V) A low magnification image. (W–Z) Magnified images of non-dividing symbiont cells. (a–d). Magnified images of dividing symbiont cells. (e) Comparisons of lengths of non-dividing and dividing symbiont cells from P. japonica, E. yasumatsui, and P. indicus. The differences between non-dividing and dividing symbiont cells are significant statistically for P. japonica and E. yasumatsui (Student’s t-test: P = 4.8 x 10⁻⁸, P = 1.2 x 10⁻⁶), whereas no significant difference was detected for P. inducus (Student’s t-test: P = 0.6). Also, see Table S1. (f) Asymmetry indices of dividing symbiont cells defined as the length of the longer daughter cell divided by the length of the shorter daughter cell, for P. japonica, E. yasumatsui, and P. indica. Also, see Table S2. Panels (C–J), (M–T), and (W–d) are 10 μm x 10 µm squares.
Fig 5
Fig 5
Morphology of symbiont cells from the pea aphid Acyrthosiphon pisum and the brown-winged stinkbug Plautia stali. (A–K) Data of Buchnera endosymbiont cells prepared from bacteriocytes of A. pisum. (A) An adult insect. (B) Dissected bacteriocytes. (C–K) Phase-contrast microscopic images of isolated symbiont cells. (C) A low magnification image. (D–G) Magnified images of non-dividing symbiont cells. (H–K). Magnified images of dividing symbiont cells. (L–V) Data of Pantoea gut symbiont cells prepared from the midgut symbiotic organ of P. stali. (L) An adult insect. (M) A dissected midgut symbiotic organ. (N–V) Phase-contrast microscopic images of isolated symbiont cells. (N) A low magnification image. (O–R) Magnified images of non-dividing symbiont cells. (S–V). Magnified images of dividing symbiont cells. (W) Comparisons of lengths of non-dividing and dividing symbiont cells. The differences are significant statistically for both A. pisum and P. stali (Student’s t-test: P = 6.6 x 10⁻²², P = 1.0 x 10⁻¹²). (X) Asymmetry indices of dividing symbiont cells are defined as the length of the longer daughter cell divided by the length of the shorter daughter cell, for A. pisum and P. stali. Also, see Table S2. Panels (D–K) and (O–V) are 10 μm x 10 µm squares.
Fig 6
Fig 6
Cell division dynamics from exponential to stationary phases of E. coli proliferation. (A) Growth curve of E. coli, in which optical densities of replicate cultures (n = 4) are averaged and plotted with standard deviations. (B) Phase-contrast microscopic image of E. coli cells in an exponential phase of proliferation, in which the majority of cells are in division. (C) Phase-contrast microscopic image of E. coli cells in a stationary phase of proliferation, in which only a few cells are in division. (D) Relationship between E. coli proliferation and dividing cell ratio (n = 22). Also, see Table S7.

Similar articles

References

    1. Donachie WD. 1993. The cell cycle of Escherichia coli. Annu Rev Microbiol 47:199–230. doi:10.1146/annurev.mi.47.100193.001215 - DOI - PubMed
    1. Adams DW, Errington J. 2009. Bacterial cell division: assembly, maintenance and disassembly of the Z ring. Nat Rev Microbiol 7:642–653. doi:10.1038/nrmicro2198 - DOI - PubMed
    1. Osella M, Tans SJ, Cosentino Lagomarsino M. 2017. Step by step, cell by cell: quantification of the bacterial cell cycle. Trends Microbiol 25:250–256. doi:10.1016/j.tim.2016.12.005 - DOI - PubMed
    1. Angert ER. 2005. Alternatives to binary fission in bacteria. Nat Rev Microbiol 3:214–224. doi:10.1038/nrmicro1096 - DOI - PubMed
    1. Young KD. 2006. The selective value of bacterial shape. Microbiol Mol Biol Rev 70:660–703. doi:10.1128/MMBR.00001-06 - DOI - PMC - PubMed

LinkOut - more resources