. 2024 Jul 15;13(10):bio060515.
doi: 10.1242/bio.060515. Epub 2024 Oct 14.

Manipulating mitochondrial reactive oxygen species alters survival in unexpected ways in a Drosophila Cdk5 model of neurodegeneration

Affiliations

Manipulating mitochondrial reactive oxygen species alters survival in unexpected ways in a Drosophila Cdk5 model of neurodegeneration

Andrew P K Wodrich et al. Biol Open. .

Abstract

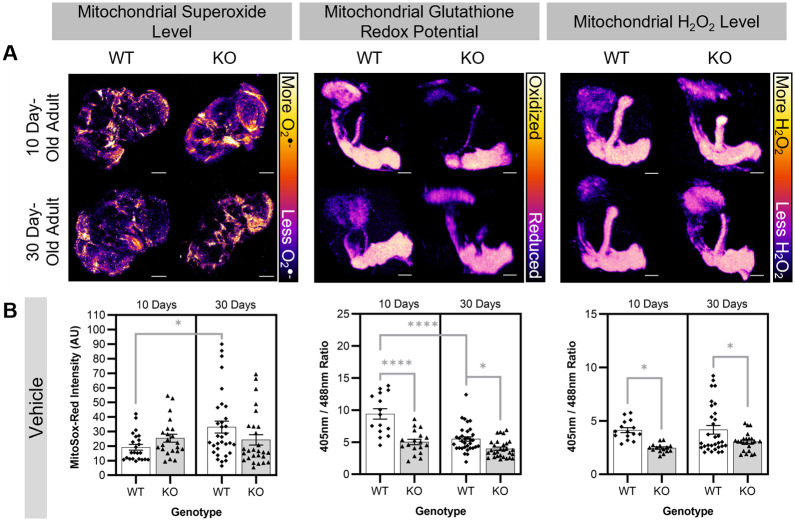
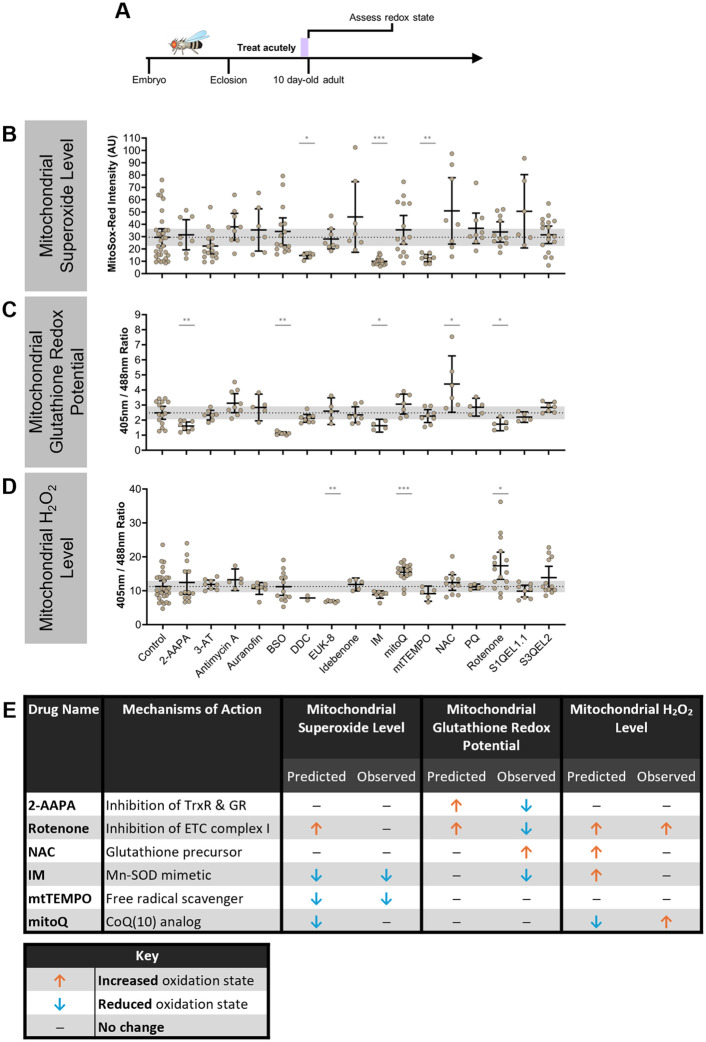
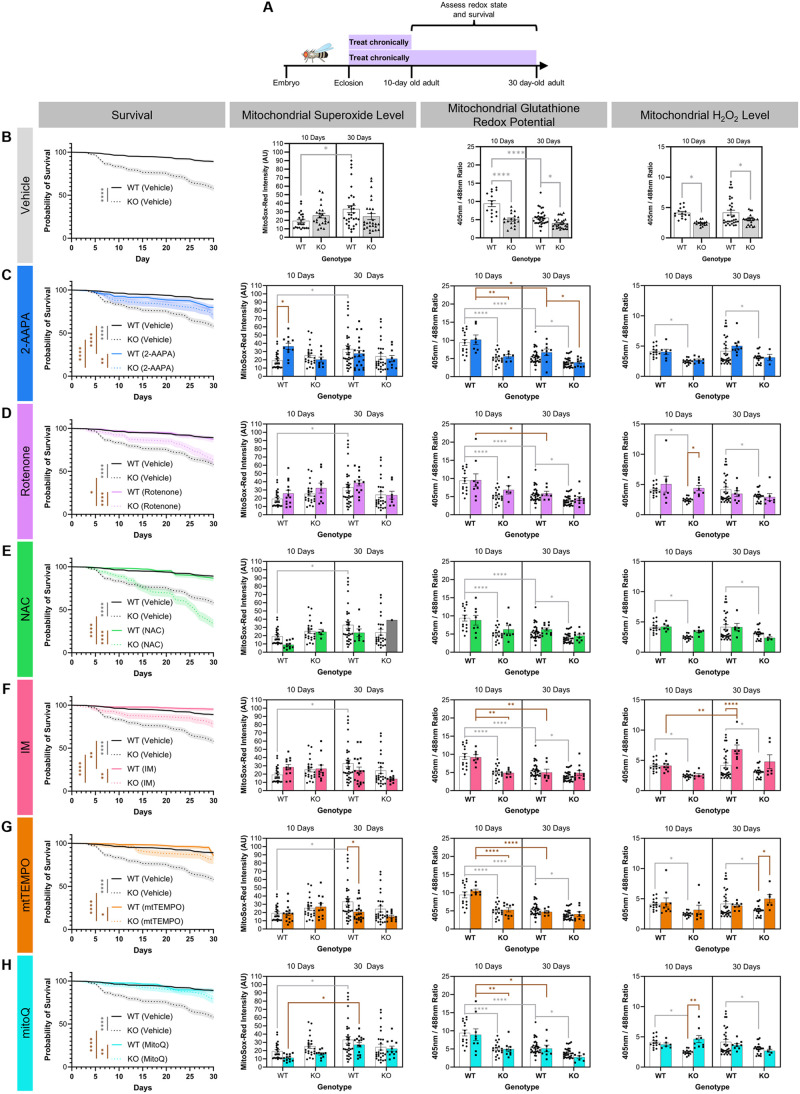
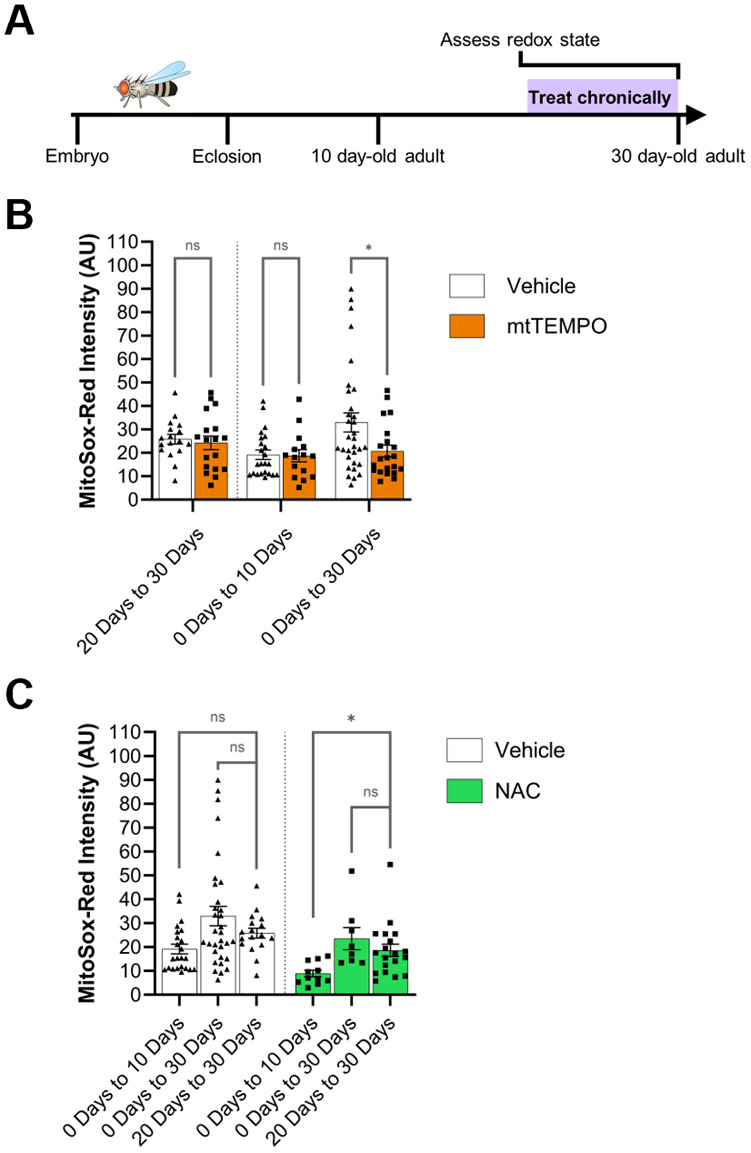
Reactive oxygen species (ROS) are associated with aging and neurodegeneration, but the significance of this association remains obscure. Here, using a Drosophila Cdk5 model of age-related neurodegeneration, we probe this relationship in the pathologically relevant tissue, the brain, by quantifying three specific mitochondrial ROS and manipulating these redox species pharmacologically. Our goal is to ask whether pathology-associated changes in redox state are detrimental for survival, whether they may be beneficial responses to pathology, or whether they are covariates of pathology that do not alter viability. We find, surprisingly, that increasing mitochondrial H2O2 correlates with improved survival. We also find evidence that drugs that alter the mitochondrial glutathione redox potential modulate survival primarily through the compensatory effects they induce rather than through their direct effects on the final mitochondrial glutathione redox potential. We also find that the response to treatment with a redox-altering drug varies depending on the age and genotype of the individual receiving the drug as well as the duration of the treatment. These data have important implications for the design and interpretation of studies investigating the effect of redox state on health and disease as well as on efforts to modify the redox state to achieve therapeutic goals.

Keywords: Cdk5; Mitochondria; Neurodegeneration; Reactive oxygen species (ROS).


Conflict of interest statement

Competing interests The authors declare no competing or financial interests.

Figures

Fig. 1.
Fig. 1.
Baseline measurements of changes in three reactive oxygen species in WT and Cdk5α-KO. (A) Representative images of 10-day-old WT, 10-day-old Cdk5α-KO, 30-day-old WT, and 30-day-old Cdk5α-KO brains stained with MitoSox-Red, MBs expressing 201Y>mito-roGFP2-Grx1, or MBs expressing 201Y>mito-roGFP2-Orp1 used to determine mitochondrial superoxide level, mitochondrial glutathione redox potential, or mitochondrial H2O2 level, respectively. For the mitochondrial superoxide level images, the scale bars represent 100 µm. For the mitochondrial glutathione redox potential and H2O2 level images, the scale bars represent 30 µm. For all images, the ‘Fire’ look-up table was used with warmer colors (yellows and oranges) corresponding to higher ROS level or more oxidized glutathione redox potential and cooler colors (blues and purples) corresponding to lower ROS level or more reduced glutathione redox potential. (B) Quantification of mitochondrial superoxide level, mitochondrial glutathione redox potential, or mitochondrial H2O2 level in WT or Cdk5α-KO flies fed vehicle chronically until aged 10-days old or 30-days old (DMSO or EtOH; to permit comparisons with pharmacological challenge, described below). Note that there are no significant differences between the two vehicles (Fig. S4). A higher MitoSox-Red intensity indicates a higher mitochondrial superoxide level. A larger 405 nm/488 nm ratio indicates a more oxidized mitochondrial glutathione redox potential (for 201Y>mito-roGFP2-Grx1) or a higher mitochondrial H2O2 level (for 201Y>mito-roGFP2-Orp1). Groups were compared using two-way ANOVA with Šidák's multiple comparison test. P values: *<0.05; **<0.01; ***<0.001; ****<0.0001. N=23 (WT, 10 days old, mitochondrial superoxide level), 22 (KO, 10 days old, mitochondrial superoxide level), 32 (WT, 30 days old, mitochondrial superoxide level), 27 (KO, 30 days old, mitochondrial superoxide level), 15 (WT, 10 days old, mitochondrial glutathione redox potential), 18 (KO, 10 days old, mitochondrial glutathione redox potential), 33 (WT, 30 days old, mitochondrial glutathione redox potential), 29 (KO, 30 days old, mitochondrial glutathione redox potential), 15 (WT, 10 days old, mitochondrial H2O2 level), 15 (KO, 10 days old, mitochondrial H2O2 level), 31 (WT, 30 days old, mitochondrial H2O2 level), 23 (KO, 30 days old, mitochondrial H2O2 level).
Fig. 2.
Fig. 2.
Acute feeding of redox-altering drugs. (A) Schematic of experimental design. WT flies were aged until 9 days old before feeding drugs acutely for 1 day. At 10 days old, flies were assessed for changes in mitochondrial redox parameters. In panels (B-D), error bars represent the 95% confidence intervals, and the gray shaded background represents the 95% confidence interval of controls. Differences between drug and control were compared using Kolmogorov–Smirnov tests. P values: *<0.05; **<0.01; ***<0.001; ****<0.0001. (B) Quantification of mitochondrial superoxide level after acute feeding with 16 different drugs or vehicle control. Note that raw MitoSox-Red values cannot be directly compared to chronic feeding experiments due to differences in imaging settings. A higher MitoSox-Red intensity indicates a higher mitochondrial superoxide level. N=32 (control), 8 (2-AAPA), 16 (3-AT), 9 (antimycin A), 7 (auranofin), 15 (BSO), 6 (DDC), 8 (EUK-8), 7 (idebenone), 15 (IM), 15 (mitoQ), 8 (mtTEMPO), 8 (NAC), 9 (PQ), 11 (rotenone), 6 (S1QEL1.1), 17 (S3QEL2). (C) Quantification of mitochondrial glutathione redox potential after acute feeding with 16 different drugs or vehicle control. Note that raw 405 nm/488 nm values cannot be directly compared to chronic feeding experiments due to differences in imaging settings. A larger 405 nm/488 nm ratio indicates a more oxidized mitochondrial glutathione redox potential. N=15 (control), 8 (2-AAPA), 7 (3-AT), 9 (antimycin A), 5 (auranofin), 7 (BSO), 8 (DDC), 5 (EUK-8), 7 (idebenone), 4 (IM), 7 (mitoQ), 8 (mtTEMPO), 6 (NAC), 5 (PQ), 5 (rotenone), 5 (S1QEL1.1), 7 (S3QEL2). (D) Quantification of mitochondrial H2O2 level after acute feeding with 16 different drugs or vehicle control. Note that raw 405 nm/488 nm values cannot be directly compared to chronic feeding experiments due to differences in imaging settings. A larger 405 nm/488 nm ratio indicates a higher mitochondrial H2O2 level. N=29 (control), 13 (2-AAPA), 8 (3-AT), 5 (antimycin A), 7 (auranofin), 13 (BSO), 2 (DDC), 6 (EUK-8), 5 (idebenone), 7 (IM), 16 (mitoQ), 5 (mtTEMPO), 11 (NAC), 5 (PQ), 16 (rotenone), 8 (S1QEL1.1), 12 (S3QEL2). (E) Summary table of predicted and observed effects of drugs selected for further analysis in this study. The drug effects are indicated by the orange up arrow (drug predicted to lead to an increased oxidation state), the blue down arrow (drug predicted to lead to a decreased oxidation state), or a black bar (drug predicted to led to no change in survival or oxidation state or a prediction cannot be made for the given drug).
Fig. 3.
Fig. 3.
Chronic feeding of redox-altering drugs. (A) Schematic of experimental design. WT and Cdk5α-KO flies were chronically fed drugs from 0 days old until either 10 days old or 30 days old at which point flies were assessed for changes in mitochondrial redox parameters. Survival of all flies was monitored for 30 days. (B) Quantification of survival, mitochondrial superoxide level, mitochondrial glutathione redox potential, and mitochondrial H2O2 level in WT and Cdk5α-KO flies fed vehicle (DMSO or EtOH) only; there are no significant differences based on the vehicle used (Fig. S4). Note that the mitochondrial superoxide level, mitochondrial glutathione redox potential, and mitochondrial H2O2 level data in this panel are replotted here from Fig. 1B for the reader's convenience and all vehicle data are pooled in all the following panels of this figure to compare the effects of drug versus vehicle. Note also that the raw MitoSox-Red intensity and 405 nm/488 nm values cannot be compared directly to those from the acute drug feeding due to equipment differences. A higher MitoSox-Red intensity indicates a higher mitochondrial superoxide level. A larger 405 nm/488 nm ratio indicates a more oxidized mitochondrial glutathione redox potential (for 201Y>mito-roGFP2-Grx1) or a higher mitochondrial H2O2 level (for 201Y>mito-roGFP2-Orp1). Shaded backgrounds in survival figures represent s.e.m. Differences in survival among groups were assessed by Mantel–Cox log-rank test with Bonferroni multiple comparison test. Differences in mitochondrial ROS among groups were assessed by two-way ANOVA with Bonferroni multiple comparison test. Light gray significance bars represent significant comparisons between vehicle groups and are presented in all the following panels. P values: *<0.05; **<0.01; ***<0.001; ****<0.0001. For survival data, N=1482 (WT, vehicle, survival), 1022 (KO, vehicle, survival). For mitochondrial superoxide level, mitochondrial glutathione redox potential, and mitochondrial H2O2 level data, sample sizes are listed in the legend to Fig. 1B. (C-H) Quantification of survival, mitochondrial superoxide level, mitochondrial glutathione redox potential, and mitochondrial H2O2 level in WT and Cdk5α-KO flies fed 2-AAPA (C), rotenone (D), NAC (E), IM (F), mtTEMPO (G), or mitoQ (H). Note that vehicle controls are the same as shown in panel (B) and are shared for all drugs. Note that for the mitochondrial superoxide level measurement, N=1 for 30-day-old Cdk5α-KO, and this is denoted by a gray bar (E). A higher MitoSox-Red intensity indicates a higher mitochondrial superoxide level. A larger 405 nm/488 nm ratio indicates a more oxidized mitochondrial glutathione redox potential (for 201Y>mito-roGFP2-Grx1) or a higher mitochondrial H2O2 level (for 201Y>mito-roGFP2-Orp1). Shaded backgrounds in survival figures represent s.e.m. Differences in survival among groups were assessed by Mantel–Cox log-rank test with Bonferroni multiple comparison test. Differences in mitochondrial ROS among groups were assessed by two-way ANOVA with Bonferroni multiple comparison test. Brown significance bars represent significant comparisons that include drug-treated groups. P values: *<0.05; **<0.01; ***<0.001; ****<0.0001. Samples sizes for data in Fig. 3C-H can be found in Table S3.
Fig. 4.
Fig. 4.
Effects of redox-altering drug treatment duration versus age at treatment assessment. (A) Schematic of experimental design. WT flies were raised until 20 days old without drug treatment before being fed drugs chronically until 30 days old. The mitochondrial superoxide level was then assessed in these flies at 30 days old and compared to data from Fig. 3. (B) Comparison of mitochondrial superoxide level in flies fed mtTEMPO versus vehicle from 20 days old until 30 days old. Data from quantification of mitochondrial superoxide level of flies fed mtTEMPO from 0 days old until either 10 days old or 30 days old are the same as that presented in Fig. 3. Vehicle-treated groups were compared to mtTEMPO-treated groups for each chronic feeding paradigm by two-way ANOVA with Šidák's multiple comparison test. P values: *<0.05; **<0.01; ***<0.001; ****<0.0001. N=17 (vehicle, 20 days to 30 days), 18 (mtTEMPO, 20 days to 30 days), 23 (vehicle, 0 days to 10 days), 15 (mtTEMPO, 0 days to 10 days), 32 (vehicle, 0 days to 30 days), 21 (mtTEMPO, 0 days to 30 days). (C) Comparison of mitochondrial superoxide level among flies fed NAC or among flies fed vehicle from 20 days old until 30 days old. Data from quantification of mitochondrial superoxide level of flies fed NAC from 0 days old until either 10 days old or 30 days old are the same as that presented in Fig. 3. Vehicle-treated groups and NAC-treated groups were compared using one-way ANOVAs with Dunnett's multiple comparison tests. P values: *<0.05; **<0.01; ***<0.001; ****<0.0001. N=23 (vehicle, 0 days to 10 days), 32 (vehicle, 0 days to 30 days), 17 (vehicle, 20 days to 30 days), 11 (NAC, 0 days to 10 days), 8 (NAC, 0 days to 30 days), 19 (NAC, 20 days to 30 days).
Fig. 5.
Fig. 5.
Comparative transcriptomics of acute versus chronic redox-altering drug treatment. (A) Schematic of experimental design. WT flies were fed drugs either acutely (for 24 h, with assay at 10 days old) or chronically (for 10 days) before brains were dissected and groups of 20 brains were pooled for transcriptomic analysis. (B) Heatmap of correlation amongst experimental groups based on 184 differentially expressed genes that contribute significantly to the variance amongst samples. Selected genes had a linear fold change of means>|1.5| and a corrected P<0.05. N=7 (acute, DMSO), 6 (acute, 2-AAPA), 7 (acute, mitoQ), 6 (chronic, DMSO), 7 (chronic, 2-AAPA), 6 (chronic, mitoQ).

Update of

Similar articles

References

    1. Albrecht, S. C., Barata, A. G., Großhans, J., Teleman, A. A. and Dick, T. P. (2011). In vivo mapping of hydrogen peroxide and oxidized glutathione reveals chemical and regional specificity of redox homeostasis. Cell Metab. 14, 819-829. 10.1016/j.cmet.2011.10.010 - DOI - PubMed
    1. Bárcena, C., Mayoral, P. and Quirós, P. M. (2018). Mitohormesis, an antiaging paradigm. In: Mitochondria and Longevity, Vol. 340, (ed. López-Otín C. and Galluzzi L.), pp. 35-77. Elsevier. 10.1016/bs.ircmb.2018.05.002 - DOI - PubMed
    1. Bar–Ziv, R., Bolas, T. and Dillin, A. (2020). Systemic effects of mitochondrial stress. EMBO Rep. 21, 1-15. 10.15252/embr.202050094 - DOI - PMC - PubMed
    1. Chae, T., Kwon, Y. T., Bronson, R., Dikkes, P., Li, E. and Tsai, L.-H. (1997). Mice lacking p35, a neuronal specific activator of Cdk5, display cortical lamination defects, seizures, and adult lethality. Neuron 18, 29-42. 10.1016/S0896-6273(01)80044-1 - DOI - PubMed
    1. Cheng, Y. W., Liu, J. and Finkel, T. (2023). Mitohormesis. Cell Metab. 35, 1872-1886. 10.1016/j.cmet.2023.10.011 - DOI - PMC - PubMed

Publication types