. 2024 Sep 18;19(9):e0307270.
doi: 10.1371/journal.pone.0307270. eCollection 2024.

A systematic evaluation of the performance and properties of the UK Biobank Polygenic Risk Score (PRS) Release

Affiliations

A systematic evaluation of the performance and properties of the UK Biobank Polygenic Risk Score (PRS) Release

Deborah J Thompson et al. PLoS One. .

Abstract

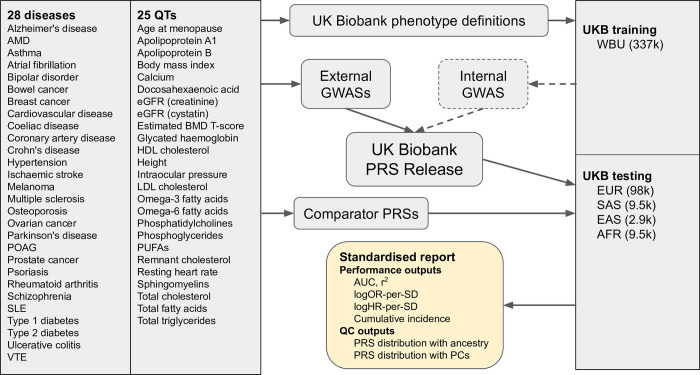
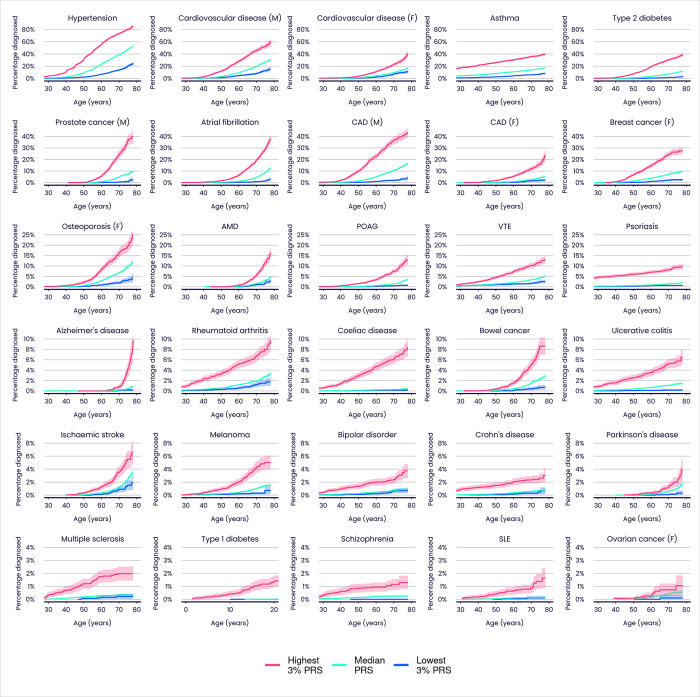
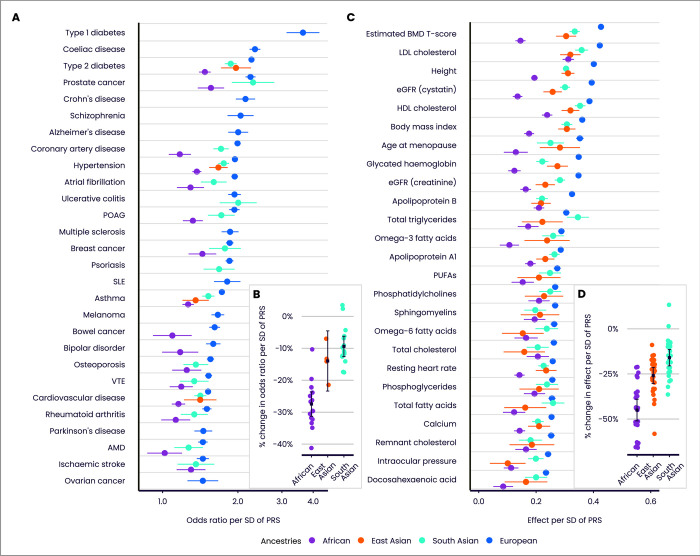
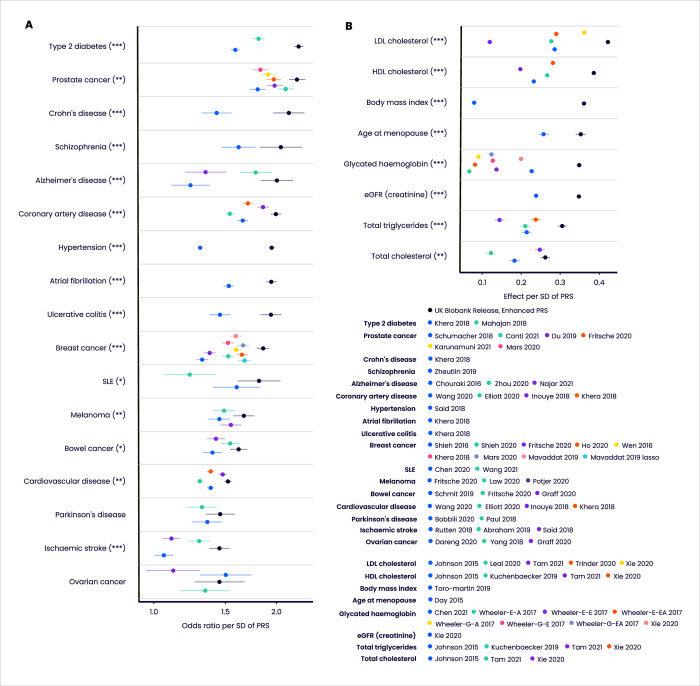
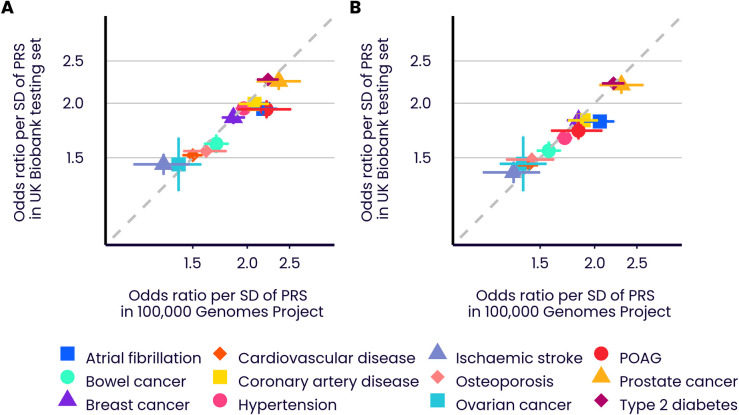
We assess the UK Biobank (UKB) Polygenic Risk Score (PRS) Release, a set of PRSs for 28 diseases and 25 quantitative traits that has been made available on the individuals in UKB, using a unified pipeline for PRS evaluation. We also release a benchmarking software tool to enable like-for-like performance evaluation for different PRSs for the same disease or trait. Extensive benchmarking shows the PRSs in the UKB Release to outperform a broad set of 76 published PRSs. For many of the diseases and traits we also validate the PRS algorithms in a separate cohort (100,000 Genomes Project). The availability of PRSs for 53 traits on the same set of individuals also allows a systematic assessment of their properties, and the increased power of these PRSs increases the evidence for their potential clinical benefit.


Conflict of interest statement

Peter Donnelly and Gil McVean are partners in Peptide Groove LLP. Deborah Thompson, Daniel Wells, Saskia Selzam, Iliana Peneva, Rachel Moore, Kevin Sharp, William Tarran, Edward Beard,Fernando Riveros-Mckay, Carla Giner-Delgado, Duncan Palmer, Priyanka Seth, James Harrison, Gil McVean, Vincent Plagnol, Peter Donnelly and Michael Weale are current or former employees of Genomics plc, and are or have been in possession of stock or stock options for Genomics plc. Peter Donnelly and Gil McVean are Founders and Directors of Genomics plc, and Peter Donnelly is the CEO of Genomics plc. This does not alter our adherence to PLOS ONE policies on sharing data and materials.

Figures

Fig 1
Fig 1. Schematic workflow of the standardised evaluation pipeline for the UK Biobank PRS Release.
The UK Biobank PRS Release comprises a Standard PRS set, trained on external GWASs only, and an Enhanced PRS set, trained on both external and internal GWASs, targeting 28 disease and 25 quantitative traits. The evaluation pipeline generates a standardised report for a PRS (either from the UK Biobank PRS Release or from a comparator) across five genetic ancestry groups in a separate UK Biobank testing subgroup. The standardised report includes information on cumulative incidence stratified by PRS; performance metrics including AUC, logHR-per-SD and logOR-per-SD for disease traits and r2 for quantitative traits; and PRS distribution metrics. QT = quantitative trait. AMD = age-related macular degeneration. POAG = primary open angle glaucoma. SLE = systemic lupus erythematosus. VTE = venous thromboembolic disease. eGFR = estimated glomerular filtration rate. BMD = bone mineral density. HDL/LDL = high/low density lipoprotein. PUFAs = polyunsaturated fatty acids. UKB = UK Biobank. WBU = white British unrelated. GWAS = genomewide association study. PRS = polygenic risk score. AUC = area under the receiver operating characteristic curve. logOR-per-SD/logHR-per-SD = log odds/hazard ratio per standard deviation of PRS. EUR = European ancestry. SAS = South Asian ancestry. EAS = East Asian ancestry. AFR = African (Sub-Saharan) ancestry. Throughout, ovarian cancer refers specifically to epithelial ovarian cancer.
Fig 2
Fig 2. Cumulative incidence plots illustrating the predictive performance of the UK Biobank PRS Release for 28 diseases in individuals with European ancestries (Enhanced PRS Set).
Each plot shows the estimated percentage of individuals diagnosed with the stated disease by a given age, for three groups within the UKB Testing Subgroup defined only by their PRS scores. Colours indicate individuals in the highest 3% (red), median 40–60% (green) and lowest 3% (blue) of the Enhanced PRS distribution. M = male, F = female. Shadings indicate 95% confidence intervals. Type 1 diabetes age range is restricted to 0–20 years. CAD = coronary artery disease. Refer to Fig 1 legend for other disease abbreviations.
Fig 3
Fig 3. Predictive performance of the UK Biobank PRS Release (Enhanced PRS Set) by ancestry group.
Performance (odds ratio, or effect on standardised quantitative trait, per SD of PRS, adjusting for age and sex), measured in the independent UKB Testing Subgroup, of the disease traits (A) and quantitative traits (C), stratified by genetically inferred ancestry. Odds ratios are shown on a log scale. Results for non-European ancestries are shown if at least 100 cases are available for testing. Relative change in performance in non-European compared to European ancestries for disease traits (B) and quantitative traits (D). Bars indicate 95% confidence intervals (CI). Refer to Fig 1 legend for disease and quantitative trait abbreviations.
Fig 4
Fig 4. Predictive performance of the UK Biobank PRS Release against published comparator PRSs.
Performance (odds ratio, or effect on standardised quantitative trait, per SD of PRS, adjusting for age and sex) in the independent UKB Testing Subgroup (European ancestries) of the Enhanced PRS sets for disease traits (A) and quantitative traits (B), for those traits for which there are published PRS algorithms (citations provided in S6 Table). Odds ratios are shown on a log scale. Bars indicate 95% confidence intervals. Asterisks indicate significance level for difference in performance between the Enhanced PRS and the nearest comparator PRS (5000 bootstraps): * p<0.05, ** p<0.01, *** p<0.001. Wheeler-E-A, Wheeler-E-E and Wheeler-E-EA refer respectively to the African, European and East Asian ancestry versions of the Wheeler 2017 PRSs for glycated haemoglobin using erythrocytic variants. Wheeler-G-A, Wheeler-G-E and Wheeler-G-EA refer respectively to the African, European and East Asian ancestry versions of the Wheeler 2017 PRSs for glycated haemoglobin using glycemic variants. Refer to Fig 1 legend for disease and quantitative trait abbreviations.
Fig 5
Fig 5. Cumulative incidence of type 2 diabetes in two ancestry groups, stratified by Enhanced PRS.
Incidence is shown for the UKB Testing Subgroup with European ancestries (A) and South Asian ancestries (B). Colours indicate individuals in the highest 3% (red), median 40–60% (green) and lowest 3% (blue) of the Enhanced PRS distribution. Shaded areas indicate 95% CI.
Fig 6
Fig 6. PRS risk profiles compared to functional variant carriers.
A) Cumulative incidence of coronary artery disease (CAD) in familial hypercholesterolemia (FH) carriers (red, 0.35% of evaluation group), compared to individuals in the top 19% of the Enhanced CAD PRS distribution (blue, percentile chosen such that the risk up to age 70 is similar to that for mutation carriers), and the median 40–60% of the PRS (green). Carrier risks are evaluated in UKB individuals with European ancestries for whom whole exome sequencing data were available. PRS risks are evaluated in the UKB Testing Subgroup (European ancestries). B) Cumulative incidence of CAD in FH carriers (red, 0.22% of evaluation group), compared to individuals in the top 8% of the Enhanced CAD PRS distribution (blue) and the median 40–60% of the PRS (green). Carrier and PRS risks are evaluated in their respective Panel A groups, additionally restricted to those with primary care data linkage and no recorded statin prescription prior to CAD event. C) Percentage of CAD cases diagnosed in individuals aged <50, <60, or <70 years that occurred in FH carriers (red) or in individuals in the top 8% of the Enhanced PRS distribution (blue). Carrier and PRS risks are evaluated in their respective Panel B groups. The ratio between the number of high PRS cases and mutation carrier cases in each age group is shown on the plot. D) Cumulative incidence of CAD in FH carriers (evaluated as in Panel A), with additional stratification by the top 10% (red), median 40–60% (green), and bottom 10% (blue) of the Standard CAD PRS. The Standard PRS is used here to maximise the number of individuals with both whole exome sequencing data and a PRS value available for analysis. Sample size details are provided in S7 Table. Bars and shadings indicate 95% CI.
Fig 7
Fig 7. Change in Standard PRS disease effect size with age.
Difference in PRS effect size (log hazard ratio per SD of PRS, based on incident events over the next 10 years) between younger (40–49) and older (60–69) age-at-first-assessment groups. Standard PRSs are presented and evaluated in all UKB individuals with European ancestries, to maximise case numbers. Alzheimer’s disease, asthma, psoriasis, schizophrenia and type 1 diabetes are omitted, because they are primarily diagnosed outside the UKB age range. Bars indicate 95% CI. Refer to Fig 1 legend for disease abbreviations.
Fig 8
Fig 8. Change in PRS effect size with sex.
Performance (odds ratio, or effect on sex-standardised quantitative trait, per SD of PRS, adjusting for age), measured in the independent UKB Testing Subgroup (European ancestries), of the Extended PRS set for disease traits (A) and quantitative traits (B), stratified by All (blue), Female (purple) and Male (orange). Odds ratios are shown on a log scale. Quantitative traits are standardised to zero mean and unit variance within each sex separately, and then combined for the ‘All’ analysis, generating a different effect size compared to Figs 3 and 4. Asterisks indicate two-tailed significance level for difference in performance effect size between females and males: * p<0.05, ** p<0.01, *** p<0.001. Refer to Fig 1 legend for disease and quantitative trait abbreviations.
Fig 9
Fig 9. Comparative predictive performance in UK Biobank and 100,000 Genomes Project.
Performance (OR per SD) across twelve diseases in the UKB Testing Subgroup and selected individuals with European ancestries from the 100,000 Genomes Project (selected to be free of rare genetic and comorbid disorders). A) Enhanced PRSs. B) Standard PRSs. Odds ratios are shown on a log scale. Coloured bars show the 95% CI of the OR per SD. Refer to Fig 1 legend for disease abbreviations.

References

    1. Torkamani A, Wineinger NE, Topol EJ. The personal and clinical utility of polygenic risk scores. Nat Rev Genet. 2018;19: 581–590. doi: 10.1038/s41576-018-0018-x - DOI - PubMed
    1. Lewis CM, Vassos E. Polygenic risk scores: from research tools to clinical instruments. Genome Med. 2020;12: 44. doi: 10.1186/s13073-020-00742-5 - DOI - PMC - PubMed
    1. Ma Y, Zhou X. Genetic prediction of complex traits with polygenic scores: a statistical review. Trends Genet. 2021;37: 995–1011. doi: 10.1016/j.tig.2021.06.004 - DOI - PMC - PubMed
    1. Page ML, Vance EL, Cloward ME, Ringger E, Dayton L, Ebbert MTW, et al. The Polygenic Risk Score Knowledge Base offers a centralized online repository for calculating and contextualizing polygenic risk scores. Commun Biol. 2022;5: 899. doi: 10.1038/s42003-022-03795-x - DOI - PMC - PubMed
    1. Wand H, Lambert SA, Tamburro C, Iacocca MA, O’Sullivan JW, Sillari C, et al. Improving reporting standards for polygenic scores in risk prediction studies. Nature. 2021;591: 211–219. doi: 10.1038/s41586-021-03243-6 - DOI - PMC - PubMed

LinkOut - more resources