. 2024 Sep 18;22(9):e3002653.
doi: 10.1371/journal.pbio.3002653. eCollection 2024 Sep.

Functional network modules overlap and are linked to interindividual connectome differences during human brain development

Affiliations

Functional network modules overlap and are linked to interindividual connectome differences during human brain development

Tianyuan Lei et al. PLoS Biol. .

Abstract

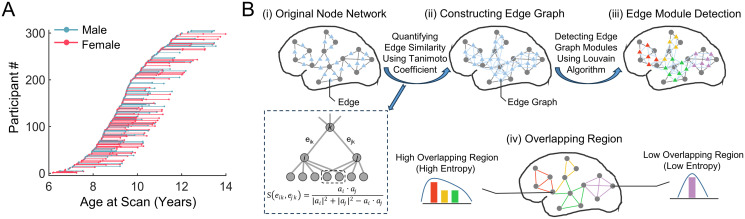
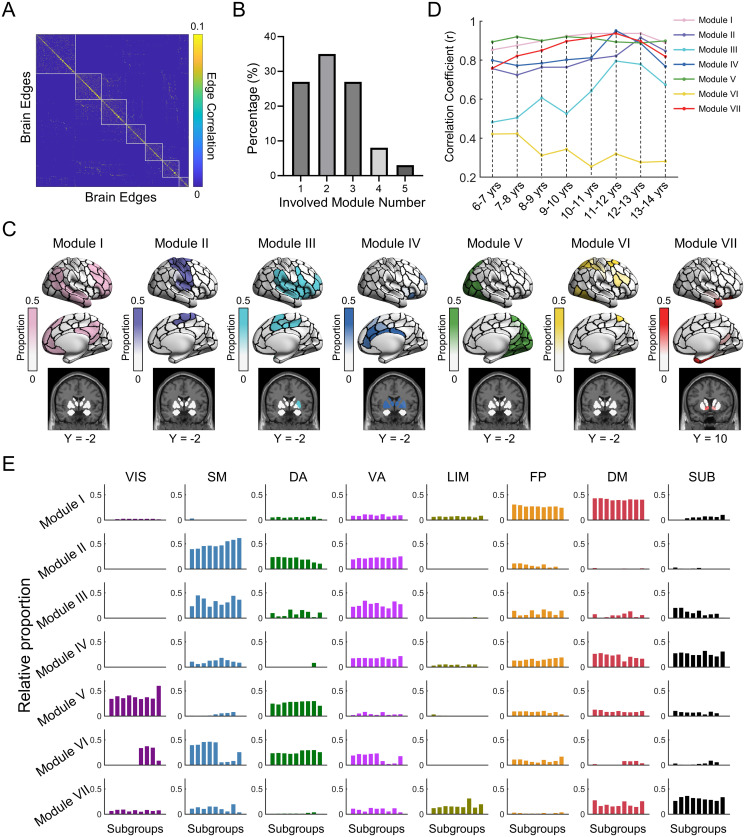
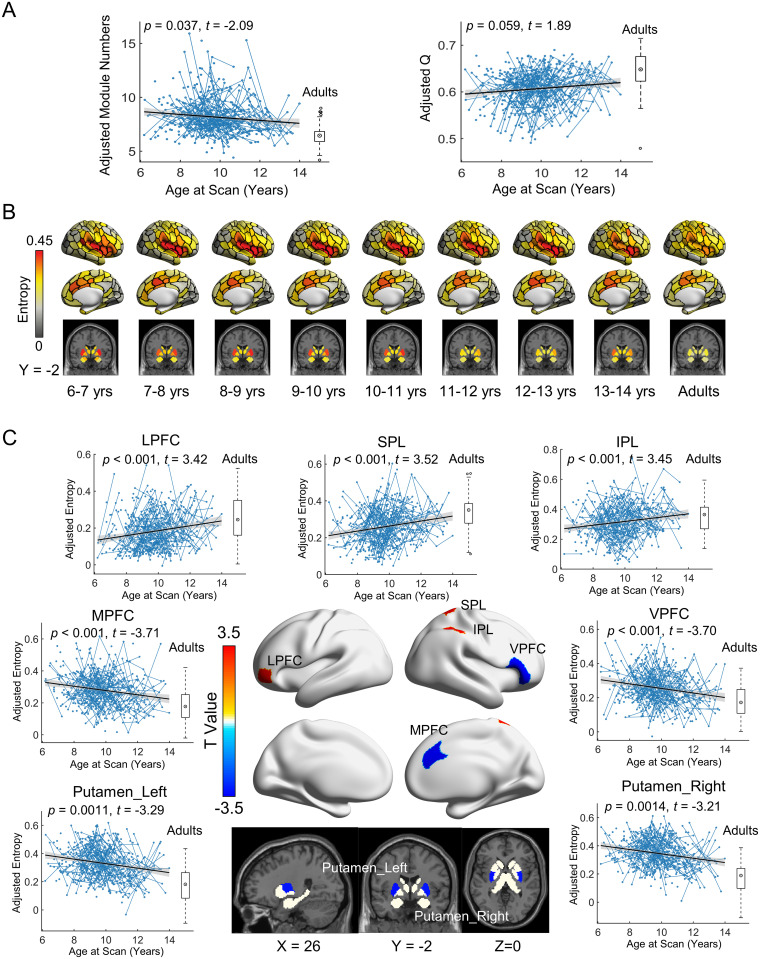
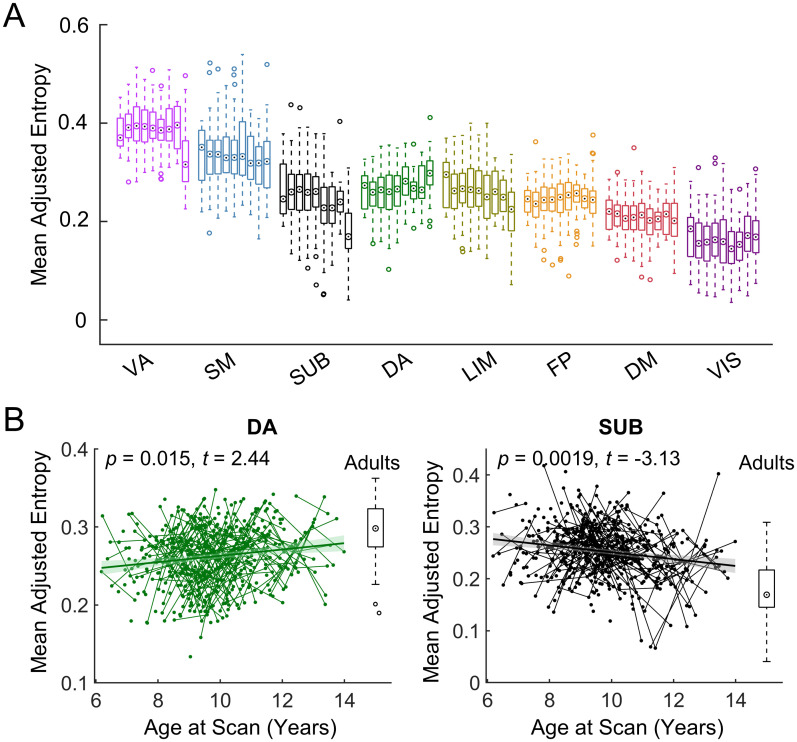
The modular structure of functional connectomes in the human brain undergoes substantial reorganization during development. However, previous studies have implicitly assumed that each region participates in one single module, ignoring the potential spatial overlap between modules. How the overlapping functional modules develop and whether this development is related to gray and white matter features remain unknown. Using longitudinal multimodal structural, functional, and diffusion MRI data from 305 children (aged 6 to 14 years), we investigated the maturation of overlapping modules of functional networks and further revealed their structural associations. An edge-centric network model was used to identify the overlapping modules, and the nodal overlap in module affiliations was quantified using the entropy measure. We showed a regionally heterogeneous spatial topography of the overlapping extent of brain nodes in module affiliations in children, with higher entropy (i.e., more module involvement) in the ventral attention, somatomotor, and subcortical regions and lower entropy (i.e., less module involvement) in the visual and default-mode regions. The overlapping modules developed in a linear, spatially dissociable manner, with decreased entropy (i.e., decreased module involvement) in the dorsomedial prefrontal cortex, ventral prefrontal cortex, and putamen and increased entropy (i.e., increased module involvement) in the parietal lobules and lateral prefrontal cortex. The overlapping modular patterns captured individual brain maturity as characterized by chronological age and were predicted by integrating gray matter morphology and white matter microstructural properties. Our findings highlight the maturation of overlapping functional modules and their structural substrates, thereby advancing our understanding of the principles of connectome development.


Conflict of interest statement

The authors have declared that no competing interests exist.

Figures

Fig 1
Fig 1. Data information and schematic diagram of the overlapping modular architecture based on the edge-centric module detection.
(A) Age distribution of longitudinal rsfMRI scans of children. (B) (i) Traditional brain functional connectivity network. In this network, each node denotes a brain region of interest, and each link denotes the interregional functional connectivity. (ii) Edge graph corresponding to a given functional network. In this graph, each node denotes an edge in the functional network, and each link is defined as the similarity between edges in the connectivity profiles using Tanimoto coefficient [30,46]. For 2 given edges eik and ejk that share a common node k, the interedge similarity was estimated as the similarity of connectivity profiles between node i and node j, wherein ai represents the modified connectivity profile of node i, aiaj represents the dot product of 2 vectors ai and aj, and |ai|2 denotes the sum of the squared weights of all connections of node i. (iii) Edge-centric module detection. Each edge is assigned to a specific module based on the Louvain algorithm [47]. (iv) Definition of regional module overlap. Each nodal region was assigned to one or more modules due to the diverse module affiliations of its edges. A measure of entropy was employed to quantify the extent of module overlap of each brain node by measuring the distribution of the module affiliations of its edges [34]. rsfMRI, resting-state fMRI.
Fig 2
Fig 2. Overlapping modular architecture of group-level brain functional networks in the adult cohort and the child subgroups.
(A) Modular organization in the weighted edge graph in adults. The edges were sorted according to their module affiliations. Each element denotes the interedge similarity in their connectivity profiles. (B) Distribution of the involved module number across brain nodes. Notably, 27% of the nodes belonged to one module, and 73% of the nodes belonged to 2 or more modules. (C) Topographic distributions of 7 functional modules. For each module, nodal values represent the proportion of edges assigned to that module. (D) Spatial similarity of functional module maps between the child subgroups and the adult group. Each line represents the age-dependent similarity for a particular module. (E) System-dependent spatial distributions of functional modules. For each functional module of each subgroup, we calculated the percentage of nodes distributed in eight systems, including 7 functional systems [48] and the subcortical area [49]. Given a prior system, the bar chart shows the percentage of nodes located in this system for 8 child subgroups with a one-year interval (i.e., 6–7 yrs, 7–8 yrs, 8–9 yrs, 9–10 yrs, 10–11yrs, 11–12 yrs, 12–13 yrs, and 13–14 yrs) and the adult cohort. In (C) and (D), cortical data were mapped on the brain surface using BrainNet Viewer software [52]. The data underlying this figure can be found at https://osf.io/qfcyu/. VIS, visual; SM, somatomotor; DA, dorsal attention; VA, ventral attention; LIM, limbic; FP, frontoparietal; DM, default-mode; SUB, subcortical; yrs, years.
Fig 3
Fig 3. Longitudinal development of overlapping functional modules at the global and nodal levels.
(A) Left: Age effect on the number of modules. Right: Age effect on modularity in the edge graph. (B) Spatial patterns of functional module overlap (i.e., nodal entropy) across the brain for each child subgroup and for the adult group. (C) Spatial distribution of regions showing significant developmental changes in nodal entropy. Age effects are displayed in terms of t values (FDR-corrected p < 0.05, corresponding to uncorrected p < 0.0014). In (A) and (C), the boxplot represents the distribution of the adult group for reference. The blue lines connecting scattered points represent longitudinal scans of the same child. The adjusted value denotes the measure of interest corrected for sex, head motion, and random age effects. The data underlying this figure can be found at https://osf.io/qfcyu/. yrs, years; LPFC, lateral prefrontal cortex; SPL, superior parietal lobule; IPL, inferior parietal lobule; MPFC, medial prefrontal cortex; VPFC, ventral prefrontal cortex.
Fig 4
Fig 4. Longitudinal development of the overlapping functional modules at the system level.
(A) Distribution of nodal entropy within each functional system for each child subgroup and for the adult group. Given a prior system, the bar chart shows the distribution of the average entropy of this system across individuals for 8 child subgroups with a one-year interval (i.e., 6–7 yrs, 7–8 yrs, 8–9 yrs, 9–10 yrs, 10–11yrs, 11–12 yrs, 12–13 yrs, and 13–14 yrs) and the adult cohort. Here, the circle with a dot denotes the median, and the box denotes the interquartile range. (B) Two functional systems showing significant developmental changes in functional module overlap (i.e., nodal entropy). The boxplot represents the distribution of the adult group for reference. Short lines connecting scattered points represent longitudinal scans of the same child. The adjusted value denotes the measure of interest corrected for sex, head motion, and random age effects. The data underlying this figure can be found at https://osf.io/qfcyu/. VIS, visual; SM, somatomotor; DA, dorsal attention; VA, ventral attention; LIM, limbic; FP, frontoparietal; DM, default-mode; SUB, subcortical; yrs, year.
Fig 5
Fig 5. Cognitive function decoding of brain regions.
Nodal regions were sorted in descending order according to developmental changes in the functional module overlap. The results were obtained based on the information in the NeuroSynth meta-analytic database [55]. The significance level of the spatial similarity was assessed using permutation tests (n = 10,000) that corrected for spatial autocorrelation [56]. The data underlying this figure can be found at https://osf.io/qfcyu/. *, pperm < 0.05; **, pperm < 0.01; ***, pperm < 0.001.
Fig 6
Fig 6. Age prediction based on spatial patterns of nodal overlap.
(A) Schematic representation of the SVR prediction model based on 10-fold cross-validation. (B) Frequency polygon for age prediction accuracy using the 10-fold SVR model for 1,000 times of randomly selected samples (blue histogram). For each time of random sampling, rsfMRI scans were randomly selected from 305 independent subjects. The gray frequency polygon in the inset displays the null distribution of prediction accuracy based on the permutation tests (n = 10,000) by randomly sampling the scans and shuffling the original ages across the scans. The red line in the blue histogram indicates the significant level (p < 0.05) derived from the null distribution. (C) Spatial distributions of the nodal contribution in the prediction model. Left: Contribution weight at the regional level. Right: Contribution weight at the system level. The nodal contribution weights were obtained by averaging the contribution weights across 1,000 times of randomly selected samples. Positive and negative weights were separately averaged within each system. (D) Left: Spatial pattern of age effect of on nodal overlap in terms of t values. Right: Nodal contribution weight shows a significant positive correlation with the development of nodal overlap based on Pearson’s correlation analysis. The significance level of the similarity was assessed using the permutation tests (n = 10,000) to correct for spatial autocorrelation [56]. The data underlying this figure can be found at https://osf.io/qfcyu/. Pos, positive; Neg, negative; VIS, visual; SM, somatomotor; DA, dorsal attention; VA, ventral attention; LIM, limbic; FP, frontoparietal; DM, default-mode; SUB, subcortical; SVR, support vector regression.
Fig 7
Fig 7. Prediction of individual spatial patterns of nodal module overlap from structural brain features in children.
(A) Frequency polygon for prediction accuracy of all rsfMRI scans. The inset in the upper left corner denotes the null distribution of the prediction accuracy based on permutation tests. To assess the statistical significance of the prediction accuracy, we generated a null distribution of accuracy using permutation tests by shuffling the original entropy values across nodes for each scan 100 times, thus leading to 44,600 (446 scans × 100 times) permutation instances in total. The red line denotes the 95% significance level in the null distribution. (B) Prediction contribution of different structural features in the prediction model of all rsfMRI scans. This histogram displays the mean contribution across subjects for different anatomical features, with each bar representing the mean accompanied by its standard deviation. (C) Accuracy of nodal entropy prediction for a representative child’s scan. (D) Spatial distributions of anatomical features for a representative child’s scan. In (C) and (D), the representative scan was selected as the scan that showed the highest prediction accuracy for the individual map of nodal module overlap (i.e., nodal entropy). The data underlying this figure can be found at https://osf.io/qfcyu/. CT, cortical thickness; SA, surface area; FI, folding index; FA, fractional anisotropy; CC, cortical curvature; CV, cortical volume.

Similar articles

Cited by

References

    1. Paus T. Mapping brain maturation and cognitive development during adolescence. Trends Cogn Sci. 2005;9(2):60–8. doi: 10.1016/j.tics.2004.12.008 . - DOI - PubMed
    1. Berk LE. Development through the lifespan (7th). London: Pearson; 2017.
    1. Miller DJ, Duka T, Stimpson CD, Schapiro SJ, Baze WB, McArthur MJ, et al.. Prolonged myelination in human neocortical evolution. Proc Natl Acad Sci U S A. 2012;109(41):16480–5. doi: 10.1073/pnas.1117943109 . - DOI - PMC - PubMed
    1. Norbom LB, Ferschmann L, Parker N, Agartz I, Andreassen OA, Paus T, et al.. New insights into the dynamic development of the cerebral cortex in childhood and adolescence: Integrating macro-and microstructural MRI findings. Prog Neurobiol. 2021;204:102109. doi: 10.1016/j.pneurobio.2021.102109 . - DOI - PubMed
    1. Stephan AH, Barres BA, Stevens B. The complement system: an unexpected role in synaptic pruning during development and disease. Annu Rev Neurosci. 2012;35:369–89. doi: 10.1146/annurev-neuro-061010-113810 . - DOI - PubMed

MeSH terms

LinkOut - more resources