. 2024 Sep 24;121(39):e2404395121.
doi: 10.1073/pnas.2404395121. Epub 2024 Sep 18.

Lipin1 depletion coordinates neuronal signaling pathways to promote motor and sensory axon regeneration after spinal cord injury

Affiliations

Lipin1 depletion coordinates neuronal signaling pathways to promote motor and sensory axon regeneration after spinal cord injury

Weitao Chen et al. Proc Natl Acad Sci U S A. .

Abstract

Adult central nervous system (CNS) neurons down-regulate growth programs after injury, leading to persistent regeneration failure. Coordinated lipids metabolism is required to synthesize membrane components during axon regeneration. However, lipids also function as cell signaling molecules. Whether lipid signaling contributes to axon regeneration remains unclear. In this study, we showed that lipin1 orchestrates mechanistic target of rapamycin (mTOR) and STAT3 signaling pathways to determine axon regeneration. We established an mTOR-lipin1-phosphatidic acid/lysophosphatidic acid-mTOR loop that acts as a positive feedback inhibitory signaling, contributing to the persistent suppression of CNS axon regeneration following injury. In addition, lipin1 knockdown (KD) enhances corticospinal tract (CST) sprouting after unilateral pyramidotomy and promotes CST regeneration following complete spinal cord injury (SCI). Furthermore, lipin1 KD enhances sensory axon regeneration after SCI. Overall, our research reveals that lipin1 functions as a central regulator to coordinate mTOR and STAT3 signaling pathways in the CNS neurons and highlights the potential of lipin1 as a promising therapeutic target for promoting the regeneration of motor and sensory axons after SCI.

Keywords: axon regeneration; lipid metabolism; lipid signaling; lipin1; spinal cord injury.


Conflict of interest statement

Competing interests statement:The authors declare no competing interest.

Figures

Fig. 1.
Fig. 1.
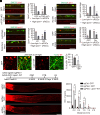
Lipin1 KD up-regulates mTORC1 and STAT3 signaling to boost axon regeneration. (AD) Phospho-S6 (A and B) and p-STAT3 (C and D) activation in Ctrl and Lipin1 KD RGCs. (Scale bar: 50 μm.) **P ≤ 0.01, Student’s t test. n = 7 mice. (E) Experiment schematic. (F and G) Axon regeneration with indicated treatments (F) and quantification (G). (Scale bar: 200 μm.) **P ≤ 0.01, ANOVA followed by Šídák’s test, n = 5 mice. (H and I) Axon regeneration with indicated treatments (H) and quantification (I). (Scale bar: 200 μm.) **P ≤ 0.01, ns, not significant, ANOVA followed by Šídák’s test, n = 4 mice. (J and K) Axon regeneration with indicated treatments (J) and quantification (K). (Scale bar: 200 μm.) **P ≤ 0.01, ns, not significant, ANOVA followed by Šídák’s test, n = 4 mice. See also SI Appendix, Fig. S1.
Fig. 2.
Fig. 2.
The PA and LPA activate cell signaling pathways after lipin1 KD. (A) Total PA level in the cortical neurons infected with AAV9-GFP or AAV9-shLipin1. **P ≤ 0.01, Student’s t test. n = 3. (B) The abundance of individual PA species in the cortical neurons infected with AAV9-GFP or AAV9-shLipin1. *P ≤ 0.05, t test, n = 3. (CE) WB analysis of p-S6 and p-mTOR in the cultured DRG neurons with the vehicle, DP-PA, or PO-PA treatment. *P ≤ 0.05, **P ≤ 0.01, ***P ≤ 0.001, ANOVA followed by Dunnett’s test. n = 4. (F and G) Neurites regrowth of DRG neurons with the vehicle, DP-PA, or PO-PA treatment (F) and quantification of longest neurite length (G). (Scale bar: 200 μm.) *P ≤ 0.05, **P ≤ 0.01, ANOVA followed by Dunnett’s test, n = 3. (H and I) Neurites regrowth of DRG neurons with the vehicle, P-LPA, or O-LPA treatment (H) and quantification of longest neurite length (I). (Scale bar: 200 μm.) *P ≤ 0.05, **P ≤ 0.01, ANOVA followed by Dunnett’s test, n = 3. See also SI Appendix, Fig. S2.
Fig. 3.
Fig. 3.
Reciprocal control of lipin1 and mTOR signaling regulates axon regeneration after optic nerve injury. (A and B) Lipin1 expression in the retinal sections from mTORf/f mice with AAV2-Cre or AAV2-GFP injection (A) and quantification (B). (Scale bar: 50 μm.) **P ≤ 0.01, ANOVA followed by Šídák’s test, n = 4 to 5 mice. (C and D) Lipin1 expression in the retinal sections from Tscf/f mice with AAV2-Cre or AAV2-GFP injection (C) and quantification (D). (Scale bar: 50 μm.) **P ≤ 0.01, ANOVA followed by Šídák’s test, n = 4 to 5 mice. (E and F) Lipin1 expression in the retinal sections from WT mice under normal light:dark circadian or with 1 d dark:dark adaption (E) and quantification (F). (Scale bar: 50 μm.) **P ≤ 0.01, ANOVA followed by Šídák’s test, n = 4 mice. (G and H) Lipin1 expression in the retinal sections from WT mice with indicated treatments (G) and quantification (H). (Scale bar: 50 μm.) **P ≤ 0.01, ANOVA followed by Šídák’s test, n = 4 mice. (I and J) Phospho-S6 levels in the retinas from WT mice with AAV2-GFP or AAV2-Lipin1-WT injection (I) and quantification (J). (Scale bar: 50 μm.) **P ≤ 0.01, Student’s t test, n = 4 mice. (K) Experiment schematic. (L and M) Sections of optic nerves with indicated treatments (L) and quantification (M). (Scale bar: 200 μm.) **P ≤ 0.01, *P ≤ 0.05, ANOVA followed by Tukey’s test, n = 6 mice. See also SI Appendix, Fig. S3.
Fig. 4.
Fig. 4.
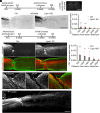
Lipin1 KD promotes CST sprouting after unilateral pyramidotomy. (A) Experiment schematic. PY, pyramidotomy. (B) Representative coronal sections of C7 spinal cord from intact ctrl and lipin1 KD mice. mScarlet indicates the CST axons. (Scale bar: 500 μm.) (C) Quantification paradigm. The cervical spinal cord was divided into different zones. Axons crossing the midline (M), Z1, and Z2 were quantified. (D) Quantification. Two-way ANOVA followed by Sidak’s multiple comparison test. n = 4 mice. (E and F) Representative coronal sections of C7 spinal cord from ctrl and lipin1 KD mice with PY (E) and quantification (F). (Scale bar: 500 μm.) Two-way ANOVA followed by Sidak’s multiple comparison test. **P ≤ 0.01, ***P ≤ 0.001. n = 6 mice. (G) Experiment schematic. (H and I) Coronal sections of the C7 spinal cord with indicated treatments (H) and quantification (I). (Scale bar: 500 μm.) Two-way ANOVA followed by Sidak’s multiple comparison test. ***P ≤ 0.001. n = 8 mice. See also SI Appendix, Fig. S4.
Fig. 5.
Fig. 5.
Lipin1 KD enhances CST regeneration after T8 spinal cord crush. (A) Experiment schematic. (B) mScarlet signal at the lumbar spinal cord caudal to the lesion site. (Scale bar: 500 μm.) (C and D) Sagittal spinal cord sections from ctrl and lipin1 KD animals (C) and quantification (D). mScarlet indicated the regenerating CST axons. (Scale bar: 500 μm.) Two-way ANOVA followed by Sidak’s multiple comparison test. **P ≤ 0.01, ***P ≤ 0.001. n = 7 mice. (E) Experiment schematic. (F and G) CST axons regeneration of Ctrl and lipin1 KD mice (F) and quantification (G). Immunostaining of mScarlet and GFAP was performed to visualize CST axons and astrocytic scar. (Scale bar: 500 μm.) Two-way ANOVA followed by Sidak’s multiple comparison test. *P ≤ 0.05, ***P ≤ 0.001. n = 8 mice. (H) Zoom in images of the boxed area in (F). (I) Orthogonal projection image of the spinal cord with tissue clearing and 3D imaging. (Scale bar: 500 μm.) See also SI Appendix, Figs. S5–S9 and Movies S1–S6.
Fig. 6.
Fig. 6.
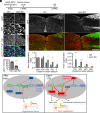
Lipin1 KD facilitates ascending sensory axon regeneration. (A) Experiment schematic. (B and C) DRG sections from WT mice with AAV9-GFP or AAV9-shLipin1 infection (B) and quantification of lipin1 expression (C). Immunostaining of lipin1 (red) and Tuj1 (blue) was performed. (Scale bar: 100 μm.) Students t test. ***P ≤ 0.001. n = 7. (D and E) Regeneration of ascending sensory axons with indicated treatment (D) and quantification (E). GFP expression driven by the AAVs was used to indicate regenerating axons. Immunostaining GFP (green) and GFAP (red) was performed to visualize the sensory axons and astrocytic scar. (Scale bar: 200 μm.) Two-way ANOVA followed by Sidak’s multiple comparison test. *P ≤ 0.05, **P ≤ 0.01, ***P ≤ 0.001. n = 7 mice. (F) Proposed mechanism for axon regeneration after lipin1 KD. See also SI Appendix, Fig. S10.

References

    1. Bradke F., Fawcett J. W., Spira M. E., Assembly of a new growth cone after axotomy: The precursor to axon regeneration. Nat. Rev. Neurosci. 13, 183–193 (2012). - PubMed
    1. Pfenninger K. H., Plasma membrane expansion: A neuron’s Herculean task. Nat. Rev. Neurosci. 10, 251–261 (2009). - PubMed
    1. Vance J. E., Campenot R. B., Vance D. E., The synthesis and transport of lipids for axonal growth and nerve regeneration. Biochim. Biophys. Acta 1486, 84–96 (2000). - PubMed
    1. Yang C., et al. , Rewiring neuronal glycerolipid metabolism determines the extent of axon regeneration. Neuron 105, 276–292.e5 (2020). - PMC - PubMed
    1. Santos A. L., Preta G., Lipids in the cell: Organisation regulates function. Cell. Mol. Life Sci. 75, 1909–1927 (2018). - PMC - PubMed

MeSH terms

LinkOut - more resources