. 2024 Sep 20;10(38):eadq5226.
doi: 10.1126/sciadv.adq5226. Epub 2024 Sep 18.

NF-κB and TET2 promote macrophage reprogramming in hypoxia that overrides the immunosuppressive effects of the tumor microenvironment

Affiliations

NF-κB and TET2 promote macrophage reprogramming in hypoxia that overrides the immunosuppressive effects of the tumor microenvironment

Carlos de la Calle-Fabregat et al. Sci Adv. .

Abstract

Macrophages orchestrate tissue homeostasis and immunity. In the tumor microenvironment (TME), macrophage presence is largely associated with poor prognosis because of their reprogramming into immunosuppressive cells. We investigated the effects of hypoxia, a TME-associated feature, on the functional, epigenetic, and transcriptional reprogramming of macrophages and found that hypoxia boosts their immunogenicity. Hypoxic inflammatory macrophages are characterized by a cluster of proinflammatory genes undergoing ten-eleven translocation-mediated DNA demethylation and overexpression. These genes are regulated by NF-κB, while HIF1α dominates the transcriptional reprogramming, demonstrated through ChIP-seq and pharmacological inhibition. In bladder and ovarian carcinomas, hypoxic inflammatory macrophages are enriched in immune-infiltrated tumors, correlating with better patient prognoses. Coculture assays and cell-cell communication analyses support that hypoxic-activated macrophages enhance T cell-mediated responses. The NF-κB-associated hypomethylation signature is displayed by a subset of hypoxic inflammatory macrophages, isolated from ovarian tumors. Our results challenge paradigms regarding the effects of hypoxia on macrophages and highlight actionable target cells to modulate anticancer immune responses.


Figures
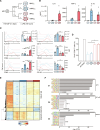
Fig. 1.
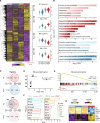
Fig. 1.. Phenotypic, functional, and DNA methylation characterization of MAC differentiation and activation in normoxia and hypoxia.
(A) Scheme depicting the in vitro differentiation system. (B) Cytokine (IL-6, TNF-α, and IL-10) concentrations in cell culture supernatants, quantified by enzyme-linked immunosorbent assay (n = 4). (C) Analysis of cell surface protein expression, quantified in MACs by flow cytometry. Left: Fluorescence histograms of concatenated replicates (n = 4). Right: Histograms showing mean fluorescence intensities (MFIs) of the same replicates. (D) CD8+ T cell proliferation [i.e., percent of cells with decreased carboxyfluorescein succinimidyl ester (CFSE) staining] in the presence or absence of allogeneic MACs (n = 4). First bar: Negative control [no MACs and no T cell receptor (TCR) stimulation]; second bar: positive control (no MACs and TCR stimulation); bars three to six: coculture with MACs and TCR stimulation. (E) Heatmap depicting differential DNA methylation analysis results, aggregated in three different clusters (C1 to C3). Blue and red indicate lower and higher methylation, respectively. (F) Top 10 most significantly enriched TF motifs in the three different cluster regions, identified by HOMER. DNAm, DNA methylation. *P < 0.05, **P < 0.01, ***P < 0.001.
Fig. 2.
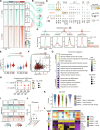
Fig. 2.. Analysis of the transcriptional response to inflammatory activation of MACs in hypoxia.
(A) Heatmap depicting differential mRNA expression results aggregated in four different clusters (E1 to E4). Genes associated to hypoxic-related demethylation (cluster C2) are highlighted with red dashes at the right. Violin plots summarize the distribution of normalized gene expression in every cluster. (B) Top significant GO categories for every cluster. (C) Overlap between DEGs rendered by comparing different experimental conditions, summarized by Venn diagrams. Comparisons are distributed along the hypoxia axis (considering “up” DEGs as up-regulated in hypoxia) or the LPS axis (considering “up” DEGs as up-regulated in LPS). (D) Enrichment of genes in E1 to E4 coinciding with genes associated to cluster C2 calculated by a Fisher’s exact test. (E) Gene set enrichment analysis (GSEA) of C2-associated genes on mMAC1 (red) versus mMAC21 (blue) comparison. (F) TF activity inferred by discriminant regulon expression analysis (DoRothEA). Top eight positive (i.e., higher activity in hypoxia) regulons (ordered by NES/FDR) are depicted and colored by TF family in every comparison. (G) Selected examples of CpGs in C2 associated to genes up-regulated in mMAC1 versus mMAC21. GEx, RNA expression; DNAm, DNA methylation. n.s., not significant.
Fig. 3.
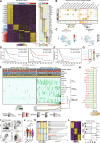
Fig. 3.. Mechanistic interplay between HIF1α and p65 under hypoxia and activation.
(A) Representative Western blot image of HIF1α and p65 in a time course after LPS stimulation in whole cell lysates. α-Tubulin was used as a loading control. (B) Immunofluorescence of HIF1α and p65 in MACs at 2 hours after LPS stimulation. Representative images of MAC cultures with fluorescent staining for cytoplasm (phalloidin Alexa Fluor 568, red), nucleus [4′,6-diamidino-2-phenylindole (DAPI), blue], and HIF1α or p65 (Alexa Fluor 488; green; n = 2). (C) Quantification of immunofluorescence staining signal in the cytoplasm and nucleus of HIF1α and p65 2 hours after LPS stimulation or vehicle. (D) Overlap between hypoxia–up-regulated and LPS–up-regulated DEGs. (E) Scaled mRNA expression of genes contained in the HIF1A and RELA regulons (DoRothEA regulons, only positive targets). A.U., arbitrary units; GEx, RNA expression. *P < 0.05, **P < 0.01, ***P < 0.001, and ****P < 0.0001. n.s., not significant.
Fig. 4.
Fig. 4.. Binding profiles of HIF1α and p65 on MACs under different conditions.
(A) Profile plots depicting binding of HIF1α (green, top) or p65 (orange, bottom) binding surrounding each ChIP-seq peak summit. Peaks are clustered in different sets (H1 to H3 for HIF1α and P1 for p65), and the binding signal average of every condition is summarized in respective enrichment plots, on the right. (B) Venn diagrams showing overlaps between HIF1α and p65 significant peaks in mMAC1, by cluster. (C) Motif enrichment across ChIP-seq peak sets. HIF1α and p65 peaks are shown, along with commonly bound peaks by both TFs in mMAC1. Commonly bound peak enrichment is calculated in a HIF1α- or p65-centered manner. (D) Enrichment of HIF1α and p65 motifs around specific and commonly bound peaks in a window of 1 kb flanking the peak summit. (E) Normalized HIF1α and p65 ChIP-seq binding signal on commonly bound peaks. (F) Correlation between HIF1α and p65 binding signal on commonly bound peaks. (G) Top five GO categories enriched in genes with HIF1α peaks only, p65 peaks only, or commonly bound peaks in mMAC1. (H) GSEA of genes only bound by HIF1α or p65 or genes with commonly bound peaks on mMAC1 on different comparisons distributed along the hypoxia axis or the LPS axis. (I) HIF1α and p65 ChIP-seq signal in windows flanking CpG coordinates from cluster C2. (J) Enrichment of peak sets overlapping with CpGs in C2 calculated by a Fisher’s exact test. (K) Violin plots depicting unscaled B values of C2 cluster in mMAC21 and mMAC1 untreated or pretreated with p65 inhibitor (BAY11-7082), HIF inhibitor (PX-478), or TET inhibitor (4-octyl itaconate; n = 3). (L) Scaled DNA methylation and mRNA expression of selected genes from Fig. 2G upon treatment with inhibitors or vehicle. DNAm, DNA methylation; GEx, RNA expression. n.s., not significant.
Fig. 5.
Fig. 5.. Identification of MAC signatures on in vivo contexts.
(A) Heatmap showing mRNA expression of signature DEGs specific to every experimental condition (MO, iMAC21, mMAC21, iMAC1, and mMAC1). (B) Dot plot showing the level of expression of the in vitro MAC-derived mRNA signatures along the C2-associated genes on the MoMac-VERSE. (C) UMAP with overlaid expression of mMAC1 signature genes and C2-associated genes in the MoMac-VERSE. (D) Kaplan-Meier curves showing the association of MAC signatures with overall survival (OS) in bladder cancer [bladder urothelial carcinoma (BLCA)] patient samples (public data). (E) Kaplan-Meier curves showing association with C2 methylation profiles with OS in BLCA patient samples (public data). (F) Scaled cell type percentages in BLCA data. Heatmaps are separated by immune cold and hot tumors, characterized by low or high infiltration of immune cells, respectively. The clinical data associated with each patient are highlighted at the top. The LOESS curves show the distribution of MAC and T cell percentages at the bottom. (G) Correlation between MAC and T cell estimated percentages. (H) Significant interacting ligand-receptor pairs (red:green) between mMAC1 and T cell, respectively, and the associated probability of interaction. (I) Representative flow cytometry plot of immune cells (CD45+) in ovarian cancer, depicting the used sorting strategy for TREM2 (red), FOLR2 (orange), and IL4I1 (fuchsia) MAC populations. (J) Violin plots depicting unscaled B values of C2 cluster in TREM2, FOLR2, and IL4I1 (n = 5). (K) Heatmap of the demethylated regions specific to every sorted population (top 250 by FDR) and their associated TF motif enrichments (top 5), on the right. (L) Heatmap of the mRNA expression of signature DEGs specific to every population. The activity of the RELA and HIF1A regulons is shown on the right for every specific DEG set (n = 3). GEx, RNA expression; DNAm, DNA methylation. ****P < 0.0001.

References

    1. Blériot C., Chakarov S., Ginhoux F., Determinants of resident tissue macrophage identity and function. Immunity 52, 957–970 (2020). - PubMed
    1. Park M. D., Silvin A., Ginhoux F., Merad M., Macrophages in health and disease. Cell 185, 4259–4279 (2022). - PMC - PubMed
    1. Mass E., Nimmerjahn F., Kierdorf K., Schlitzer A., Tissue-specific macrophages: How they develop and choreograph tissue biology. Nat. Rev. Immunol. 23, 563–579 (2023). - PMC - PubMed
    1. Guilliams M., Thierry G. R., Bonnardel J., Bajenoff M., Establishment and maintenance of the macrophage niche. Immunity 52, 434–451 (2020). - PubMed
    1. Lavin Y., Mortha A., Rahman A., Merad M., Regulation of macrophage development and function in peripheral tissues. Nat. Rev. Immunol. 15, 731–744 (2015). - PMC - PubMed

MeSH terms