. 2024 Sep 20;10(38):eado0277.
doi: 10.1126/sciadv.ado0277. Epub 2024 Sep 18.

A brain microbiome in salmonids at homeostasis

Affiliations

A brain microbiome in salmonids at homeostasis

Amir Mani et al. Sci Adv. .

Abstract

Ectotherms have peculiar relationships with microorganisms. For instance, bacteria are recovered from the blood and internal organs of healthy teleosts. However, the presence of microbial communities in the healthy teleost brain has not been proposed. Here, we report a living bacterial community in the brain of healthy salmonids with bacterial loads comparable to those of the spleen and 1000-fold lower than in the gut. Brain bacterial communities share >50% of their diversity with gut and blood bacterial communities. Using culturomics, we obtained 54 bacterial isolates from the brains of healthy trout. Comparative genomics suggests that brain bacteria may have adaptations for niche colonization and polyamine biosynthesis. In a natural system, Chinook salmon brain microbiomes shift from juveniles to reproductively mature adults. Our study redefines the physiological relationships between the brain and bacteria in teleosts. This symbiosis may endow salmonids with a direct mechanism to sense and respond to environmental microbes.


Figures
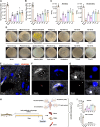
Fig. 1.
Fig. 1.. The healthy rainbow trout brain has living bacteria at homeostasis.
(A and B) Quantification of 16S rDNA copies in gut, blood, spleen, and four brain regions (OB, Tel, OT, and Cer) of laboratory rainbow trout using DNA (A) or RNA (B) as a template (n = 7). (C) Colony-forming units (CFUs) per gram of tissue obtained using the NP-40 lysis method under aerobic and anaerobic conditions at room temperature in tryptic soy agar (TSA) (n = 4). Different letters denote statistically significant differences (P < 0.05) by Welch’s ANOVA test. (D) Representative examples of different bacterial isolates from control rainbow trout generated via culturomics efforts. Note that plates seeded with cerebrospinal fluid (CSF) and plates used as technical controls (T-Ctrl1–3) showed no CFUs. (E to G) Fluorescence in situ hybridization of control trout Tel cryosections using a universal EUB338 oligoprobe (red). In (E), bacteria appear to be located in the brain parenchyma; in (F), bacteria appear to be crossing the blood-brain barrier; and in (G), bacteria appear in close association with cell nuclei, suggesting an intracellular localization. Nuclei were stained with 4′,6-diamidino-2-phenylindole (DAPI; blue) and F-actin was stained with phalloidin (white). Arrowheads indicate bacterial cells. BV, blood vessel. (H) Experimental design overview for the antibiotic cocktail oral gavage experiment. (I) Number of CFUs recovered from different tissues 1 day after the end of the antibiotic gavage (ABx) trial (n = 4). Tissue samples were subjected to NP-40 lysis and CFUs per gram of tissue were counted under aerobic and anaerobic conditions at room temperature for both the vehicle group (top) and the ABx group (bottom). No CFUs were recovered under anaerobic conditions in the antibiotic-gavaged animals. CFU counts correspond to growth on TSA media at room temperature.
Fig. 2.
Fig. 2.. Diversity, composition, and sources of the brain bacterial community in rainbow trout.
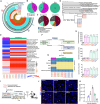
(A and B) Relative abundance of bacterial phyla (A) and families (B) across the gut, blood, spleen, and four brain regions: OB, Tel, OT, and Cer sampled in this study (n = 7). (C) Principal coordinates analysis (PCoA) of the rainbow trout gut, blood, spleen, and brain microbial communities as well as the water microbial community. Ellipses represent a 95% confidence interval. (D) Mean Shannon diversity index of rainbow trout gut, blood, spleen, and brain microbial communities. Different letters indicate statistically significant differences (P < 0.05) by the Kruskal-Wallis test. (E) Weighted UniFrac distance for rainbow trout gut, blood, and spleen and the four different brain regions sampled (n = 7). Different letters indicate statistically significant differences (P < 0.05) by Tukey’s post hoc test. (F) Predicted relative percentage of bacterial reads in the spleen, OB, Tel, OT, and Cer (sinks) originating from the blood, gut, water, or unknown sources using SourceTracker2 analysis. (G) Predicted proportion of the overall spleen and brain (OB, TL, OT, and Cer) (sinks) microbial diversity that originates from the blood, gut, water, or unknown sources.
Fig. 3.
Fig. 3.. Whole-genome sequencing (WGS) of brain-resident bacterial isolates suggests potential signatures of brain colonization and niche adaptation.
(A) Pan-genome analysis of Plesiomonas sp. isolates from trout gut, blood, and brain. (B) Relative percentage of isolates with short and long genomes from each source (gut, blood, and brain). (C) Functional classes of annotated genes in short-genome and long-genome Plesiomonas sp. isolates. (D) Phylogenetic tree of Plesiomonas sp. isolates based on whole-genome data compared to publicly available strains. (E) Heatmap of module completeness for Kyoto Encyclopedia of Genes and Genomes pathways from Plesiomonas sp. genomes sequences in this study. (F) Bacterial polyamines synthesis pathway diagram. Asterisks in light purple boxes: genes missing in short-genome isolates; green boxes: genes encoding for enzymes found in all genomes; light orange box: genes encoding for enzymes not found in any of the genomes. ICMF, isobutyryl-CoA mutase fused. (G) Heatmap showing the presence or absence of genes that encode for the main enzymes involved in the polyamine synthesis pathway in each of the Plesiomonas genomes sequenced. (H) Polyamine levels in bacterial growth media, short-genome, and long-genome Plesiomonas isolates. ND, not detectable. Different letters indicate statistically significant differences (P < 0.05) by Tukey’s post hoc test. (I) Experimental design for bath exposure of juvenile rainbow trout to tdTomato-labeled Plesiomonas sp. (J) Confocal microscopy images of rainbow trout brain cryosections from 3 hours to 14 days after bath exposure showing the presence of tdTomato-Plesiomonas (red, white arrowheads). Images from the OT are shown but bacteria were detected in all brain regions (n = 3). Cell nuclei were stained with DAPI. Scale bars, 10 μm. (K) Quantification of Tdtomato plasmid copies from rainbow trout whole brain from 3 hours to 14 days after exposure (n = 4). Different letters denote statistically significant differences (P < 0.05) by Welch’s ANOVA test.
Fig. 4.
Fig. 4.. Geographical survey of brain microbiomes from different salmonid species.
(A) Map of the sampling locations and species sampled in this study (n = 5 to 7). Wild juvenile and adult Chinook salmon: Oregon, USA (September 2022); laboratory-reared rainbow trout and Gila trout: New Mexico, USA; Atlantic salmon (freshwater and saltwater phases): Norway; control laboratory rainbow trout: South Bohemia, Czechia. (B) Relative abundance of bacterial phyla present in the gut, blood, and brain (Tel) from freshwater Atlantic salmon, saltwater Atlantic salmon, Gila trout, and rainbow trout from Czechia. (C) PCoA illustrates the microbial community variations within the gut, blood, and brain across each salmonid group. Note that for Atlantic salmon, only Tel samples are included. Ellipses represent a 95% confidence interval, underscoring significant community composition differences (P < 0.05). (D) Relative contribution of gut and blood microbial communities as potential sources for bacterial communities in the brain (Tel) microbial community in each of the four salmonid groups predicted by microbial SourceTracker2 analysis.
Fig. 5.
Fig. 5.. Chinook salmon brain microbiomes shift during life cycle.
(A) Schematic representation of the natural life cycle of Chinook salmon. Red asterisks indicate the two life stages sampled in this study. (B) Relative bacterial loads quantified by qPCR in the gut, blood, spleen, and four regions of the brain of juvenile and adult Chinook salmon. *P < 0.05; **P < 0.01 by Welch’s ANOVA test. ns, not significant. (C) LPS levels in serum from juvenile and adult Chinook salmon, ****P < 0.0001 by Tukey’s post hoc test. (D and E) Bacterial community composition at the phylum level of the gut, blood, spleen, and four areas of the brain of juvenile (D) and adult (E) Chinook salmon. (F) Bacterial community composition at the family level of the gut, blood, spleen, and four areas of the brain of juvenile Chinook salmon. (G) Bacterial community composition at the family level of the gut, blood, spleen, and four areas of the brain of adult Chinook salmon. (H) PCoA of the weighted UniFrac distance of the brain (Tel only) bacterial communities of all salmonids sampled in this study. Ellipses represent a 95% confidence interval, underscoring significant community composition differences (P < 0.05). (I) Linear discrimination analysis of the brain (Tel only) bacterial communities of all salmonids sampled in this study. (J) Immunofluorescence staining of Tel and OT paraffin sections from juvenile and adult Chinook salmon with anti–E. coli LPS antibody (green) and anti–β amyloid (red) shows elevated LPS levels and the presence of β amyloid in adult Chinook brain tissues compared to juveniles (n = 3). Nuclei were stained with DAPI (blue). Green arrows indicate LPS-positive puncta and white arrows point at β amyloid–positive puncta.

Similar articles

Cited by

References

    1. Cryan J. F., O’Riordan K. J., Cowan C. S., Sandhu K. V., Bastiaanssen T. F., Boehme M., Codagnone M. G., Cussotto S., Fulling C., Golubeva A. V., The microbiota-gut-brain axis. Physiol. Rev. 99, 1877–2013 (2019). - PubMed
    1. O’Riordan K. J., Collins M. K., Moloney G. M., Knox E. G., Aburto M. R., Fülling C., Morley S. J., Clarke G., Schellekens H., Cryan J. F., Short chain fatty acids: Microbial metabolites for gut-brain axis signalling. Mol. Cell. Endocrinol. 546, 111572 (2022). - PubMed
    1. Mohanta L., Das B. C., Patri M., Microbial communities modulating brain functioning and behaviors in zebrafish: A mechanistic approach. Microb. Pathog. 145, 104251 (2020). - PubMed
    1. R. D. Berg, Translocation of indigenous bacteria from the intestinal tract, in Human Intestinal Microflora in Health and Disease (Academic Press, 1983), chap. 15, pp. 333–352.
    1. Geva-Zatorsky N., Sefik E., Kua L., Pasman L., Tan T. G., Ortiz-Lopez A., Yanortsang T. B., Yang L., Jupp R., Mathis D., Mining the human gut microbiota for immunomodulatory organisms. Cell 168, 928–943.e11 (2017). - PMC - PubMed

Publication types

Substances

LinkOut - more resources