. 2024 Sep 20;10(38):eadp0719.
doi: 10.1126/sciadv.adp0719. Epub 2024 Sep 18.

ACSL6-activated IL-18R1-NF-κB promotes IL-18-mediated tumor immune evasion and tumor progression

Affiliations

ACSL6-activated IL-18R1-NF-κB promotes IL-18-mediated tumor immune evasion and tumor progression

Yuqin Di et al. Sci Adv. .

Abstract

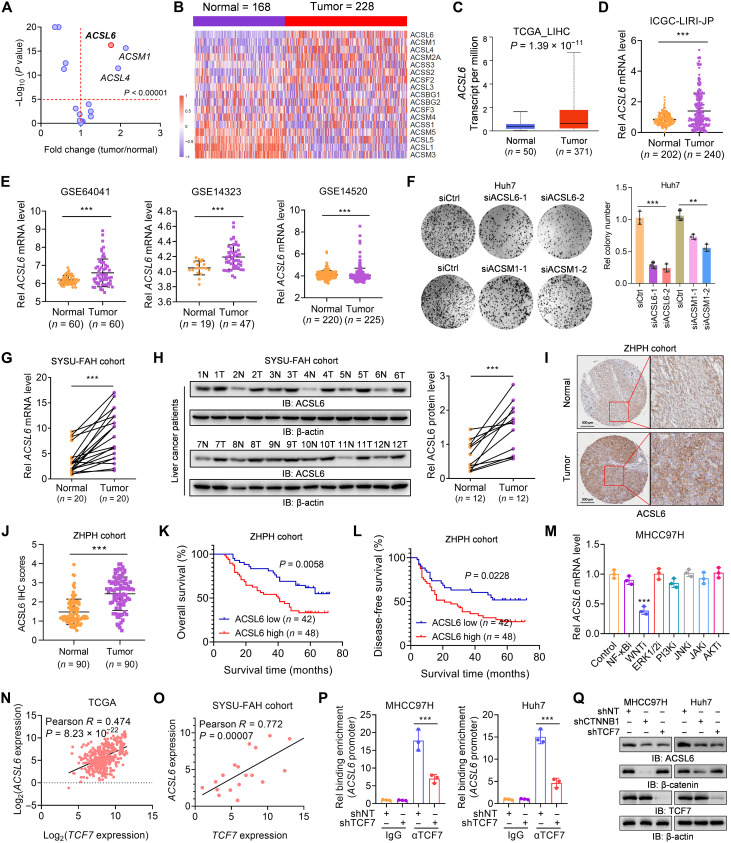
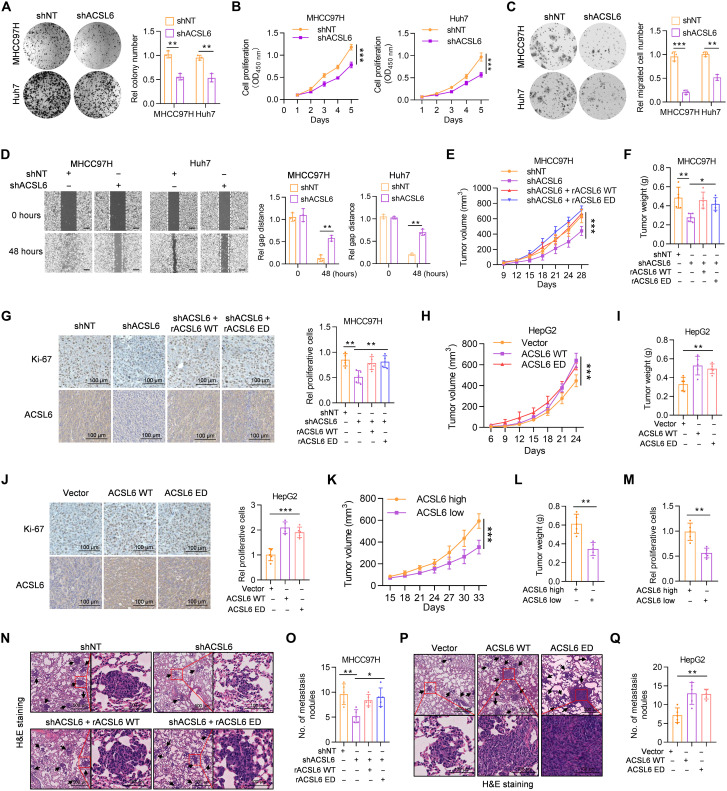
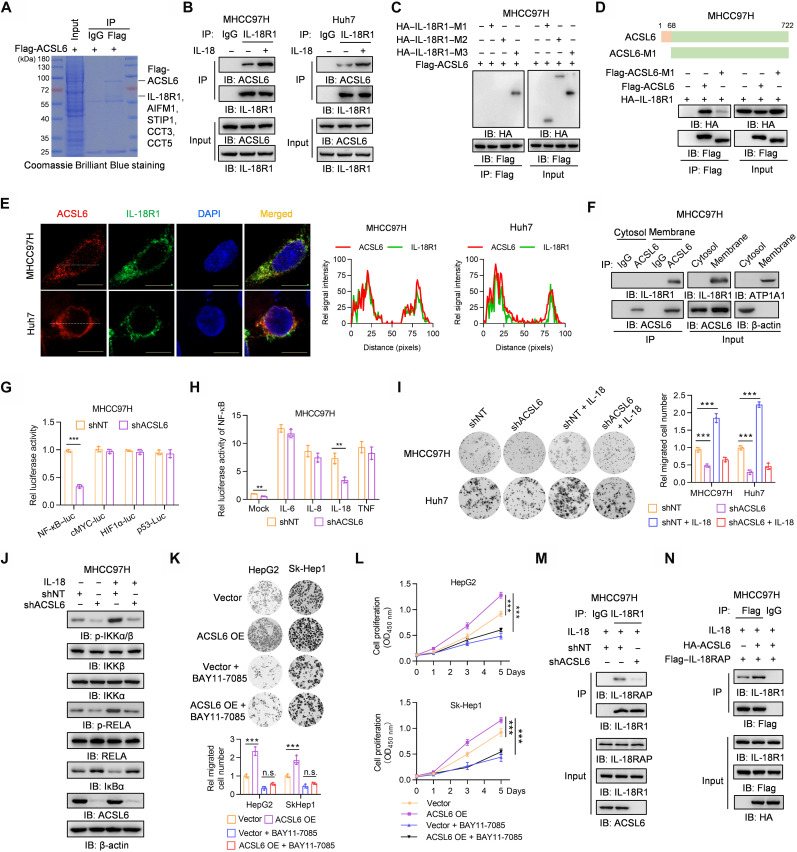
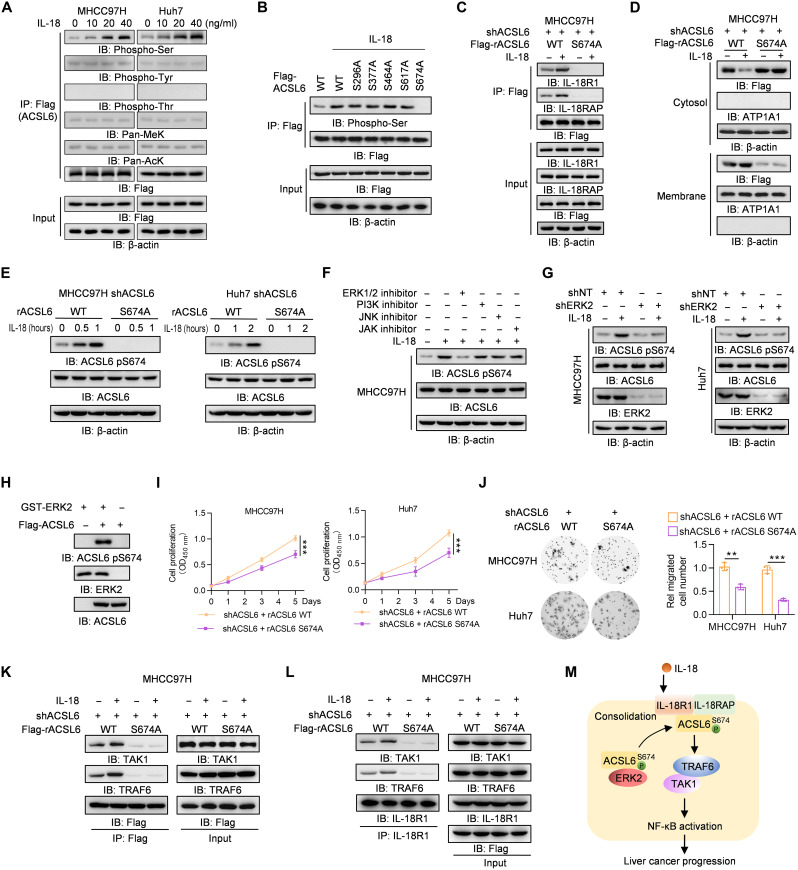
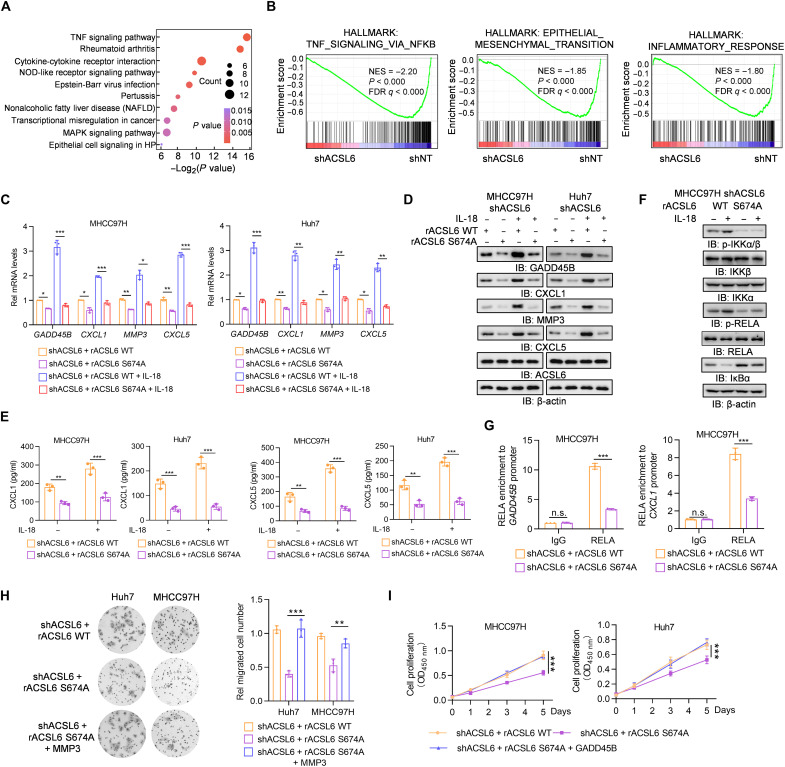
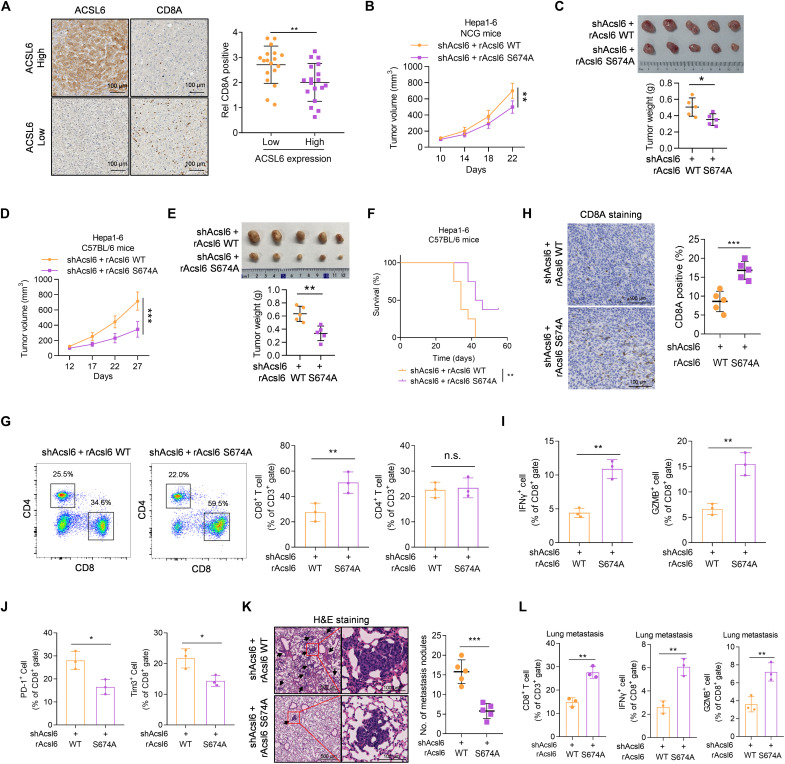
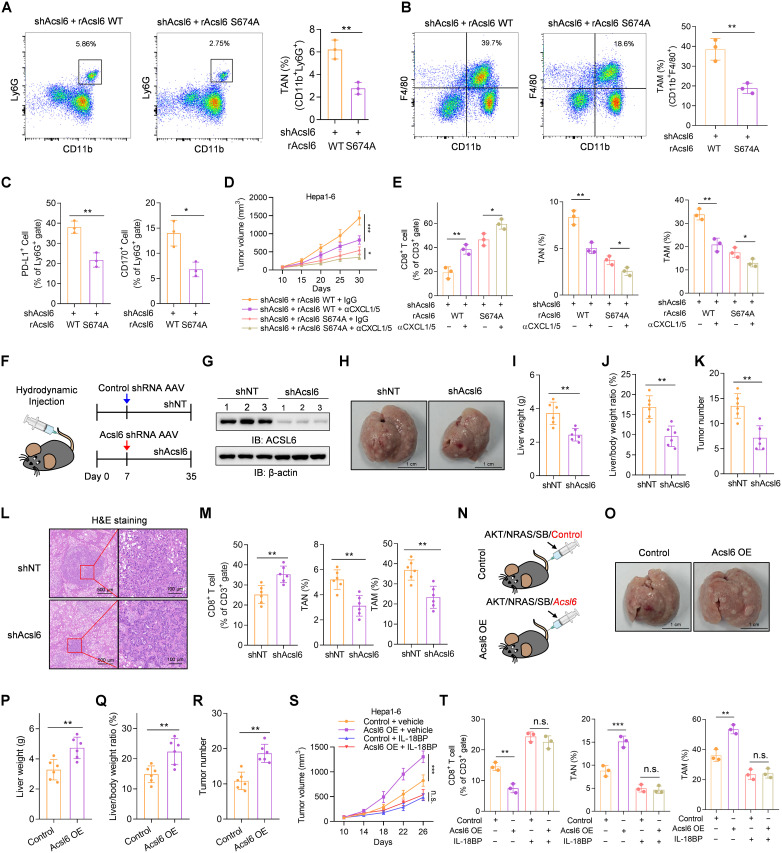
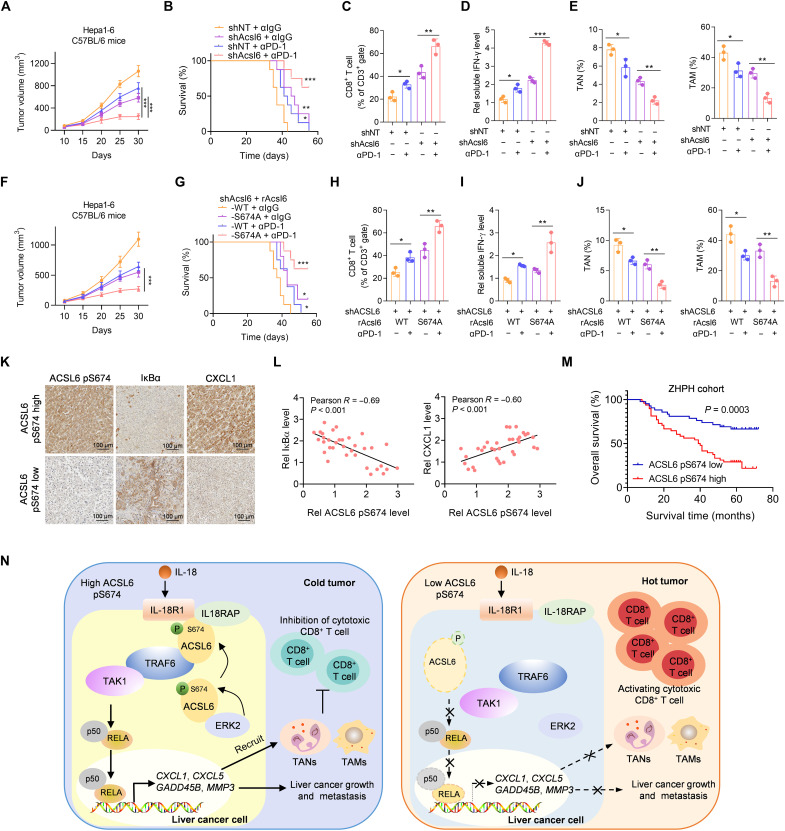
Aberrant activation of IL-18 signaling regulates tumor immune evasion and progression. However, the underlying mechanism remains unclear. Here, we report that long-chain acyl-CoA synthase 6 (ACSL6) is highly expressed in liver cancer and correlated with poor prognosis. ACSL6 promotes tumor growth, metastasis, and immune evasion mediated by IL-18, independent of its metabolic enzyme activity. Mechanistically, upon IL-18 stimulation, ACSL6 is phosphorylated by ERK2 at S674 and recruits IL-18RAP to interact with IL-18R1, thereby reinforcing the IL-18R1-IL-18RAP heterodimer and triggering NF-κB-dependent gene expression to facilitate tumor development. Furthermore, the up-regulation of CXCL1 and CXCL5 by ACSL6 promotes tumor-associated neutrophil and tumor-associated macrophage recruitment, thereby inhibiting cytotoxic CD8+ T cell infiltration. Ablation or S674A mutation of ACSL6 potentiated anti-PD-1 therapeutic efficacy by increasing the effector activity of intertumoral CD8+ T cells. We revealed that ACSL6 is a potential adaptor that activates IL-18-NF-κB axis-mediated tumor immune evasion and provides valuable insights for developing effective immunotherapy strategies for cancer.


Figures

Fig. 1.
Fig. 1.. ACSL6 is up-regulated in liver cancer and is associated with prognosis.
(A and B) Expression analyses (A) and heatmap (B) of 17 ACSs in liver tumor and nontumor tissues from GSE63898. (C to E) ACSL6 expression in liver tumor and nontumor tissues from The Cancer Genome Atlas (TCGA) database (C), International Cancer Genome Consortium (ICGC) database (D), and Gene Expression Omnibus (GEO) database (E). (F) Colony formation of Huh7 cells transfected with small interfering RNA control (siCtrl) or small interfering RNA (siRNA) targeting ACSL6 or ACSM1. (G and H) qPCR analyses of ACSL6 mRNA expression (G) and immunoblotting (IB) analyses of protein levels (H) in paired liver tumor and adjacent nontumor tissues from The First Affiliated Hospital, Sun Yat-sen University (SYSU-FAH). (I and J) Immunohistochemistry (IHC) analyses of ACSL6 expression in liver tumor and paired nontumor tissues from Zhuhai People’s Hospital (ZHPH). (K and L) Overall survival analyses (K) and disease-free survival analyses (L) based on ACSL6 expression in liver tumors. (M) Quantitative polymerase chain reaction (qPCR) analyses of ACSL6 expression in MHCC97H cells stimulated with inhibitors targeting NF-κB, WNT, extracellular signal–regulated kinase 1/2 (ERK1/2), phosphatidylinositol 3-kinase (PI3K), c-Jun N-terminal kinase (JNK), Janus kinase (JAK), and AKT. (N) A correlation analysis was conducted to assess the correlation between ACSL6 and TCF7 expression in TCGA liver cancer database. (O) A correlation analysis was performed to assess the correlation between ACSL6 and TCF7 expression in liver cancer tissue samples from SYSU-FAH cohort. (P) Chromatin immunoprecipitation (ChIP)–qPCR analyses of TCF7 binding to the ACSL6 promoter in shNT and short hairpin RNA targeting TCF7 (shTCF7) MHCC97H or Huh7 cells. (Q) Immunoblotting analyses were performed with the indicated antibodies in shNT, short hairpin RNA targeting CTNNB1 (shCTNNB1), and shTCF7 MHCC97H or Huh7 cells. **P < 0.01 and ***P < 0.001. Student’s t test [(C) to (E), (G), (H), (J), and (P)], one-way analysis of variance [ANOVA; (F) and (M)], and log-rank test [(K) and (L)].
Fig. 2.
Fig. 2.. ACSL6 promotes cell proliferation and migration in vitro and facilitates liver cancer growth and metastasis in vivo.
(A and B) Colony formation (A) and CCK-8 assays (B) of shNT or shACSL6 expressed MHCC97H and Huh7 cells. OD450 nm, optical density at 450 nm. (C and D) Transwell (C) and wound healing assays (D) in MHCC97H and Huh7 cells expressing shNT or shACSL6. (E to G) Subcutaneous injection of shNT, shACSL6, and shACSL6 rescued with resistant ACSL6 wild-type (rACSL6 WT) or enzymatically dead (ED) MHCC97H cells into nude mice. Tumor volumes (E), tumor weights (F), and Ki-67 staining (G) in the xenograft model. (H to J) Subcutaneous injection of vector, ACSL6 WT–, or ED-overexpressing HepG2 cells into nude mice. Tumor volumes (H), tumor weights (I), and Ki-67 staining (J) in the xenograft model. (K to M) Assessment of the effect of high or low ACSL6 expression in tumors obtained from patients with liver cancer on PDX mouse models. Tumor volumes (K), tumor weights (L), and relative proliferative cells (M) in the PDX mouse model. (N and O) Representative images of hematoxylin and eosin (H&E) staining (N) and statistical analysis (O) of metastatic lung nodules from mice injected with shNT, shACSL6, and shACSL6 rescued with rACSL6 WT or ED MHCC97H cells via the tail vein. (P and Q) Representative images of H&E staining (P) and statistical analysis (Q) of metastatic lung nodules from mice injected with vector, ACSL6 WT–, or ED-overexpressed HepG2 cells via the tail vein. [(E) to (Q)] n = 5. *P < 0.05, **P < 0.01, and ***P < 0.001. Student’s t test [(A), (C), (D), (L), and (M)], two-way ANOVA [(B), (E), (H), and (K)], one-way ANOVA [(F), (G), (I), (J), (O), and (Q)].
Fig. 3.
Fig. 3.. ACSL6 activates the IL-18–IL-18R1–NF-κB pathway by forming a complex with IL-18R1.
(A) Flag-ACSL6 was immunoprecipitated from MHCC97H cells expressing Flag-ACSL6, and then SDS–polyacrylamide gel electrophoresis (PAGE) followed by Coomassie Brilliant Blue staining and mass spectrometry (MS) analysis was performed. (B) MHCC97H and Huh7 cells were treated with or without IL-18 (20 ng ml−1) for 1 hour. (C) MHCC97H cells expressing Flag-ACSL6 were transfected with hemagglutinin (HA)–tagged vector, IL-18R1–M1, IL-18R1–M2, or IL-18R1–M3. (D) MHCC97H cells expressing HA–IL-18R1 were transfected with vector, Flag-ACSL6 WT, or M1. (E) Immunofluorescence (IF) analyses of ACSL6 and IL-18R1 colocalization in MHCC97H and Huh7 cells. DAPI, 4′,6-diamidino-2-phenylindole. (F) Membrane and cytosol fractions were prepared from MHCC97H cells. (G) Luciferase analyses in shNT and shACSL6 MHCC97H cells. HIF1α, hypoxia-inducible factor 1α. (H) Luciferase analyses of NF-κB–luc in shNT and shACSL6 MHCC97H cells treated with IL-6, IL-8, IL-18, and TNF (20 ng ml−1) for 12 hours. (I) Transwell assays in shNT or shACSL6 MHCC97H and Huh7 cells treated with or without IL-18 (20 ng ml−1). (J) Immunoblotting analyses in shNT and shACSL6 MHCC97H cells treated with or without IL-18 (20 ng ml−1) for 1 hour. (K and L) Transwell (K) and CCK-8 assays (L) in vector or ACSL6-overexpressed (OE) HepG2 and Sk-Hep1 cells treated with or without 10 μM BAY11-7085. n.s., not significant. (M) MHCC97H cells expressing shNT or shACSL6 were treated with IL-18 (20 ng ml−1) for 1 hour. (N) MHCC97H cells expressing Flag–IL-18RAP were infected with HA-ACSL6 and then treated with IL-18 (20 ng ml−1) for 1 hour. [(B) to (D), (F), (M), and (N)] Immunoprecipitation and immunoblotting analyses were performed with indicated antibodies. **P < 0.01 and ***P < 0.001. Student’s t test [(G) and (H)], one-way ANOVA [(I) and (K)], and two-way ANOVA (L).
Fig. 4.
Fig. 4.. IL-18 induces ACSL6 pS674 to activate NF-κB signaling.
(A) Flag-ACSL6–overexpressed MHCC97H and Huh7 cells were treated with different concentrations of IL-18 for 1 hour. Immunoprecipitation and immunoblotting analyses were performed. (B) Flag-ACSL6 WT and mutant overexpressed cells were treated with or without IL-18 (20 ng ml−1) for 1 hour. Immunoprecipitation and immunoblotting were performed. (C and D) ACSL6-depleted MHCC97H cells were infected with Flag-ACSL6 WT or S674A and then treated with or without IL-18 (20 ng ml−1) for 1 hour. Immunoprecipitation (C) and subcellular fractionation detection (D) were performed. (E) Immunoblotting analyses in ACSL6-depleted MHCC97H and Huh7 cells reconstituted with Flag-rACSL6 WT or S674A and treated with or without IL-18 (20 ng ml−1) for indicated times. (F) Immunoblotting analyses in MHCC97H cells treated with or without indicated inhibitors for 6 hours, followed by treatment with IL-18 (20 ng ml−1) for 1 hour. (G) Immunoblotting analyses in shNT or shERK2 MHCC97H and Huh7 cells treated with or without IL-18 (20 ng ml−1) for 1 hour. (H) In vitro kinase assay was performed by mixing GST-ERK2 and Flag-ACSL6. (I and J) CCK-8 (I) and transwell assays (J) in ACSL6-depleted MHCC97H and Huh7 cells reconstituted with rACSL6 WT or S674A. (K and L) ACSL6-depleted MHCC97H cells were infected with Flag-rACSL6 WT or S674A and then treated with or without IL-18 (20 ng ml−1) for 1 hour. Immunoprecipitation analyses were performed using anti-Flag (K) or anti–IL-18R1 antibodies (L). (M) Mechanism through which ACSL6 activates the IL-18–IL-18R1–NF-κB pathway by forming a complex with IL-18R1 and consolidating the IL-18R1–IL-18RAP heterodimer. **P < 0.01 and ***P < 0.001. Two-way ANOVA (I) and one-way ANOVA (J).
Fig. 5.
Fig. 5.. ACSL6 promotes NF-κB signaling to drive NF-κB–dependent gene expression.
(A and B) Kyoto Encyclopedia of Genes and Genomes (A) and gene set enrichment analysis (GSEA) analyses (B) of RNA-seq data from shNT and shACSL6 MHCC97H cells. MAPK, mitogen-activated protein kinase; FDR, false discovery rate; NES, normalized enrichment score. (C to E) ACSL6-depleted MHCC97H and Huh7 cells were infected with rACSL6 WT or S674A and then treated with or without IL-18 (20 ng ml−1) for 12 hours. The mRNA (C) and protein expression (D) levels of the indicated genes and concentrations of CXCL1 and CXCL5 (E) in the medium were detected. (F) ACSL6-depleted MHCC97H cells were infected with rACSL6 WT or S674A and then treated with or without IL-18 (20 ng ml−1) for 1 hour. Immunoblotting analyses were performed with indicated antibodies. (G) ChIP-qPCR analyses were performed with the indicated antibodies, and DNA was amplified with primers targeting positive sites in the GADD45B or CXCL1 gene in ACSL6-depleted MHCC97H cells with forced expression of rACSL6 WT and S674A. (H) Transwell assays of the migration ability of ACSL6-depleted MHCC97H or Huh7 cells with forced expression of rACSL6 WT, S674A, or S674A and MMP3. (I) CCK8 analyses of ACSL6-depleted MHCC97H or Huh7 cells with forced expression of rACSL6 WT, S674A, or S674A with GADD45B. *P < 0.05, **P < 0.01, and ***P < 0.001. One-way ANOVA [(C), (E), (G), and (H)] and two-way ANOVA (I).
Fig. 6.
Fig. 6.. ACSL6 pS674 drives liver cancer immune evasion.
(A) IHC staining and quantification showing the inverse correlation between ACSL6 expression and CD8A levels in patients with liver cancer. (B and C) Subcutaneous injection of Acsl6-depleted Hepa1-6 cells with forced expression of rAcsl6 WT and S674A into NCG mice. Tumor volumes (B) and tumor images and weights (C) in the xenograft model. (D to J) Subcutaneous injection of Acsl6-depleted Hepa1-6 cells with forced expression of rAcsl6 WT or S674A into C57BL/6 mice. Tumor volumes (D), tumor images and weights (E), and survival rates (F) are shown. Flow cytometry analyses of tumor-infiltrating CD8+ and CD4+ T cells (G). IHC staining analyses of CD8A levels (H). Flow cytometry analyses of tumor-infiltrating IFN-γ+CD8+ and GZMB+CD8+ T cells (I) and tumor-infiltrating PD-1+CD8+ and Tim3+CD8+ T cells (J) in indicated tumors. (K and L) Representative images of H&E staining and statistics of metastatic lung nodules (K) and flow cytometry analyses of tumor-infiltrating CD8+ T cells, IFN-γ+CD8+ T cells, and GZMB+CD8+ T cells (L) from C57BL/6 mice injected with Acsl6-depleted Hepa1-6 cells with forced expression of rAcsl6 WT and S674A. [(B) to (E)] n = 5; (F) n = 10. *P < 0.05, **P < 0.01, and ***P < 0.001. Student’s t test [(A), (C), (E), and (G) to (L)], two-way ANOVA [(B) and (D)], and log-rank test (F).
Fig. 7.
Fig. 7.. ACSL6 pS674 promotes TANs and TAMs recruitment.
(A to C) Flow cytometry analyses of tumor-infiltrating TANs (A), TAMs (B), PD-L1+ TANs, and CD170+ TANs (C) in indicated tumors from C57BL/6 mice. (D and E) Acsl6-depleted Hepa1-6 cells with forced expression of rAcsl6 WT or S674A were subcutaneously injected into C57BL/6 mice, which were then treated with or without neutralizing antibodies against CXCL1 and CXCL5. Tumor volumes were recorded (D). Flow cytometry analyses of tumor-infiltrating CD8+ T cells, TANs, and TAMs (E). (F to M) Liver cancer mouse model was constructed by hydrodynamic transfection of AKT/NRAS/SB plasmids before the injection of AAV8-TBG-miR30-Acsl6-shRNA-GFP or AAV8-TBG-GFP-miR30-shRNA. Schematic diagram and injection timeline (F). Immunoblotting analyses were performed with indicated antibodies (G). Representative liver images are shown (H). Liver weight (I), liver weight/body weight ratio (J), and tumor numbers (K) were measured. Representative image of H&E staining of mouse liver sections are shown (L). Flow cytometry analyses of tumor-infiltrating CD8+ T cells, TANs, and TAMs in indicated tumors (M). (N to R) Liver cancer mouse model was generated by hydrodynamic transfection of indicated plasmids (N). Representative liver images are shown (O). Liver weights (P), liver weight/body weight ratio (Q), and tumor numbers (R) were calculated. (S and T) Control or Acsl6-OE Hepa1-6 cells were subcutaneously injected into C57BL/6 mice, which were then treated with or without IL-18BP. Tumor volumes (S) and tumor-infiltrating CD8+ T cells, TANs, and TAMs (T) were analyzed. [(D) and (S)] n = 5; [(F) to (R)] n = 6. *P < 0.05, **P < 0.01, and ***P < 0.001. Student’s t test [(A) to (C), (I) to (K), (M), and (P) to (R)], two-way ANOVA [(D) and (S)], and one-way ANOVA [(E) and (T)].
Fig. 8.
Fig. 8.. The level of ACSL6 pS674 negatively correlates with the efficacy of ICIs therapy and the prognosis of patients with liver cancer.
(A to E) Mice with established Acsl6 depletion or control Hepa1-6 tumors were treated with or without anti–PD-1. Tumor volumes (A) and survival rates (B) were recorded. Flow cytometry analyses of tumor-infiltrating CD8+ T cells (C). Measurement of the concentration of IFN-γ (D). Flow cytometry analyses of TANs and TAMs (E). (F to J) Acsl6 WT or S674A was reconstituted into Acsl6-depleted Hepa1-6 cells, which were then subcutaneously injected into C57BL/6 mice, and mice were subsequently treated with anti–PD-1. Tumor volumes (F) and survival rates (G) were recorded. Flow cytometry analyses of tumor-infiltrating CD8+ T cells (H). Measurement of the concentration of IFN-γ (I). Flow cytometry analyses of TANs and TAMs (J). (K and L) IHC staining with anti–ACSL6 pS674, anti-IκBα, and anti-CXCL1 antibodies in tumors from patients with liver cancer from ZHPH (K) and correlation analyses (L). (M) Kaplan-Meier analyses of overall survival according to the ACSL6 pS674 level in patients with liver cancer from ZHPH cohort. (N) Proposed model of the mechanism by which ACSL6 activates IL-18–NF-κB signaling to promote immune evasion and tumor progression in liver cancer. [(A) and (E)] n = 5; [(B) and (G)] n = 10. *P < 0.05, **P < 0.01, and ***P < 0.001. Two-way ANOVA [(A) and (F)], log-rank test [(B), (G), and (M)], and one-way ANOVA [(C) to (E) and (H) to (J)].

References

    1. Sung H., Ferlay J., Siegel R. L., Laversanne M., Soerjomataram I., Jemal A., Bray F., Global Cancer Statistics 2020: GLOBOCAN estimates of incidence and mortality worldwide for 36 cancers in 185 countries. CA Cancer J. Clin. 71, 209–249 (2021). - PubMed
    1. Vogel A., Meyer T., Sapisochin G., Salem R., Saborowski A., Hepatocellular carcinoma. Lancet 400, 1345–1362 (2022). - PubMed
    1. Rizvi S., Wang J., El-Khoueiry A. B., Liver cancer immunity. Hepatology 73, 86–103 (2021). - PMC - PubMed
    1. Finn R. S., Qin S. K., Ikeda M., Galle P. R., Ducreux M., Kim T. Y., Kudo M., Breder V., Merle P., Kaseb A. O., Li D. N., Verret W., Xu D. Z., Hernandez S., Liu J., Huang C., Mulla S., Wang Y. L., Lim H. Y., Zhu A. X., Cheng A. L., Atezolizumab plus bevacizumab in unresectable hepatocellular carcinoma. N. Engl. J. Med. 382, 1894–1905 (2020). - PubMed
    1. Gordon S. R., Aute R. L. M., Dulken B. W., Hutter G., George B. M., Ccracken M. N. M., Gupta R., Tsai J. M., Sinha R., Corey D., Ring A. M., Connolly A. J., Weissman I. L., PD-1 expression by tumour-associated macrophages inhibits phagocytosis and tumour immunity. Nature 545, 495–499 (2017). - PMC - PubMed

MeSH terms