. 2024 Sep 20;10(38):eadq1476.
doi: 10.1126/sciadv.adq1476. Epub 2024 Sep 18.

CCR2 cooperativity promotes hematopoietic stem cell homing to the bone marrow

Affiliations

CCR2 cooperativity promotes hematopoietic stem cell homing to the bone marrow

Stephanie N Hurwitz et al. Sci Adv. .

Abstract

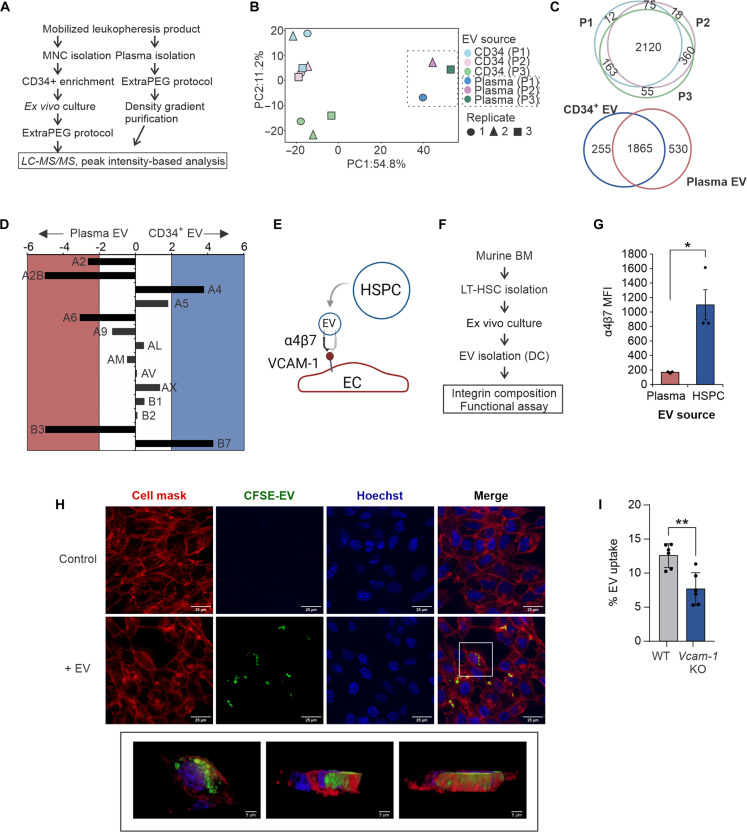
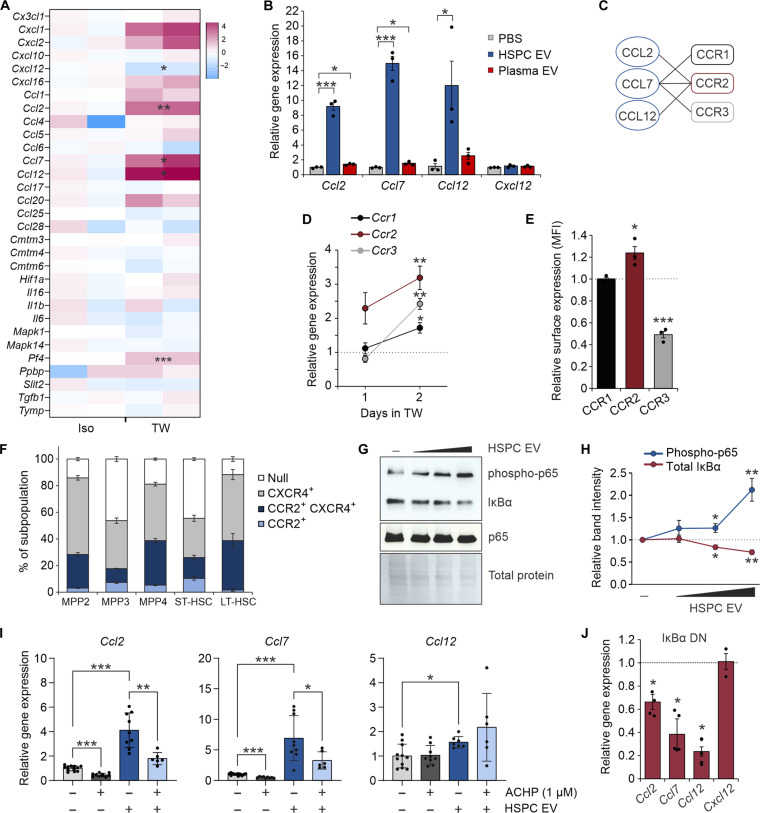
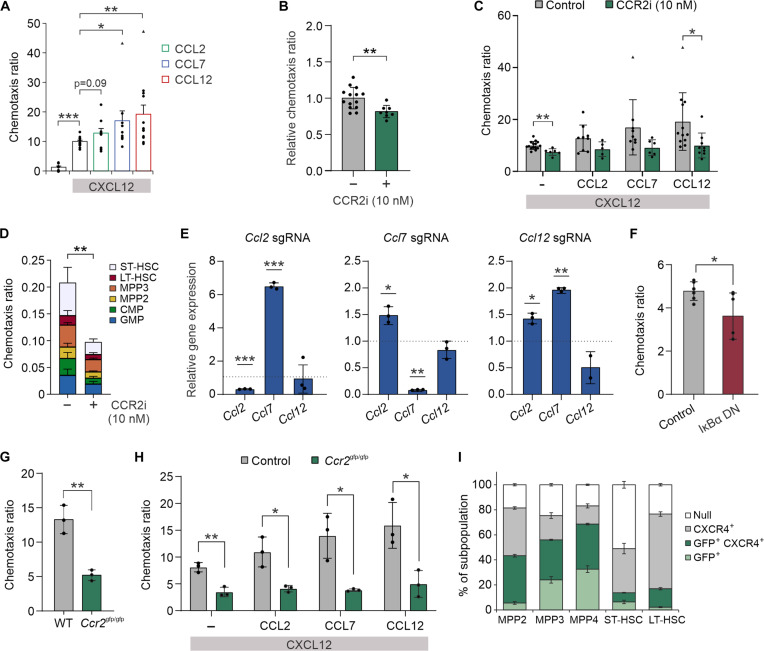
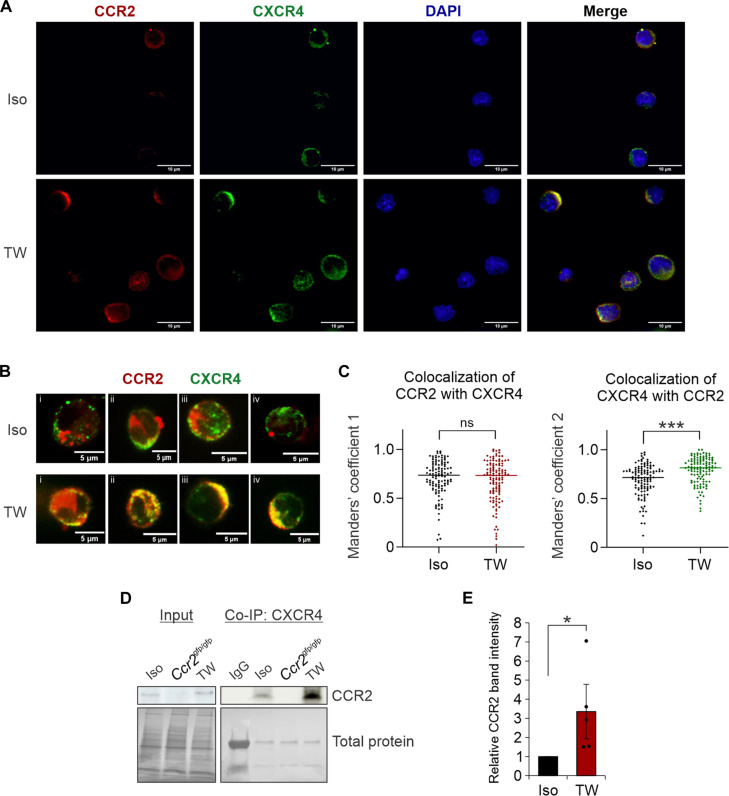
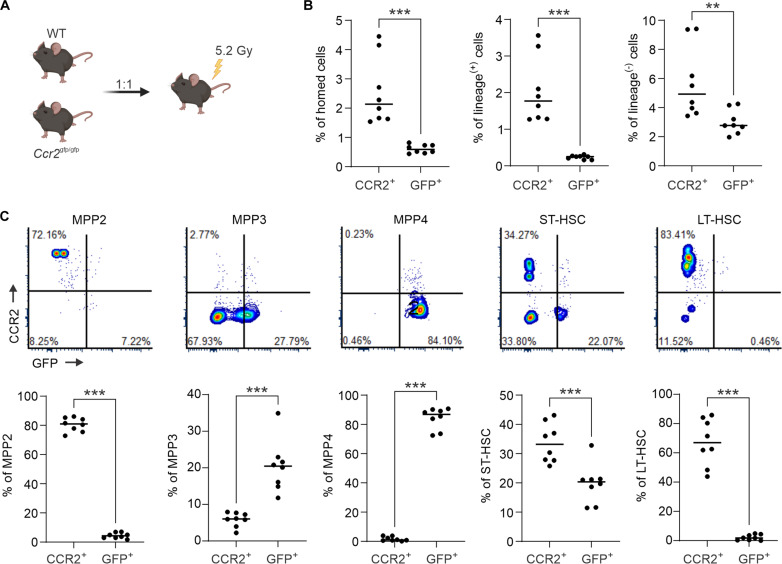
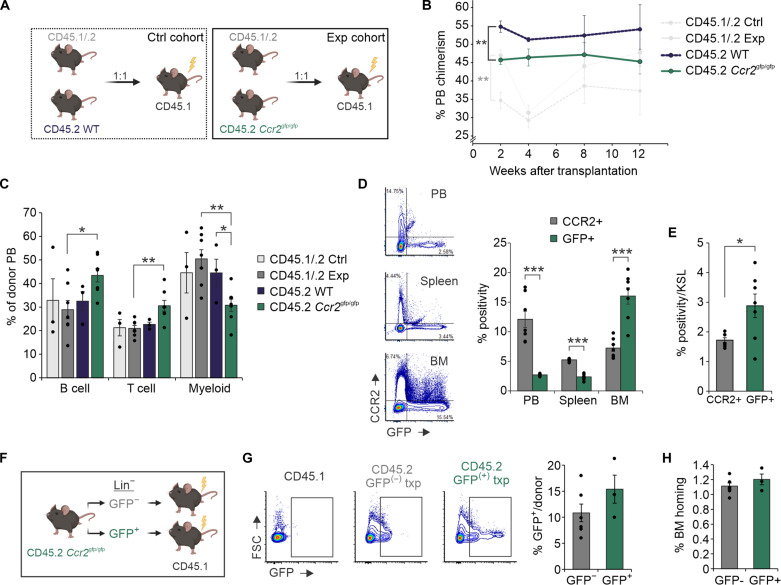
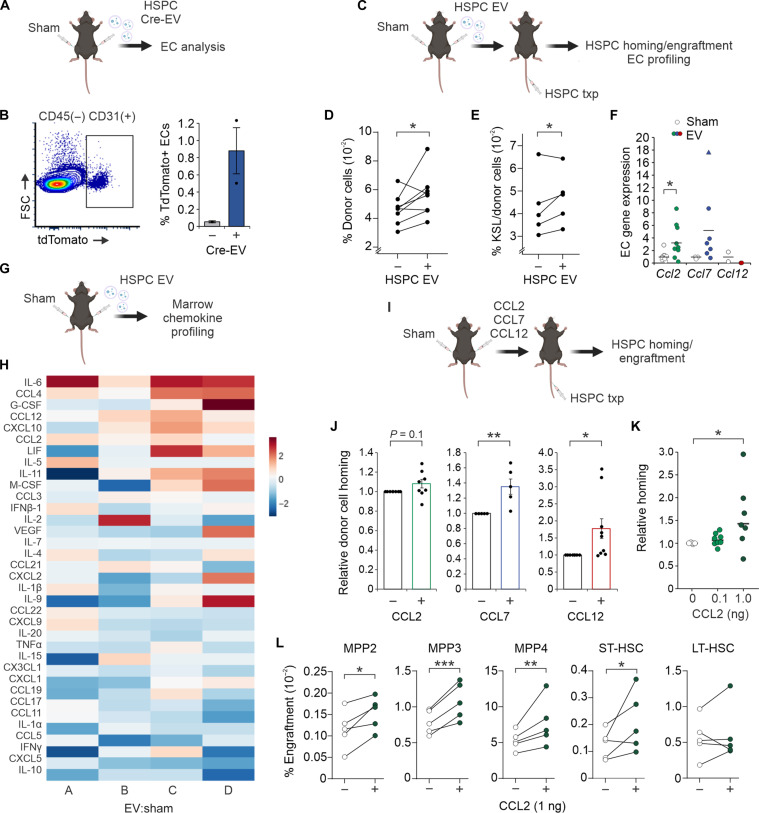
Cross-talk between hematopoietic stem and progenitor cells (HSPCs) and bone marrow (BM) cells is critical for homing and sustained engraftment after transplantation. In particular, molecular and physical adaptation of sinusoidal endothelial cells (ECs) promote HSPC BM occupancy; however, signals that govern these events are not well understood. Extracellular vesicles (EVs) are mediators of cell-cell communication crucial in shaping tissue microenvironments. Here, we demonstrate that integrin α4β7 on murine HSPC EVs targets uptake into ECs. In BM ECs, HSPC EVs induce up-regulation of C-C motif chemokine receptor 2 (CCR2) ligands that synergize with CXCL12-CXCR4 signaling to promote BM homing. In nonirradiated murine models, marrow preconditioning with HSPC EVs or recombinant CCR2 ligands improves homing and early graft occupancy after transplantation. These findings identify a role for HSPC EVs in remodeling ECs, newly define CCR2-dependent graft homing, and inform novel translational conditioning strategies to improve HSPC transplantation.


Figures

Fig. 1.
Fig. 1.. Enriched integrin α4β7 targets HSPC EV uptake into ECs.
(A) Workflow for isolation and purification of HSPC-derived vesicles and donor-matched plasma EV controls (n = 3 donors). (B) Principle components analysis of protein cargo identified in HSPC and plasma EVs. (C) Overlap of unique proteins in HSPC EVs from donors 1 to 3 (P1 to P3) and plasma EVs. (D) Enrichment analysis of integrin subunits in HSPC EVs compared to plasma EVs. (E) Proposed model of HSPC EV uptake into ECs; created with BioRender. (F) Workflow for isolation and analysis of murine HSPC-derived EVs. (G) Flow cytometric analysis of integrin α4β7 in murine EVs. (H) Representative confocal microscopy images of HSPC EV uptake into BM ECs. (I) Flow cytometric measurement of CFSE-dyed EV uptake into Vcam-1 KO ECs. LC-MS/MS, liquid chromatography tandem mass spectrometry; DC, differential centrifugation; MFI, mean fluorescence intensity; LT-HSC, long-term HSC. *P < 0.05 and **P < 0.01.
Fig. 2.
Fig. 2.. HSPC EVs remodel the EC secretome through NF-κB activation.
(A) Transcriptional analysis of murine BM ECs by RT2 Profiler PCR Array. ECs were cultured in isolation or in noncontact 1.0-μm transwell dishes with murine HSPCs for comparative analysis. (B) Relative gene expression of target chemokines following transfer of HSPC or plasma-derived EVs (103 to 104 EV per cell). (C) Known receptor-ligand binding partners of CCR1 to CCR3. (D) Relative gene expression of CCR2 ligand (CCR2L) receptors on HSPCs after 1 to 2 days in transwell culture with ECs. Dotted line denotes isolated HSPCs. (E) Relative surface expression of CCR1 to CCR3 on HSPCs after 2 days in transwell EC culture. Dotted line denotes isolated HSPCs. (F) Surface expression of CCR2 and CXCR4 on HSPC subpopulations. (G) Representative immunoblots and (H) quantitative analysis demonstrating a dose-dependent activation of canonical NF-κB signaling in ECs after HSPC EV uptake. (I) Relative gene expression of CCR2L in ECs after HSPC EV transfer and treatment with the IκB kinase inhibitor, ACHP. (J) Relative gene expression of CCR2L and Cxcl12 after HSPC EV uptake into WT ECs (dotted line) or cells transduced with an IκBα dominant-negative (DN) mutant. Iso, isolated; TW, transwell. *P < 0.05, **P < 0.01, and ***P < 0.001.
Fig. 3.
Fig. 3.. CCR2 receptor-ligand interactions promote HSPC chemotaxis toward ECs.
(A) Chemotaxis ratio of murine HSPCs through 5-μm pores toward CCR2L chemokine gradients (200 ng/ml). Chemotaxis assays were performed in the presence of CXCL12 (200 ng/ml). Chemotaxis of HSPCs toward (B) BM ECs or (C) CXCL12/CCR2L gradients after CCR2i. (D) Flow cytometric analysis of HSPC subpopulation-specific migration toward ECs after CCR2i. (E) Relative gene expression of all CCR2L in BM ECs harboring individual gene KO by CRISPR-Cas9 after HSPC EV uptake (WT, dotted line), demonstrating compensatory up-regulation of residual CCR2L after EV exposure. (F) Chemotaxis ratio of HSPCs toward WT ECs or ECs transduced with an IκBα dominant-negative mutant. Chemotaxis ratio of Ccr2gfp/gfp HSPCs compared to WT HSPCs toward (G) BM ECs or (H) chemokine gradients. (I) GFP and surface CXCR4 expression across subpopulations in Ccr2gfp/gfp marrows. *P < 0.05, **P < 0.01, and ***P < 0.001. Triangle points denote statistically significant outliers.
Fig. 4.
Fig. 4.. EC-activated HSPCs show CXCR4 and CCR2 cooperation.
(A) Representative confocal images showing CCR2 and CXCR4 localization in isolated HSPCs versus those grown in EC cocultures. (B) Representative high-power images of individual cells analyzed. (C) Calculation of Manders’ overlap coefficients (n = 118 to 120 cells per condition). (D) Representative immunoblot analyses and (E) quantitative analysis of CCR2 in HSPC lysates after CXCR4 immunoprecipitation. *P < 0.05 and ***P < 0.001. ns, not significant; Co-IP, coimmunoprecipitation; DAPI, 4′,6-diamidino-2-phenylindole; IgG, immunoglobulin G.
Fig. 5.
Fig. 5.. CCR2 is necessary for optimal HSPC homing to the BM.
(A) Experimental schematic of competitive homing using WT and Ccr2gfp/gfp BM (n = 8). (B) Flow cytometric analysis measuring the relative frequency of CCR2+ versus GFP+ (CCR2) cells, including lineage-positive and lineage-negative cells within the CD45.2 cell compartment 20 hours after transplantation. (C) Representative flow cytometry plots and quantitative analysis of CD45.2+ CCR2+ versus CD45.2+ GFP+ cells across each subpopulation. Experimental schematics created using BioRender. **P < 0.01 and ***P < 0.001.
Fig. 6.
Fig. 6.. Dynamic CCR2 signaling regulates BM niche occupancy.
(A) Experimental schematic of competitive transplantations (1:1 donor ratio) using CD45.1/.2 WT versus Ccr2gfp/gfp BM (n = 7). Recipient CD45.1 mice were lethally irradiated 24 hours before transplantation. A control cohort (n = 3) using CD45.1/CD45.2 WT versus CD45.2 WT BM was also analyzed. (B) PB chimerism of WT and Ccr2gfp/gfp grafts in individual mice after transplantation. (C) PB lineage analysis at 12 weeks after transplantation. (D) Representative flow cytometric plots and quantitative analysis of CCR2+ and GFP+ donor cells and (E) BM KSL in experimental cohort animals 12 weeks after transplantation. (F) Experimental schematic of noncompetitive Ccr2gfp/gfp GFP versus GFP+ graft transplantations. (G) Representative flow cytometric plots and quantitative analysis of GFP positivity in BM 20 hours after transplantation from initial GFP versus GFP+ grafts. (H) Flow cytometry measurement of overall donor cell BM frequency. Experimental schematics created using BioRender. *P < 0.05, **P < 0.01, and ***P < 0.001.
Fig. 7.
Fig. 7.. Preconditioning with HSPC EVs or CCR2 ligands improves HSPC homing to the BM.
(A) Schematic detailing intrafemoral injection of HSPC EVs containing Cre mRNA into tdTomato (Ai9) mice. (B) Representative flow plot and quantitative analysis of tdTomato fluorescence in BM ECs isolated from EV-injected marrows. (C) Schematic detailing intrafemoral injection of HSPC EVs before systemic cell transplantation. (D) Flow cytometric quantification of HSPC homing (20 hours after transplantation) toward EV versus sham conditioned marrows (n = 7). (E) Quantification of c-Kit+ Sca-1+ lineage (KSL) progenitors engrafted in EV versus sham conditioned marrows after 4 weeks (n = 5). (F) Relative gene expression analysis of BM ECs isolated from EV versus sham conditioned marrows (n = 7). (G) Schematic detailing intrafemoral injection of EVs for BM cytokine array profiling (n = 4). (H) Heatmap of fold change (FC; log 2) abundance of cytokines in EV versus sham-conditioned BM. Each column corresponds to the FC of EV:sham-injected marrows in an individual mouse. (I) Schematic detailing intrafemoral injection of individual CCR2L prior to cell transplantation. (J) Flow measurement of HSPC homing toward BM conditioned with individual CCR2L (0.1 ng) versus contralateral sham-injected marrows (n = 4 to 8 per cohort). (K) Relative homing of HSPCs following dose escalation (n = 8) of CCL2 conditioning compared to contralateral sham-injected marrows. (L) Subpopulation-specific engraftment in CCL2-conditioned marrows compared to contralateral sham-injected marrows 4 weeks after transplantation (n = 5). Schematics created using BioRender. *P < 0.05, **P < 0.01, and ***P < 0.001.

References

    1. Nombela-Arrieta C., Pivarnik G., Winkel B., Canty K. J., Harley B., Mahoney J. E., Park S.-Y., Lu J., Protopopov A., Silberstein L. E., Quantitative imaging of haematopoietic stem and progenitor cell localization and hypoxic status in the bone marrow microenvironment. Nat. Cell Biol. 15, 533–543 (2013). - PMC - PubMed
    1. Wright D. E., Wagers A. J., Gulati A. P., Johnson F. L., Weissman I. L., Physiological migration of hematopoietic stem and progenitor cells. Science 294, 1933–1936 (2001). - PubMed
    1. Massberg S., Schaerli P., Knezevic-Maramica I., Köllnberger M., Tubo N., Moseman E. A., Huff I. V., Junt T., Wagers A. J., Mazo I. B., von Andrian U. H., Immunosurveillance by hematopoietic progenitor cells trafficking through blood, lymph, and peripheral tissues. Cell 131, 994–1008 (2007). - PMC - PubMed
    1. Katayama Y., Battista M., Kao W.-M., Hidalgo A., Peired A. J., Thomas S. A., Frenette P. S., Signals from the sympathetic nervous system regulate hematopoietic stem cell egress from bone marrow. Cell 124, 407–421 (2006). - PubMed
    1. Watts K. L., Adair J., Kiem H.-P., Hematopoietic stem cell expansion and gene therapy. Cytotherapy 13, 1164–1171 (2011). - PMC - PubMed