. 2024 Sep 18;16(765):eadk7832.
doi: 10.1126/scitranslmed.adk7832. Epub 2024 Sep 18.

Deep humoral profiling coupled to interpretable machine learning unveils diagnostic markers and pathophysiology of schistosomiasis

Affiliations

Deep humoral profiling coupled to interpretable machine learning unveils diagnostic markers and pathophysiology of schistosomiasis

Anushka Saha et al. Sci Transl Med. .

Abstract

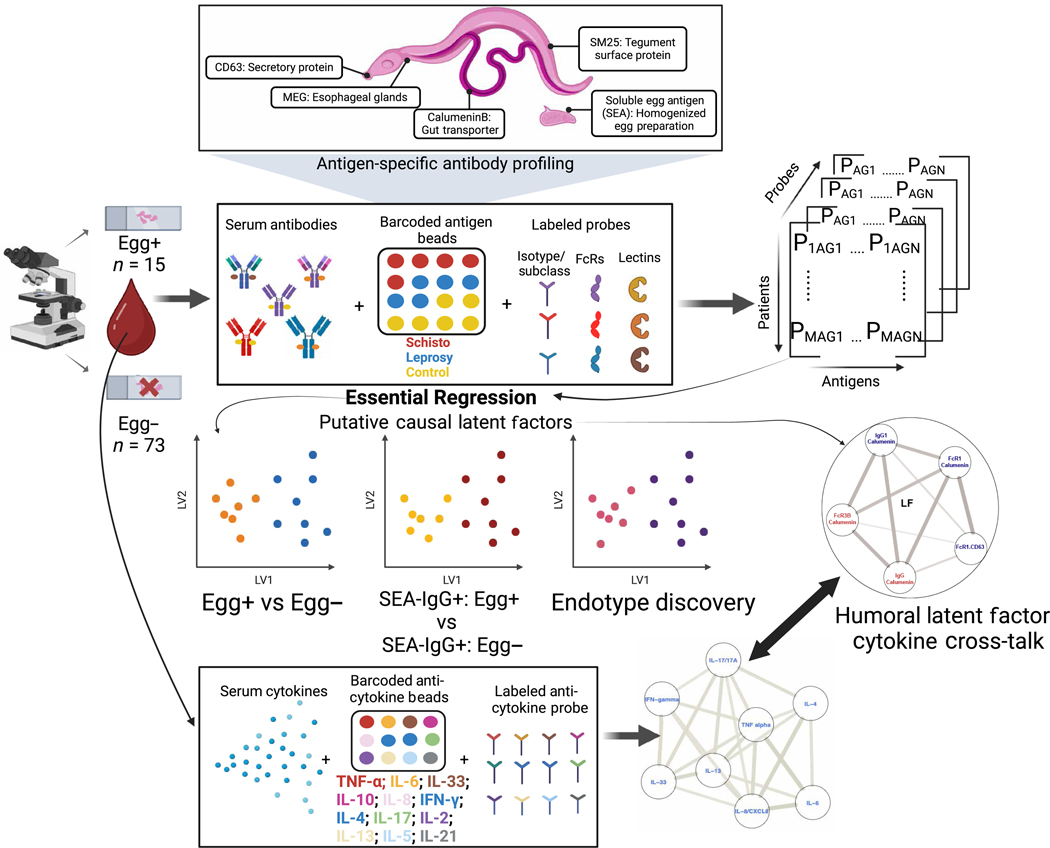
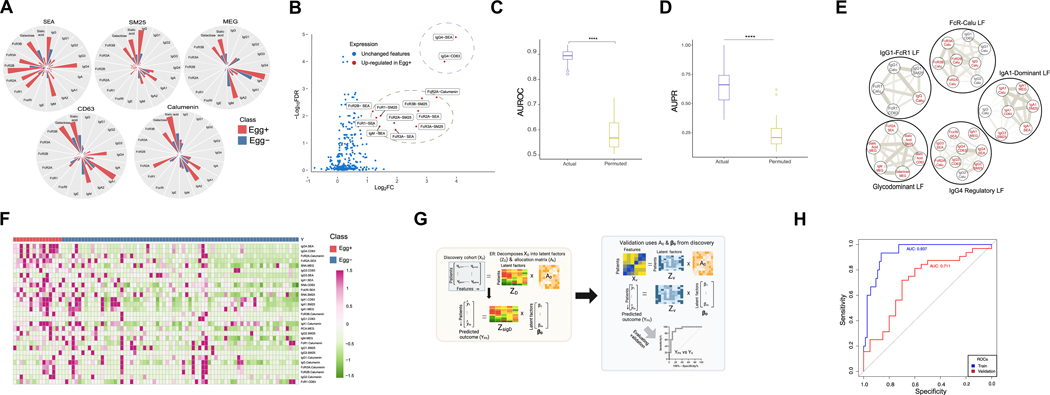
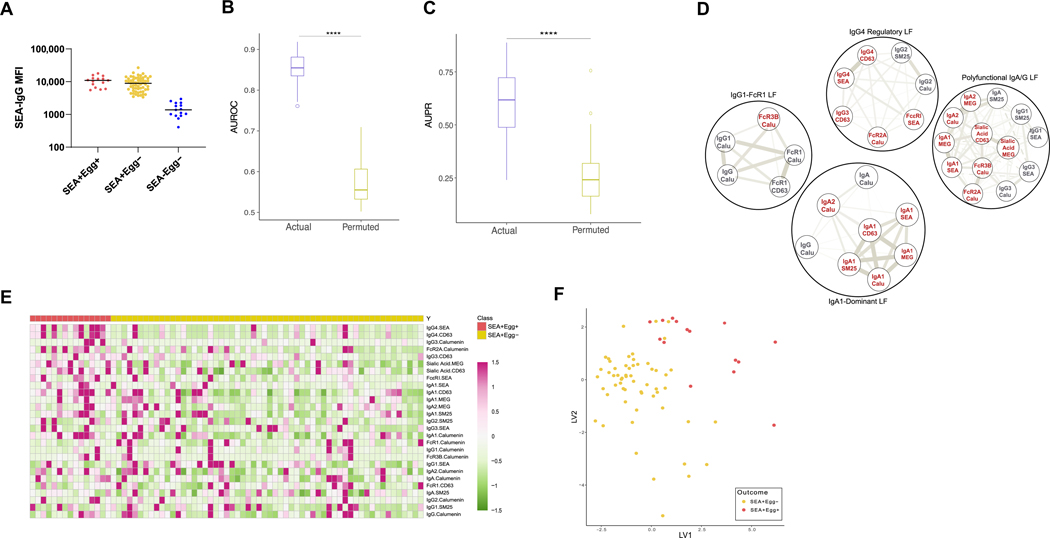
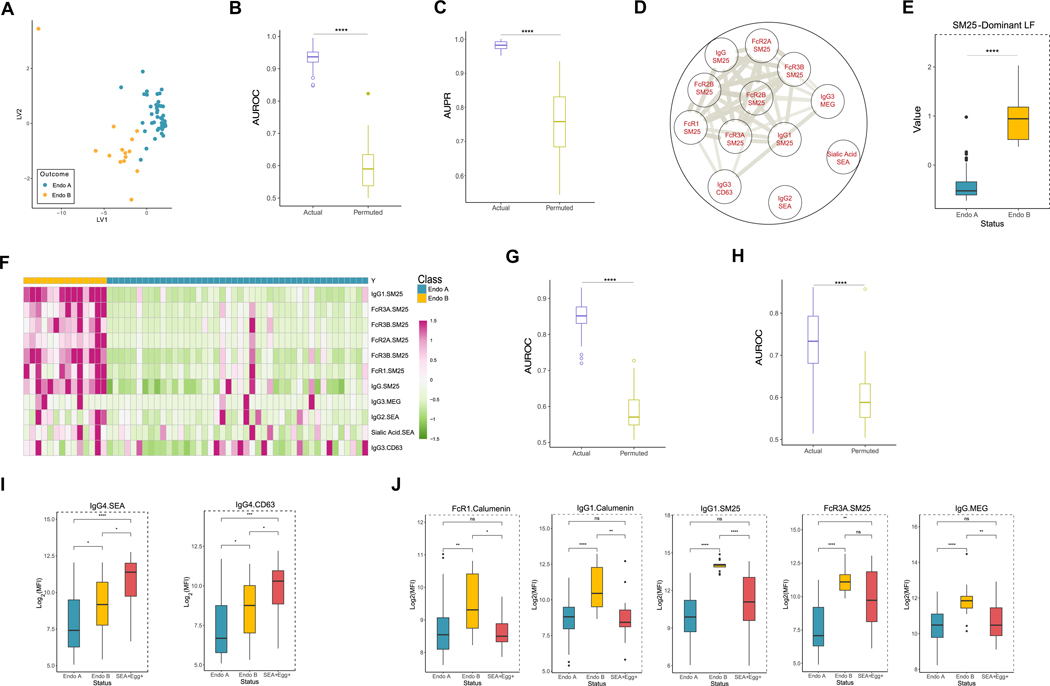
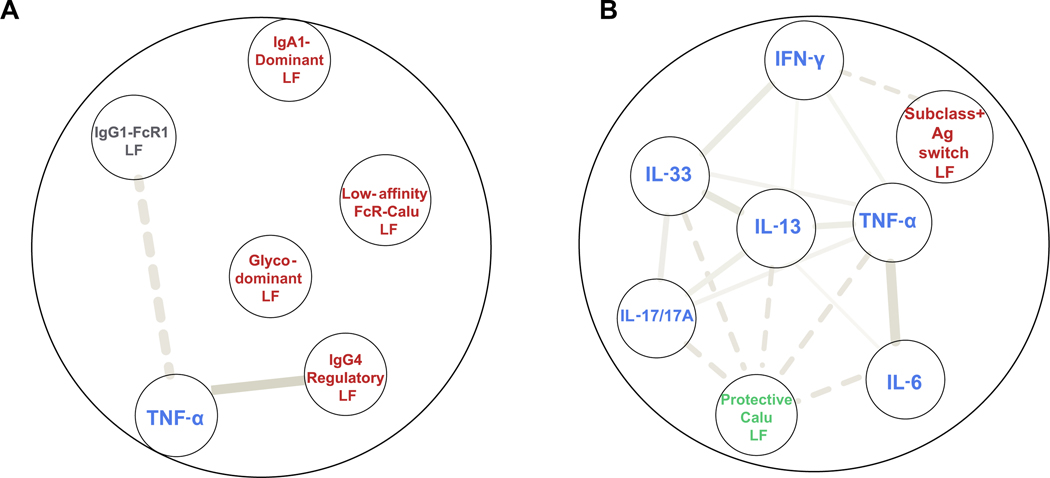
Schistosomiasis, a highly prevalent parasitic disease, affects more than 200 million people worldwide. Current diagnostics based on parasite egg detection in stool detect infection only at a late stage, and current antibody-based tests cannot distinguish past from current infection. Here, we developed and used a multiplexed antibody profiling platform to obtain a comprehensive repertoire of antihelminth humoral profiles including isotype, subclass, Fc receptor (FcR) binding, and glycosylation profiles of antigen-specific antibodies. Using Essential Regression (ER) and SLIDE, interpretable machine learning methods, we identified latent factors (context-specific groups) that move beyond biomarkers and provide insights into the pathophysiology of different stages of schistosome infection. By comparing profiles of infected and healthy individuals, we identified modules with unique humoral signatures of active disease, including hallmark signatures of parasitic infection such as elevated immunoglobulin G4 (IgG4). However, we also captured previously uncharacterized humoral responses including elevated FcR binding and specific antibody glycoforms in patients with active infection, helping distinguish them from those without active infection but with equivalent antibody titers. This signature was validated in an independent cohort. Our approach also uncovered two distinct endotypes, nonpatent infection and prior infection, in those who were not actively infected. Higher amounts of IgG1 and FcR1/FcR3A binding were also found to be likely protective of the transition from nonpatent to active infection. Overall, we unveiled markers for antibody-based diagnostics and latent factors underlying the pathogenesis of schistosome infection. Our results suggest that selective antigen targeting could be useful in early detection, thus controlling infection severity.


Conflict of interest statement

Competing interests: J.D. is a consultant for and holds stock options in Seromyx. The authors declare that they have no other competing interests.

Figures

Fig. 1.
Fig. 1.. Integrative platform to uncover humoral and cellular signatures underlying schistosomiasis disease states and endotypes.
Workflow demonstrating multiplexed antibody profiling coupled to interpretable machine learning to uncover disease signatures and infer corresponding modes of pathogenesis. Serum antibodies were used with barcoded antigen beads and an ER machine learning approach to parse the high-dimensional data. The resulting analysis revealed humoral latent factor (LF) cytokine cross-talk.
Fig. 2.
Fig. 2.. Multivariate antibody responses against Schisto antigens capture humoral signatures (LFs) that discriminate between Egg+ and Egg− individuals.
(A) Polar plots comparing medians of measured antigen-specific humoral features between Egg+ and Egg− individuals. Red bars correspond to Egg+ patients, and blue bars correspond to Egg− patients. (B) Volcano plot identifying the most discriminative features on the basis of univariate analyses. Features higher in the Egg+ individuals are in red. (C) Performance of the real ER model (in purple; AUROC = 0.89) in discriminating between Egg+ and Egg− samples using significant LFs, relative to the distribution of the performance of models built using permuted (shuffled) outcome labels (in green). Model performance was measured in a k-fold cross-validation framework with permutation testing, and the metric used is AUROC. **** indicates P < 0.0001 using the Mann-Whitney U test. (D) Performance of the real ER model (in purple; AUPR = 0.67) in discriminating between Egg+ and Egg− samples using significant LFs, relative to the distribution of the performance of models built using permuted (shuffled) outcome labels (in green). Model performance was measured in a k-fold cross-validation framework with permutation testing, and the metric used is AUPR. **** indicates P < 0.0001 using the Mann-Whitney U test. (E) Significant LFs selected by ER discriminating between Egg+ and Egg− samples. Larger circles in bold represent putative causal LFs. Each LF is named and visualized using a network representation. Edge thickness depicted with solid gray lines indicates positive Spearman correlations; edge thickness depicted with dashed lines indicates negative Spearman correlations between corresponding humoral profiles. Nodes in red indicate humoral features higher in Egg+ samples. Nodes in gray are unchanged between Egg+ and Egg− samples. Calu stands for antigen calumenin-B. (F) Heatmap of log2 mean fold change (pink, up; green, down) of humoral features picked from significant LFs (at a threshold of 0.08 on the allocation matrix) that discriminate between Egg+ and Egg− samples. (G) Schematic showing the method for discriminating between egg status in the validation (Kenyan) cohort using significant LFs captured by ER in the discovery (Brazilian) cohort. (H) ROCs showing ER model performance using significant LFs in (D) to discriminate between Egg+ and Egg− samples in the Kenyan validation cohort (in red) compared with the performance in the Brazilian discovery cohort (in blue).
Fig. 3.
Fig. 3.. ER identifies a unique humoral signature beyond IgG-SmSEA to distinguish active from prior infected samples in endemic areas.
(A) Plot showing IgG-SmSEA titers (measured in MFI) of SEA+Egg+ (active infection), SEA+Egg−, and SEA−Egg− individuals. The cohort is divided into three subgroups on the basis of titers: SEA+Egg+, SEA+Egg−, and SEA−Egg− (MFI < 3000). (B) Performance of the real ER model (in purple; AUROC = 0.85) in discriminating between SEA+Egg+ and SEA+Egg− samples using significant LFs, relative to the distribution of the performance of models built using permuted (shuffled) outcome labels (in green). Model performance was measured in a k-fold cross-validation framework with permutation testing, and the metric used is AUROC. **** indicates P < 0.0001 using the Mann-Whitney U test. (C) Performance of the real ER model (in purple; AUPR ~ 0.62) in discriminating between SEA+Egg+ and SEA+Egg− samples using significant LFs, relative to the distribution of the performance of models built using permuted (shuffled) outcome labels (in green). Model performance was measured in a k-fold cross-validation framework with permutation testing, and the metric used is AUPR. **** indicates P < 0.0001 using the Mann-Whitney U test. (D) Significant LFs identified by ER to distinguish SEA+Egg+ from SEA+Egg− samples. Larger circles in bold represent putative causal LFs that are named and have a Spearman correlation network of nodes comprising ER-selected humoral features. Edge thickness depicted with solid gray lines indicates positive Spearman correlations; edge thickness depicted with dashed lines indicates negative Spearman correlations between corresponding humoral profiles. Nodes in red indicate a higher profile in SEA+Egg+ samples; nodes in gray indicate an unchanged univariate profile between SEA+Egg+ and SEA+Egg− samples. (E) Heatmap of log2 mean fold change (pink, up; green, down) of profiles picked by significant LFs (at a threshold of 0.08 on the allocation matrix) that distinguish SEA+Egg+ and SEA+Egg− samples. (F) PLS-DA using profiles picked by significant LFs in (C) to discriminate between SEA+Egg+ and SEA+Egg− individuals.
Fig. 4.
Fig. 4.. Unsupervised clustering reveals two distinct endotypes within SEA+Egg− individuals, which further stratifies prior infection from patients with active infection and nonpatent patients.
(A) PLS-DA showing the two clusters obtained in SEA+Egg− samples using unsupervised clustering by k-means. The optimal k (k = 2) was obtained using the silhouette index (in fig. S5A). Dots correspond to individuals. Endo A individuals are represented using blue dots, whereas Endo B individuals are represented using orange dots. (B) Performance of the real ER model (in purple; AUROC = 0.94) in discriminating between the two endotypes using significant LFs, relative to the distribution of the performance of models built using permuted (shuffled) outcome labels (in green). Model performance was measured in a k-fold cross-validation framework with permutation testing, and the metric used is AUROC. **** indicates P < 0.0001 using the Mann-Whitney U test. (C) Performance of the real ER model (in purple; AUPR = 0.98) in discriminating between the two endotypes using significant LFs, relative to the distribution of the performance of models built using permuted (shuffled) outcome labels (in green). Model performance was measured in a k-fold cross-validation framework with permutation testing, and the metric used is AUPR. **** indicates P < 0.0001 using the Mann-Whitney U test. (D) Correlation network of humoral profiles picked up in the significant LF (at a threshold of 0.08 on the allocation matrix) identified by the ER model in (B). Nodes in red indicate profiles elevated in Endo B samples. Edge thickness depicted with solid gray lines indicates positive Spearman correlations. (E) Box plot illustrating the separation between Endo A and Endo B samples using the Sm25-dominant, significant LF identified from the ER model in (B). **** indicates P < 0.0001 using the Mann-Whitney U test. The box spans from the first to the third quartile, and the whiskers extend from the first quartile −1.5 interquartile range (IQR) to the third quartile +1.5 IQR. (F) Heatmap of log2 mean fold change (pink, up; green, down) of profiles picked in the significant LF (at a threshold of 0.08 on the allocation matrix) that discriminates between Endo A and Endo B samples. (G) Performance of the ER model (AUROC = 0.85) to discriminate between Endo A and SEA+Egg+ samples built using deep antigen-specific humoral profiles. Model performance was obtained using a k-fold cross-validation framework with permutation testing. **** indicates P < 0.0001 using the Mann-Whitney U test. (H) Performance of the ER model (AUROC = 0.73) to discriminate between Endo B and SEA+ Egg+ samples built using deep antigen-specific humoral profiles. Model performance was obtained using a k-fold cross-validation framework with permutation testing. **** indicates P < 0.0001 using the Mann-Whitney U test. (I) Box plots illustrating a noncanonical trend in log2(MFI) of humoral profiles such as calumenin-specific FcR1 and IgG1, Sm25-specific IgG1 and FcR3A, and MEG-specific IgG. Outliers removed for plotting but not P value calculations. *P < 0.05; ***P < 0.001; ****P < 0.0001; ns, not significant. P values were calculated using the Mann-Whitney U test. For box plots, the box spans from the first to the third quartile, and the whiskers extend from the first quartile −1.5 IQR to the third quartile +1.5 IQR. (J) Box plots illustrating the canonical trend in log2(MFI) of humoral profiles such as IgG4 against SEA and CD63 antigens. Outliers removed for plotting but not P value calculations. *P < 0.05; **P < 0.01; ****P < 0.0001; ns, not significant. P values were calculated using the Mann-Whitney U test. For box plots, the box spans from the first to the third quartile, and the whiskers extend from the first quartile −1.5 IQR to the third quartile +1.5 IQR.
Fig. 5.
Fig. 5.. Serum cytokines indicate a polarization of cellular responses between different phenotypes in schistosomiasis.
(A) Networks demonstrating cross-talk between serum cytokines and two of five discriminative LFs in Egg+ versus Egg− on the basis of Spearman correlations. Solid lines indicate positive correlations, and dashed lines indicate negative correlations. All shown correlations were corrected using the Benjamini-Hochberg method with a confidence level of 0.95. Unconnected nodes indicate correlations under 0.35. (B) Networks demonstrating cross-talk between serum cytokines and both discriminative LFs in Egg+ versus Endo B on the basis of Spearman correlations.

References

    1. McSorley HJ, Maizels RM, Helminth infections and host immune regulation. Clin. Microbiol. Rev 25, 585–608 (2012). - PMC - PubMed
    1. Patel P, Rose CE, Kjetland EF, Downs JA, Mbabazi PS, Sabin K, Chege W, Watts DH, Secor WE, Association of schistosomiasis and HIV infections: A systematic review and meta-analysis. Int. J. Infect. Dis 102, 544–553 (2021). - PMC - PubMed
    1. Borkow G, Weisman Z, Leng Q, Stein M, Kalinkovich A, Wolday D, Bentwich Z, Helminths, human immunodeficiency virus and tuberculosis. Scand. J. Infect. Dis 33, 568–571 (2001). - PubMed
    1. Resende Co T, Hirsch CS, Toossi Z, Dietze R, Ribeiro-Rodrigues R, Intestinal helminth co-infection has a negative impact on both anti-Mycobacterium tuberculosis immunity and clinical response to tuberculosis therapy. Clin. Exp. Immunol 147, 45–52 (2007). - PMC - PubMed
    1. Hartgers FC, Obeng BB, Kruize YCM, Dijkhuis A, McCall M, Sauerwein RW, Luty AJF, Boakye DA, Yazdanbakhsh M, Responses to malarial antigens are altered in helminth-infected children. J. Infect. Dis 199, 1528–1535 (2009). - PubMed

Publication types

LinkOut - more resources