. 2024 Sep 18;16(765):eadk0642.
doi: 10.1126/scitranslmed.adk0642. Epub 2024 Sep 18.

Intratumoral radiation dose heterogeneity augments antitumor immunity in mice and primes responses to checkpoint blockade

Affiliations

Intratumoral radiation dose heterogeneity augments antitumor immunity in mice and primes responses to checkpoint blockade

Justin C Jagodinsky et al. Sci Transl Med. .

Abstract

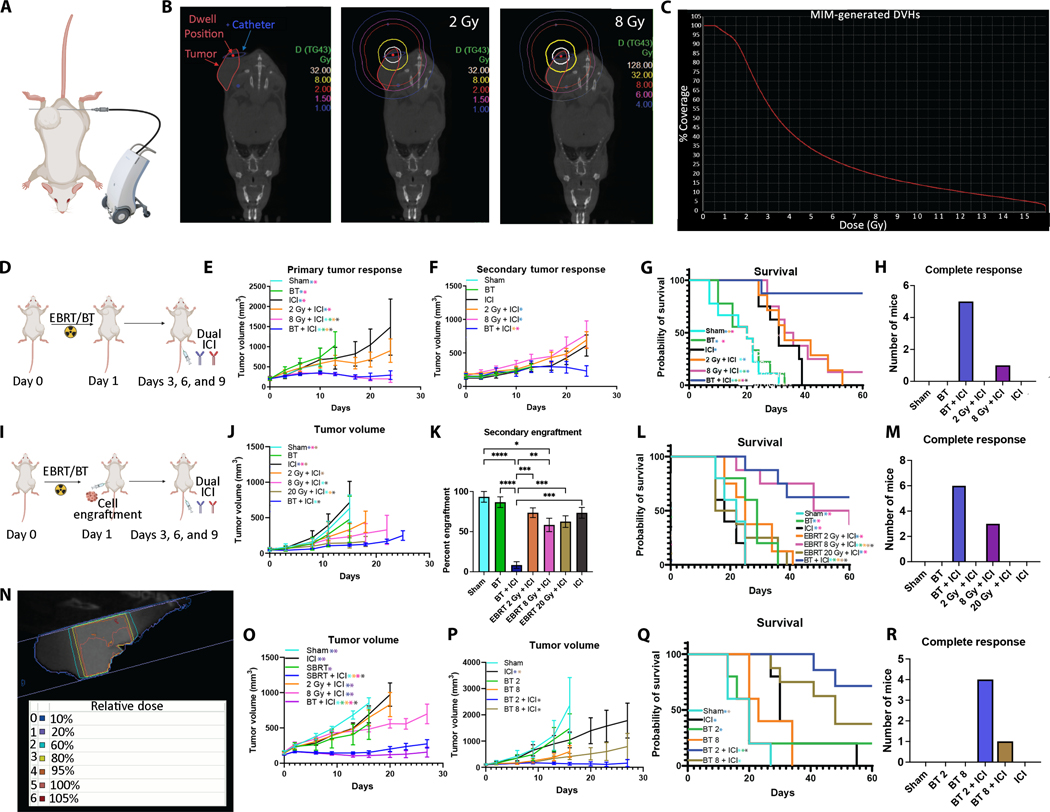
Radiation therapy (RT) activates multiple immunologic effects in the tumor microenvironment (TME), with diverse dose-response relationships observed. We hypothesized that, in contrast with homogeneous RT, a heterogeneous RT dose would simultaneously optimize activation of multiple immunogenic effects in a single TME, resulting in a more effective antitumor immune response. Using high-dose-rate brachytherapy, we treated mice bearing syngeneic tumors with a single fraction of heterogeneous RT at a dose ranging from 2 to 30 gray. When combined with dual immune checkpoint inhibition in murine models, heterogeneous RT generated more potent antitumor responses in distant, nonirradiated tumors compared with any homogeneous dose. The antitumor effect after heterogeneous RT required CD4 and CD8 T cells and low-dose RT to a portion of the tumor. At the 3-day post-RT time point, dose heterogeneity imprinted the targeted TME with spatial differences in immune-related gene expression, antigen presentation, and susceptibility of tumor cells to immune-mediated destruction. At a later 10-day post-RT time point, high-, moderate-, or low-RT-dose regions demonstrated distinct infiltrating immune cell populations. This was associated with an increase in the expression of effector-associated cytokines in circulating CD8 T cells. Consistent with enhanced adaptive immune priming, heterogeneous RT promoted clonal expansion of effector CD8 T cells. These findings illuminate the breadth of dose-dependent effects of RT on the TME and the capacity of heterogeneous RT to promote antitumor immunity when combined with immune checkpoint inhibitors.


Figures

Fig. 1.
Fig. 1.. Radiation dose heterogeneity enhances response to immune checkpoint inhibition.
(A and B) Brachytherapy catheter placement location in distal/caudal tumor edge (A) and treatment plan (B); 2 Gy was delivered to proximal/cranial tumor edge. (C) Dose-volume histogram (DVH) for BT 2-Gy treatment plan showing coverage of tumor volume by dose. (D) Treatment schematic for (E) to (H). Mice with right flank and left shoulder B78 tumors were treated with sham control, BT, ICI alone, EBRT (2 or 8 Gy) + dual ICI (anti–CTLA-4 and anti–PD-L1, 200 μg on days 3, 6, and 9), or BT + ICI. (E and F) Tumor size was measured for primary (E) and secondary (F) tumors. (G and H) Survival was measured for all mice (G), and the number of complete responders (H) was recorded. (I) Treatment schematic for MyC-CaP tumor–bearing mice, including additional injection of 1 × 10⁶ MyC-CaP cells on the left flank immediately after radiation. Secondary engraftment rate was calculated at D14. (J to M) Tumor response by group (J), secondary engraftment frequency (K), animal survival (L), and complete response rate (M) are shown. (N and O) Heterogeneous EBRT studies were performed in B78-bearing mice. SBRT arc beam treatment plan, with approximately 20 Gy delivered to distal edge of tumor and approximately 2 Gy delivered to proximal edge of tumor to mimic BT treatment plan, is shown (N) with tumor response by group (O). (P to R) BT dose escalation studies are shown for mice with a single MyC-CaP flank tumor. Tumor response by group (P), animal survival (Q), and complete response rates (R) are shown. N = 8 to 16 mice per group. Significance was determined by linear mixed effects regression analysis [(E), (F), (J), (O), and (P)] and two-way ANOVA with Tukey multiple comparisons testing (K) for tumor growth or by Kaplan-Meier with log-rank testing for survival analysis [(G), (L), and (Q)]. Significant differences, where P < 0.05, are demarcated by asterisks, with the color of the asterisk representing the group from which the listed group differs.
Fig. 2.
Fig. 2.. Radiation dose heterogeneity imprints spatial heterogeneity in gene expression within a tumor.
(A) B78 flank tumors were treated with BT or sham control. (B) Tattoo ink marking shows the position of the radioactive seed in a BT-treated tumor. (C) Treatment plan schematic demonstrating three EBRT doses used to control for single BT. (D to K) Three days postradiation, tumor tissue was collected for qPCR analysis (N = 5 samples per group) (D) and bulk RNA-seq on individual samples [(E) to (K)]. [(E) to (G)] Differentially expressed gene counts (E), gene set variation analysis (GSVA) differential pathway enrichment–identified numerous KEGG pathways (F), and GO term biological processes (BP) positively enriched in BT-treated samples compared with sham (G). [(H) to (K)] Per gene expression pattern of selected GO terms: cell adhesion (H), cell response to IFN-1 (I), T cell activation (J), and inflammatory response (K), where superscripted H, M, and L indicate FDR < 0.5 for positive differential enrichment of this GO term in BT high, moderate (mod), or low regions, respectively, relative to control sham; superscripted NA indicates GO terms not tested. One-way ANOVA was used to compare qPCR gene expression across radiation doses and dose regions.
Fig. 3.
Fig. 3.. Radiation dose heterogeneity results in spatial heterogeneity in immune cell infiltration and trafficking to TDLNs.
Tumors were collected 3 days postradiation from BT- or sham control–treated B78 tumor–bearing mice for spatial transcriptomics. (A) H&E stain with approximate dose region boundaries are shown on the top left; BayesSpace spatial clusters are shown on the top right; a violin plot of per-spot H2-K1 expression grouped by dose region is shown on the bottom left (*Bonferroni-adjusted FDR < 0.001 by Wilcoxon test comparing high-dose H2-K1 expression to moderate- or low-dose regions); a spline-based negative binomial generalized linear model of H2-K1 expression relative to BT seed distance is shown on the bottom right. (B) Cell type deconvolution of spatial spots grouped by cluster and dose region. Teff, T effector; pDC, plasmacytoid dendritic cell; Tmem, memory T cell. (C) A separate cohort of tumors was collected for multiparameter immunofluorescence microscopy. Arrow indicates tattoo marking radioactive seed position. (D to I) Frequencies of intratumoral CD8 T cells (CD8+) (D), regulatory T cells (Treg; CD4+FOXP3+) (E), B cells (CD19+) (F), macrophages (F4/80+) (G), natural killer cells (CD161+) (H), and myeloid cells (CD11b+) (I) were quantified across dose regions. Percentages shown are frequencies among all CD45+ cells. **P < 0.05 and ****P < 0.0001 by two-way ANOVA with Šidák’s correction for multiple comparisons. (J) Experimental setup of fluorescence tracking approach in Kaede photoconvertible mice. (K) TDLNs were analyzed for DC population abundance. The left shows representative flow cytometry plots. The right shows quantification. Bars represent mean ± SEM, *P < 0.05 by unpaired t test, ns = not significant. Res, resident DC; Mig, migratory DC; UV, ultraviolet; NT, no treatment. N = 4 mice per group.
Fig. 4.
Fig. 4.. Radiation dose influences immune infiltration signature.
B78 tumor–bearing mice were treated with sham control, EBRT + ICI, BT, BT + ICI, or ICI alone. Day 10 postradiation, live CD45+ cells were analyzed by scRNA-seq. (A) UMAP plots of tumor myeloid scRNA-seq data derived from combination treatment groups. (B) Individual cluster abundance analysis is shown relative to sham. (C) Individual cell type identification and abundance by cluster is shown. (D) Cluster abundance overrepresentation by treatment group is shown; * FDR < 1 × 10⁻⁵ and ** FDR < 1 × 10⁻¹⁰ by proportions test. (E) Unique gene hits of BT + ICI differential gene expression analysis are shown for cluster 8. (F) Shown is a comparison of gene expression for pro- and antitumor neutrophil markers. * FDR < 0.05 (G) Classical activation scores are shown by treatment group for monocyte clusters. ****P < 1 × 10⁻¹⁵, ns = not significant using the Wilcoxon rank sum test. (H) JASMINE scores, a signature-scoring method optimized for single-cell cancer datasets, are shown for cluster analysis KEGG pathway positive enrichment hits identified from bulk RNA-seq data displayed in Fig. 2. cGMP-PKG, cyclic guanosine monophosphate-dependent protein kinase Ge; GnRH, gonadotropin-releasing hormone; CoA, coenzyme A.
Fig. 5.
Fig. 5.. Heterogeneous radiation promotes enrichment of TH1 CD4 cells and effector-associated CD8 T cells.
B78 tumor–bearing mice were treated with sham control, EBRT + ICI, BT, BT + ICI, or ICI alone. Day 10 postradiation, live CD45+ cells were analyzed by scRNA-seq. (A) Shown are UMAP plots of tumor lymphoid scRNA-seq data derived from combination treatment groups. (B) Shown is individual cluster abundance analysis relative to sham. (C) Individual cell type identification and abundance by cluster is shown. (D) Cluster abundance overrepresentation is shown by treatment group; * FDR < 1 × 10⁻⁵ and ** FDR < 1 × 10⁻¹⁰ by proportions test. (E) TILPRED abundance of T cell subtypes from (C) and (D) is shown by cluster. (F) Shown is cluster analysis of KEGG pathway positive enrichment hits identified from bulk RNA-seq data displayed in Fig. 2. (G) Differential expression testing of the top 7500 variable genes in lymphoid cell cluster 11 is shown. Tex, terminally exhausted; Tpex, memory-like/ progenitor of exhausted; Tfh, T follicular helper cells.
Fig. 6.
Fig. 6.. CD4 and CD8 T cells are required for antitumor response generated by heterogeneous radiation therapy and immune checkpoint inhibition.
(A) MyC-CaP tumor–bearing mice were treated with sham control, BT, BT + ICI, or ICI alone. Two separate cohorts of mice treated with BT + ICI were depleted of CD4 (αCD4) and CD8 (αCD8) T cells. Secondary engraftment followed immediately post-RT and was quantified on day 14. (B to E) Tumor response by group (B), secondary engraftment (C), animal survival (D), and complete response rates (E) are shown (n = 10 to 16 mice per group). (F) Spleens of a separate group of mice were harvested at day 10 post-RT (early activation) and day 90 post-RT (memory phase). Sorted CD4 and CD8 T cells were cocultured with tumor cells. After 24 hours of coculture, splenocytes were harvested for analysis of T cell activation markers. (G to J) Shown are flow cytometry quantifications for CD4 T cells isolated at the early activation (G) and memory (H) time points and for CD4 T cells isolated at the early activation (I) and memory (J) time points. Significance was determined by linear mixed effects regression analysis and two-way ANOVA with Tukey multiple comparisons testing for tumor growth and Kaplan-Meier with log-rank testing for survival analysis, where significant differences (P < 0.05) are demarcated by asterisks, with the color of the asterisk representing the group from which the listed group differs. One-way ANOVA was used to compare secondary engraftment and expression of T cell markers.
Fig. 7.
Fig. 7.. Radiation dose heterogeneity promotes effector-associated cytokine secretion among circulating CD8 T cells as well as tumor infiltration and clonal expansion of CD8 T cells.
B78 tumor–bearing mice were treated with sham control, EBRT + ICI, BT, BT + ICI, or ICI alone. On day 20, PBMCs were isolated for secretome analysis. (A) Signal intensity of the indicated secreted cytokines is shown. RFU, relative fluorescence units. (B) Shown is the secretion frequency by cytokine. (C) A polyfunctionality heatmap is shown by treatment group. (D) Polyfunctionality score was quantified and is presented by treatment group. (E) PSI is shown by treatment group. (F) Shown is the ratio of stimulatory to regulatory components of the PSI score shown in (E). (G to J) TCR sequencing of RNA extracted from B78 flank tumors of the same cohort of mice was used for Isoplexis analysis; shown are the counts of unique CDR3β sequences (G), the total number of CDR3β sequences (H), the Shannon diversity index (I), and the D50 value (J). n = 3 mice per group. One-way ANOVA with Tukey’s correction for multiple comparisons was used to compare average CDR3 counts [(G) and (H)], diversity index (I), and D50 score (J) across groups.

References

    1. Hodi FS, Chiarion-Sileni V, Gonzalez R, Grob JJ, Rutkowski P, Cowey CL, Lao CD, Schadendorf D, Wagstaff J, Dummer R, Ferrucci PF, Smylie M, Hill A, Hogg D, Marquez-Rodas, Jiang J, Rizzo J, Larkin J, Wolchok JD, Nivolumab plus ipilimumab or nivolumab alone versus ipilimumab alone in advanced melanoma (CheckMate 067): 4-year outcomes of a multicentre, randomised, phase 3 trial. Lancet Oncol. 19, 1480–1492 (2018). - PubMed
    1. Korman AJ, Peggs KS, Allison JP, Checkpoint blockade in cancer immunotherapy. Adv. Immunol 90, 297–339 (2006). - PMC - PubMed
    1. Binnewies M, Roberts EW, Kersten K, Chan V, Fearon DF, Merad M, Coussens LM, Gabrilovich DI, Ostrand-Rosenberg S, Hedrick CC, Vonderheide RH, Pittet MJ, Jain RK, Zou W, Howcroft TK, Woodhouse EC, Weinberg RA, Krummel MF, Understanding the tumor immune microenvironment (TIME) for effective therapy. Nat. Med 24, 541–550 (2018). - PMC - PubMed
    1. Galon J, Bruni D, Approaches to treat immune hot, altered and cold tumours with combination immunotherapies. Nat. Rev. Drug Discov 18, 197–218 (2019). - PubMed
    1. Topalian SL, Hodi FS, Brahmer JR, Gettinger SN, Smith DC, McDermott DF, Powderly JD, Sosman JA, Atkins MB, Leming PD, Spigel DR, Antonia SJ, Drilon A, Wolchok JD, Carvajal RD, McHenry MB, Hosein F, Harbison CT, Grosso JF, Sznol M, Five-year survival and correlates among patients with advanced melanoma, renal cell carcinoma, or non-small cell lung cancer treated with nivolumab. JAMA Oncol. 5, 1411–1420 (2019). - PMC - PubMed

Publication types

Substances