. 2024 Nov 26;8(22):5773-5788.
doi: 10.1182/bloodadvances.2024013699.

Increased CCL2/CCR2 axis promotes tumor progression by increasing M2 macrophages in MYC/BCL2 double-expressor DLBCL

Affiliations

Increased CCL2/CCR2 axis promotes tumor progression by increasing M2 macrophages in MYC/BCL2 double-expressor DLBCL

Sehui Kim et al. Blood Adv. .

Abstract

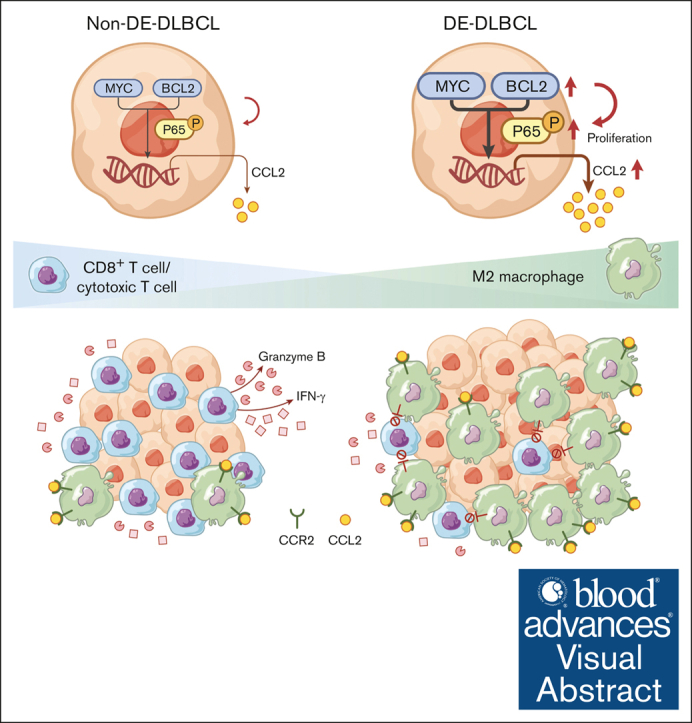
The pathogenesis of myelocytomatosis oncogene (MYC) and B-cell lymphoma 2 (BCL2) double-expressor diffuse large B-cell lymphoma (DE-DLBCL) remains unclear. To investigate how MYC and BCL2 contribute to tumor aggressiveness, we analyzed tumors from 14 patients each with DE-DLBCL and non-DE-DLBCL using whole transcriptome sequencing. Validation was performed using publicly available data sets, tumor tissues from 126 patients, DLBCL cell lines, and a syngeneic mouse lymphoma model. Our transcriptome analysis revealed significantly elevated messenger RNA levels of C-C motif chemokine ligand 2 (CCL2) and C-C chemokine receptor type 2 (CCR2) in DE-DLBCLs when compared with non-DE-DLBCLs (adjusted P value < .05). Transcriptomic analysis of public data sets and immunohistochemistry corroborated these findings, indicating increased levels of M2 macrophages but a reduction in T-cell infiltration in DE-DLBCLs when compared with non-DE-DLBCLs (all P < .05). CCR2 expression was observed mainly in tumor-infiltrating macrophages and not in DLBCL cells. Increased expression of CCL2 and CCR2 was significantly associated with a poor prognosis in patients with DLBCL. In the in vitro analyses, MYChigh/BCL2high DLBCL cells showed higher CCL2 expression and secretion than MYClow/BCL2low cells. MYC and BCL2 increased CCL2 expression and secretion by upregulation of nuclear factor κB p65 in DLBCL cells, and CCL2 promoted M2 polarization of macrophages. In a mouse lymphoma model, CCL2 contributed to the immunosuppressive microenvironment and tumor growth of MYChigh/BCL2high tumors. We demonstrated that the increased CCL2/CCR2 axis confers aggressiveness to DE-DLBCL by increasing M2 polarization and can be a potential therapeutic target.


Conflict of interest statement

Conflict-of-interest disclosure: The authors declare no competing financial interests.

Figures

None
Graphical abstract
Figure 1.
Figure 1.
Analysis of differential gene expression and variances in immune infiltration between DE-DLBCL and non–DE-DLBCL. (A) Gene set enrichment analysis revealed disparate expression patterns of gene sets when DE-DLBCL was compared with non–DE-DLBCL with a false discovery rate (FDR) >0.25. (B) A volcano plot depicting DEGs, highlighting those with an adjusted P (q) value <.05 and fold change (FC) >2. (C) Using publicly available data (Schmitz et al18), immune cell deconvolution was performed using CIBERSORTx. The number of B cells represents the combined abundance of naïve B cells, memory B cells, and plasma cells from the original CIBERSORTx data set. (D) Representative IHC images of immune cells. Immune cells stained for CD3, CD4, CD8, FOXP3, CD68, and CD163 (scale bar, 50 μm). (E) Comparative analysis of the immune cell composition between nodal DE-DLBCL and nodal non–DE-DLBCL using immunohistochemical staining and automated enumeration of immune cells. The Mann-Whitney U test was performed for panels C,E. ∗P < .05; ∗∗P < .01; ∗∗∗P < .001. NK, natural killer.
Figure 2.
Figure 2.
Elevated CCL2 and/or CCR2 mRNA expression trends toward adverse prognosis. Comparative analysis of progression-free survival (PFS) and overall survival (OS) based on the mRNA expression levels of MYC or/and BCL2 using publicly available data sets. (A-F) Schmitz et al, (G-H) GSE117556, and (I) GSE181063. Survival analysis was performed using the Kaplan-Meier method and log-rank test.
Figure 3.
Figure 3.
MYC/BCL2 expression induces CCL2 secretion in human DLBCL cells. (A-B) CCL2 expression in MYChigh/BCL2high OCI-LY8 and DOHH2 cells and in MYClow/BCL2low HT and SUDHL-10 in basal and activated status (20 ng/mL IL-4 + 5 μg/mL IgM) was measured using qRT-PCR, enzyme-linked immunosorbent assay (ELISA), and western blotting. (C-E) MYClow/BCL2low cells were transfected with MYC- and/or BCL2-expression vectors and then subjected to qRT-PCR, western blotting, and immunofluorescence (IF) staining to assess CCL2 expression (scale bar, 10 μm). (F-G) MYClow/BCL2low cells were transfected with MYC- and/or BCL2-expression vectors in the presence or absence of the NF-kB activation inhibitor JSH-23 (20 μM, 24 hours). (H-K) MYChigh/BCL2high cells were treated with bioavailable inhibitors for MYC and BCL2 (10 nM venetoclax, 100 nM JQ-1, and 25 nM fimpinostat for 48 hours) and then subjected to qRT-PCR, ELISA, western blotting, and IF staining to assess the CCL2 expression (scale bar, 10 μm). The data are presented as mean ± standard error of the mean (SEM) of 3 independent experiments. ∗P < .05; ∗∗P < .01; ∗∗∗P < .001. DAPI, 4′,6-diamidino-2-phenylindole; DMSO, dimethyl sulfoxide.
Figure 4.
Figure 4.
Upregulation of MYC/BCL2 in DLBCL cells promotes M2 polarization. The MYChigh/BCL2high cells, OCI-Ly8 and DOHH2, and the MYClow/BCL2low cells, HT and SUDHL-10, were cocultured using 0.4 μm-pore size Transwells with THP-1–derived macrophages that had been differentiated with 200 μg/mL phorbol 12-myristate 13-acetate (PMA) for 24 hours. Comparative analysis of the mRNA and protein expression levels of macrophage differentiation markers in cocultured macrophages was performed using qRT-PCR and flow cytometry, respectively. (A-B) Basal MYChigh/BCL2high and MYClow/BCL2low cells were cocultured with macrophages. (C) HT cells were transfected with MYC- or BCL2-expression vectors and cocultured with macrophages. (D) OCI-LY8 cells were transfected with siRNAs that targeted MYC or Bcl2 and were cocultured with macrophages. The data are presented as mean ± SEM of 3 independent experiments. ∗P < .05; ∗∗P < .01; ∗∗∗P < .001. IFN-γ, interferon gamma; LPS, lipopolysaccharide; MFI, mean fluorescence intensity; n.s., not significant.
Figure 4.
Figure 4.
Upregulation of MYC/BCL2 in DLBCL cells promotes M2 polarization. The MYChigh/BCL2high cells, OCI-Ly8 and DOHH2, and the MYClow/BCL2low cells, HT and SUDHL-10, were cocultured using 0.4 μm-pore size Transwells with THP-1–derived macrophages that had been differentiated with 200 μg/mL phorbol 12-myristate 13-acetate (PMA) for 24 hours. Comparative analysis of the mRNA and protein expression levels of macrophage differentiation markers in cocultured macrophages was performed using qRT-PCR and flow cytometry, respectively. (A-B) Basal MYChigh/BCL2high and MYClow/BCL2low cells were cocultured with macrophages. (C) HT cells were transfected with MYC- or BCL2-expression vectors and cocultured with macrophages. (D) OCI-LY8 cells were transfected with siRNAs that targeted MYC or Bcl2 and were cocultured with macrophages. The data are presented as mean ± SEM of 3 independent experiments. ∗P < .05; ∗∗P < .01; ∗∗∗P < .001. IFN-γ, interferon gamma; LPS, lipopolysaccharide; MFI, mean fluorescence intensity; n.s., not significant.
Figure 5.
Figure 5.
CCL2 secretion from DE-DLBCL cells is crucial for macrophage recruitment and M2 polarization. MYChigh/BCL2high, OCI-Ly8, and DOHH2 cells were cocultured with THP-1–derived macrophages in the absence or presence of anti-CCL2 nAbs. (A) MYChigh/BCL2high cells were cocultured with THP-1–derived macrophages in a Transwell system. Macrophage migration was assessed using a migration assay (scale bar, 250 μm). (B-D) The mRNA and protein expression of macrophage differentiation markers were analyzed using qRT-PCR, IF staining, and flow cytometry (scale bar, 20 μm). The data are presented as mean ± SEM of 3 independent experiments. ∗P < .05; ∗∗P < .01; ∗∗∗P < .001. IFN-γ, interferon gamma; LPS, lipopolysaccharide; MFI, mean fluorescence intensity.
Figure 6.
Figure 6.
CCL2 is required for DE-DLBCL to promote tumor progression and an immunosuppressive TME. (A) MYC- and/or BCL2-stable expressing A20 cells and their phosphorylated p65 and CCL2 expression. (B) Experimental scheme. (C) BALB/c mice were subcutaneously implanted with MYC/BCL2-overexpressing A20 cells or control (con) A20 cells and then IP injected with clodronate or con liposomes as described above. Tumor growth was measured every 2 or 3 days. Tumors were resected 22 days postinjection (d.p.i.). (D) BALB/c mice were subcutaneously implanted with MYC/BCL2-overexpressing A20 cells or control A20 cells and then IP injected with anti-CCL2 nAbs, as described above. At 40 d.p.i, the mice were euthanized, and the tumor weight was measured. Tumor-infiltrating immune cells were analyzed using flow cytometry. The total number of macrophages and their macrophage differentiation markers expression (E), T-cell subsets (F), and IFN-γ or granzyme B producing T cells (G) are shown. Representative images of CD8, granzyme B, and CD206 immunohistochemical staining of tumor tissues (H). The data in the histograms are presented as mean ± SEM of 5 independent experiments. ∗P < .05; ∗∗P < .01; ∗∗∗P < .001. Scale bar, 200 μm. IFN-γ, interferon gamma; iso, isotype control; MFI, mean fluorescence intensity.
Figure 6.
Figure 6.
CCL2 is required for DE-DLBCL to promote tumor progression and an immunosuppressive TME. (A) MYC- and/or BCL2-stable expressing A20 cells and their phosphorylated p65 and CCL2 expression. (B) Experimental scheme. (C) BALB/c mice were subcutaneously implanted with MYC/BCL2-overexpressing A20 cells or control (con) A20 cells and then IP injected with clodronate or con liposomes as described above. Tumor growth was measured every 2 or 3 days. Tumors were resected 22 days postinjection (d.p.i.). (D) BALB/c mice were subcutaneously implanted with MYC/BCL2-overexpressing A20 cells or control A20 cells and then IP injected with anti-CCL2 nAbs, as described above. At 40 d.p.i, the mice were euthanized, and the tumor weight was measured. Tumor-infiltrating immune cells were analyzed using flow cytometry. The total number of macrophages and their macrophage differentiation markers expression (E), T-cell subsets (F), and IFN-γ or granzyme B producing T cells (G) are shown. Representative images of CD8, granzyme B, and CD206 immunohistochemical staining of tumor tissues (H). The data in the histograms are presented as mean ± SEM of 5 independent experiments. ∗P < .05; ∗∗P < .01; ∗∗∗P < .001. Scale bar, 200 μm. IFN-γ, interferon gamma; iso, isotype control; MFI, mean fluorescence intensity.

References

    1. Campo E, Harris NL, Jaffe ES, Pileri SA, Stein H, Thiele J. International Agency for Research on Cancer; 2017. WHO Classification of Tumours of Haematopoietic and Lymphoid Tissues.
    1. Meyer N, Penn LZ. Reflecting on 25 years with MYC. Nat Rev Cancer. 2008;8(12):976–990. - PubMed
    1. Ott G, Rosenwald A, Campo E. Understanding MYC-driven aggressive B-cell lymphomas: pathogenesis and classification. Blood. 2013;122(24):3884–3891. - PubMed
    1. Valera A, López-Guillermo A, Cardesa-Salzmann T, et al. MYC protein expression and genetic alterations have prognostic impact in patients with diffuse large B-cell lymphoma treated with immunochemotherapy. Haematologica. 2013;98(10):1554–1562. - PMC - PubMed
    1. Kaloni D, Diepstraten ST, Strasser A, Kelly GL. BCL-2 protein family: attractive targets for cancer therapy. Apoptosis. 2023;28(1-2):20–38. - PMC - PubMed

Publication types

MeSH terms