. 2025 Jan 14;9(1):101-115.
doi: 10.1182/bloodadvances.2024013723.

Identification of primary mediastinal B-cell lymphomas with higher clonal dominance and poorer outcome using 5'RACE

Affiliations

Identification of primary mediastinal B-cell lymphomas with higher clonal dominance and poorer outcome using 5'RACE

Vincent Camus et al. Blood Adv. .

Abstract

There is a scarcity of data on the tumor B-cell receptor (BCR) repertoire and lymphoid microenvironment in primary mediastinal B-cell lymphoma (PMBL). We applied 5' rapid amplification of complimentary DNA ends (5'RACE) to tumor RNA samples from 137 patients with PMBL with available gene expression profiling and next-generation sequencing data. We obtained 5'RACE results for 75 of the 137 (54.7%) patients with the following clinical characteristics: median age (range), 33 years (18-64); female, 53.3%; performance status score 0 to 1, 86.7%; stage I to II, 57.3%; first-line treatment with anti-CD20 plus doxorubicin-based chemotherapy, 100%. Among the 60 biopsies that expressed a productive BCR, we highlighted a strong somatic hypermutation profile, defined as <98% identity to the germ line sequence, with 58 (96.7%) patients carrying mutated IgVH. We then identified a subgroup of 12 of the 75 patients (16%) with a worse prognosis (progression-free survival [PFS]: hazard ratio [HR], 17; overall survival [OS]: HR, 21) that was associated with the highest clonal dominance (HCD) status, defined as the dominant clonotype representing >81.1% and >78.6% of all complementarity-determining region 3 sequences for IgVH and IgVL, respectively. When compared with other patients, this subgroup had similar clinical characteristics but a greater median allele frequency for all somatic variants, a decreased BCR diversity, and greater expression of PDL1/PDL2 and MS4A1 genes, suggesting greater tumoral infiltration. We confirmed this poorer prognosis in a multivariate model and in an independent validation cohort in which 6 of 37 (16%) PMBL patients exhibited HCD (PFS: HR, 12; OS: HR, 17).


Conflict of interest statement

Conflict-of-interest disclosure: The authors declare no competing financial interests.

Figures

None
Graphical abstract
Figure 1.
Figure 1.
Study flowchart representing the different cohorts of the study based on biologic material availability (RNA set: n = 137; 5′RACE set: n = 75; validation cohort: n = 37).
Figure 2.
Figure 2.
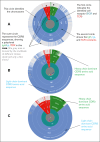
Immunoglobulin and TCR profiles of representative samples (donut charts). The immunoglobulin and TCR sequences are clustered according to the amino acid sequence of CDR3. The BCR or TCR origin (green: IgVH (IgH); blue: IgVL (IgL); red: TCR), identified constant, chromosomal origin, and cluster of identical CDR3 sequences are indicated from the inside to the outside. The 3 samples presented correspond to the 3 different types of 5′RACE results, namely (A) a PMBL case with a polyclonal profile with no dominant clonotype identified. The ratio of B-cell to T-cell (B/T) sequences and the percentage of sequences corresponding to the dominant CDR3s are as follows: B/T ratio, 93.64%; most frequent IgVH CDR3, 0.92%; most frequent IgVL CDR3, 1.48%. (B) A PMBL case with confirmed B-cell clonality, not classified as having the HCD (non-HCD). The clonality threshold was defined as 6.04%; the upper outlier of the distribution of sequencing reads coding the most frequent CDR3 from the heavy and light BCR chains in the absence of tumoral populations. The ratio of B/T sequences and the percentage of sequences corresponding to the dominant CDR3s are as follows: B/T ratio, 94.85%; most frequent IgVH CDR3, 44.74%; most frequent IgVL CDR3, 78.44%. (C) A PMBL case with the HCD in which the dominant clonotype represents >81.1% and >78.6% of all CDR3 sequences for IgVH and IgVL, respectively. The ratio of B/T sequences and the percentage of sequences corresponding to the dominant CDR3s are as follows: B/T ratio, 88.5%; most frequent IgVH CDR3, 93.35%; most frequent IgVL CDR3, 94.42%. HCD, highest clonal dominance.
Figure 3.
Figure 3.
The HCD correlated with poorer outcomes in the PMBL LYSA cohort. (A) PFS and (B) OS according to clonal dominance status (assessed by 5′RACE) in the 5′RACE set from the PMBL LYSA cohort (n = 75). We identified a subset of 12 of 75 patients (16%) with the HCD (cutoffs: dominant clonotype representing >81.1% and >78.6% of all CDR3 sequences for IgVH and IgVL, respectively).
Figure 4.
Figure 4.
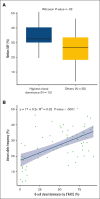
Description of the median VAF determined by NGS and clonal dominance assessed by 5′RACE in patients with available data for both variables (n = 67 in 5′RACE set). (A) Box plot displaying the median VAF comparison between patients with the HCD (n = 12) and others (n = 55). (B) Correlation between the degree of B-cell clonal dominance (defined by the percentage of CDR3 sequences occupied by the dominant clone) according to 5′RACE and the median VAF of somatic variants detected by NGS (5′RACE set).
Figure 5.
Figure 5.
BCR and TCR repertoire diversity in the 2 patient sets. The frequencies of immunoglobulin heavy (H) and light (L) clonotypes are depicted for each sample, along with the contribution of TCR sequences. The samples were sorted based on the percentage of immunodominant clones (IgH + IgL dominant CDR3) and by cohort as follows: the PMBL LYSA cohort (5′RACE set) and the validation cohort. Samples with the HCD as defined by 5′RACE are indicated in red.
Figure 6.
Figure 6.
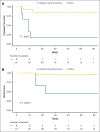
HCD status correlated with poorer outcomes in the independent validation cohort. (A) PFS and (B) OS according to clonal dominance status (HCD vs others, as assessed by 5′RACE) in the independent validation cohort with available 5′RACE results (n = 37/40). We identified a subset of 6 of 37 patients (16.2%) with the HCD (cutoffs: dominant clonotype representing >81.1% and >78.6% of all CDR3 sequences for IgVH and IgVL, respectively).

References

    1. Dunleavy K, Pittaluga S, Maeda LS, et al. Dose-adjusted EPOCH-rituximab therapy in primary mediastinal B-cell lymphoma. N Engl J Med. 2013;368(15):1408–1416. - PMC - PubMed
    1. Camus V, Rossi C, Sesques P, et al. Outcomes after first-line immunochemotherapy for primary mediastinal B-cell lymphoma: a LYSA study. Blood Adv. 2021;5(19):3862–3872. - PMC - PubMed
    1. Savage KJ, Monti S, Kutok JL, et al. The molecular signature of mediastinal large B-cell lymphoma differs from that of other diffuse large B-cell lymphomas and shares features with classical Hodgkin lymphoma. Blood. 2003;102(12):3871–3879. - PubMed
    1. Feuerhake F, Kutok JL, Monti S, et al. NFkappaB activity, function, and target-gene signatures in primary mediastinal large B-cell lymphoma and diffuse large B-cell lymphoma subtypes. Blood. 2005;106(4):1392–1399. - PubMed
    1. Guiter C, Dusanter-Fourt I, Copie-Bergman C, et al. Constitutive STAT6 activation in primary mediastinal large B-cell lymphoma. Blood. 2004;104(2):543–549. - PubMed

Substances