. 2024 Oct:108:105316.
doi: 10.1016/j.ebiom.2024.105316. Epub 2024 Sep 17.

Phosphoproteomics predict response to midostaurin plus chemotherapy in independent cohorts of FLT3-mutated acute myeloid leukaemia

Affiliations

Phosphoproteomics predict response to midostaurin plus chemotherapy in independent cohorts of FLT3-mutated acute myeloid leukaemia

Weronika E Borek et al. EBioMedicine. 2024 Oct.

Abstract

Background: Acute myeloid leukaemia (AML) is a bone marrow malignancy with poor prognosis. One of several treatments for AML is midostaurin combined with intensive chemotherapy (MIC), currently approved for FLT3 mutation-positive (FLT3-MP) AML. However, many patients carrying FLT3 mutations are refractory or experience an early relapse following MIC treatment, and might benefit more from receiving a different treatment. Development of a stratification method that outperforms FLT3 mutational status in predicting MIC response would thus benefit a large number of patients.

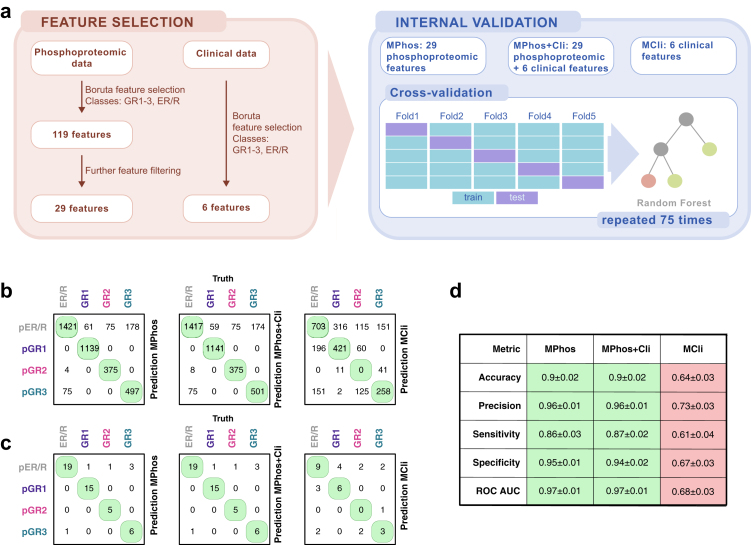
Methods: We employed mass spectrometry phosphoproteomics to analyse 71 diagnosis samples of 47 patients with FLT3-MP AML who subsequently received MIC. We then used machine learning to identify biomarkers of response to MIC, and validated the resulting predictive model in two independent validation cohorts (n = 20).

Findings: We identified three distinct phosphoproteomic AML subtypes amongst long-term survivors. The subtypes showed similar duration of MIC response, but different modulation of AML-implicated pathways, and exhibited distinct, highly-predictive biomarkers of MIC response. Using these biomarkers, we built a phosphoproteomics-based predictive model of MIC response, which we called MPhos. When applied to two retrospective real-world patient test cohorts (n = 20), MPhos predicted MIC response with 83% sensitivity and 100% specificity (log-rank p < 7∗10-5, HR = 0.005 [95% CI: 0-0.31]).

Interpretation: In validation, MPhos outperformed the currently-used FLT3-based stratification method. Our findings have the potential to transform clinical decision-making, and highlight the important role that phosphoproteomics is destined to play in precision oncology.

Funding: This work was funded by Innovate UK grants (application numbers: 22217 and 10054602) and by Kinomica Ltd.

Keywords: Acute myeloid leukaemia; Drug response prediction; Machine learning; Midostaurin plus chemotherapy; Phosphoproteomics; Precision medicine.


Conflict of interest statement

Declaration of interests WEB—is an employee at Kinomica, owns Kinomica share options, Kinomica funded attendance and travel to conferences, named on a Kinomica patent; LN—is an employee at Kinomica, owns Kinomica share options, Kinomica funded attendance and travel to conferences; SFP—is an employee at Kinomica, owns Kinomica share options; AEC—is an employee at Kinomica, owns Kinomica share options, Kinomica funded attendance and travel to conferences; NN—is an employee at Kinomica, owns Kinomica share options, Kinomica funded attendance and travel to conferences; JAC—is an employee at Kinomica, owns Kinomica share options, Kinomica funded attendance and travel to conferences; DNP—is an employee at Kinomica, owns Kinomica share options, Kinomica funded attendance and travel to conferences; PMC—is an employee at Kinomica, owns Kinomica share options, Kinomica funded attendance and travel to conferences; JK—is an employee at Kinomica, owns Kinomica share options; HRF—no conflict of interest; BP—no conflict of interest; PG—no conflict of interest; AA—no conflict of interest; AJA—received a honorarium for speaking engagements from Astellas; AT—received consultant fees from Kinomica for the role of Programme Director; AW—owns Kinomica share options, funded attendance and travel to conferences; GG—no conflict of interest; MDM—no conflict of interest; JGG—Kinomica co-founder, owns Kinomica share options; DJB—co-founder of Kinomica, owns Kinomica share options, named on Kinomica patents, Kinomica funded attendance and travel to conferences, received honoraria from Kinomica in a consulting role; PRC—co-founder and director of Kinomica, owns Kinomica share options, named on Kinomica patents, Kinomica funded attendance and travel to conferences, received honoraria from Kinomica in a consulting role; ADD—is an employee at Kinomica (CTO), named on Kinomica patents, Kinomica funded attendance and travel to conferences owns Kinomica share options.

Figures

Fig. 1
Fig. 1
Clinical features of the training cohort of 47 patients with AML treated atPrincessMargaretCancerCentre (referred to as PMCC-47). (a) Clinical characteristics of the PMCC-47 cohort. R, refractory; ER, early relapse (defined as relapse within 6 months of complete remission); EFS, event-free survival; BM, bone marrow; PB, peripheral blood. (b) Survival analysis of patients with FLT3-MP AML with (NPM1-MP, NPM1 mutation-positive, purple) and without (NPM1-MN, NPM1 mutation-negative, teal) NPM1 mutations. Left: Kaplan–Meier curve. Right: Summary table. HR, hazard ratio; SE, standard error; p, log-rank test. (c) Survival analysis of patients stratified by their levels of FLT3-ITD transcript relative to levels of wild-type FLT3 transcript at diagnosis. Left: Kaplan–Meier curve. Right: Summary table. The FLT3-ITD % transcript for each patient was calculated as follows: FLT3-ITD/(FLT3-WT + FLT3-ITD)∗100%. HR, hazard ratio; ND∗, not determined; SE, standard error; p, log-rank test. (d) Schematic showing steps of phosphoproteomic analysis. Proteins isolated from patient samples were fragmented into peptides by enzymatic digestion, and phosphopeptides were isolated from the digestion mixture. LC-MS/MS and computational analyses were used to identify and quantify phosphopeptides.
Fig. 2
Fig. 2
Latent class analysis identifies three distinct phosphoproteomic subtypes amongst long-term survivors in the PMCC-34 patient cohort. (a) Principal Component Analysis (PCA) of the PMCC-34 cohort, which is a subset of PMCC-47 not including samples from patients with event-free survival between 6 and 24 months, See Figure S1a. (b) PCA of PMCC-34 coloured by three distinct GR groups identified by Latent Class Analysis performed on the entirety of phosphoproteomic data. (c) Immunocytological patient data for the PMCC-34 cohort grouped by response group. ER/R patients were split into R (refractory) and ER (early relapse). (d) Genetic alterations found in the PMCC-34 cohort. ER/R patients were split into R (refractory) and ER (early relapse). (e) Clinical characteristics of phosphoproteomic subtypes. Of note, the number of samples included in individual plots in (e) varies based on data availability for each patient.
Fig. 3
Fig. 3
Pathway and kinase activity analysis reveals distinct pathway activation patterns in GR1-3. (a) Pathway enrichment analysis of weighted PMCC-34, in which the number of samples in each of the four patient groups (ER/R, GR1-3) was down-sampled to create groups of equal size (see Methods)., Selected enriched terms in each GR group vs all other PMCC-34 samples are shown. Low enrichment score (ES) indicates decreased (teal) or increased (purple) abundance of phosphopeptides originating from proteins belonging to a given pathway. Abbreviated terms: [1] Signalling by Rho GTPases, Miro GTPases and RHOBTB3; [2] SUMOylation of DNA damage response and repair proteins (down); [3] SUMOylation of DNA replication proteins; [4] SUMOylation of DNA damage response and repair proteins (up); [5] RUNX1 interacts with co-factors whose precise effect on RUNX1 targets is not known. BCR, B-cell receptor signalling; NHEJ, non-homologous end joining; TCR, T-cell receptor signalling. Full results of this analysis can be found in Supplementary File 1. (b) Selected enriched sites in PMCC-34 phosphoproteomic subtypes. If reported in the literature, the modifying kinase is indicated, together with the amino-acid context of the phosphorylated residue. Sites are coloured to indicate which responder group the site is more likely to show high abundance. GR1, purple; GR2, magenta; GR3, teal. (c) Kinase-Substrate Enrichment Analysis performed on the weighted PMCC-34 dataset. Each responder group is compared to all others weighted PMCC-34 samples. In brackets, the number of quantified substrates is shown. Colour indicates z-scores. p, Kolmogorov–Smirnov test with Benjamini and Hochberg adjustment for multiple comparisons. ∗, p < 0.05; ∗∗, p < 0.01; ∗∗∗, p < 0.001; ∗∗∗∗, p < 0.0001.
Fig. 4
Fig. 4
Phosphomarker-based MPhos predictive model outperforms clinical feature-based MCli model in patient stratification for MICtreatment. (a) Schematic of the process of creating the clinical data- and phosphoproteomic data-based response prediction models. First, features were selected using the Boruta algorithm. Next, for phosphoproteomic data, those that were not compatible with test datasets (see Fig. 5 and Methods) were rejected. This led to identification of 29 phosphomarkers, and 6 clinical features: mutations in CUX1, BCOR or BCORL1, and the presence/absence of HLA-DR, CD117, CD34 and CD14. See also Figure S3c. These were then used to create MPhos, MPhos+Cli and MCli, which were assessed by 75 repeats of 5-fold cross-validation (b and c). Individual (b) and aggregated (c) cross-validation outcomes presented as confusion matrices, detailing the distribution of correct and incorrect predictions across all samples. pER/R, predicted ER/R; pGR1-3, predicted GR1-GR3. (d) Model performance metrics for MPhos, MPhos+Cli and MCli. Colour indicates metrics above (green) or below (red) 85%. ROC AUC, Area Under the Receiver Operating Characteristic Curve.
Fig. 5
Fig. 5
MPhos accurately predicts MIC response in two independent cohorts of patients with FLT3-MP AML. (a) Kaplan–Meier representation of combined survival analysis of two independent cohorts of patients with AML stratified with MPhos. HR, hazard ratio; SE, standard error; ND∗, p, log-rank test. Patients predicted to belong to GR1, GR2 and GR3 groups were pooled into the pGR class. Dashed grey line indicates the 3-month cut-off used to calculate metrics presented in the inset table. (b and c) Distribution of event-free survival (EFS) in MPhos-stratified patients across biobanks (b) and sample types (c). Colours indicate event occurrence (grey) or censored follow up (pink). Shape denotes event type. Dashed grey line indicates the 3 month cut-off used in model performance metrics in (a). Note: boxplots and mean EFS values presented in panels (b) and (c) exclude patients censored before 3 months.

References

    1. Shallis R.M., Wang R., Davidoff A., Ma X., Zeidan A.M. Epidemiology of acute myeloid leukemia: recent progress and enduring challenges. Blood Rev. 2019;36:70–87. - PubMed
    1. Roloff G.W., Odenike O., Bajel A., Wei A.H., Foley N., Uy G.L. Contemporary approach to acute myeloid leukemia therapy in 2022. Am Soc Clin Oncol Educ Book. 2022;42:1–16. - PubMed
    1. Döhner H., Wei A.H., Appelbaum F.R., et al. Diagnosis and management of AML in adults: 2022 recommendations from an international expert panel on behalf of the ELN. Blood. 2022;140(12):1345–1377. - PubMed
    1. Kantarjian H., Kadia T., DiNardo C., et al. Acute myeloid leukemia: current progress and future directions. Blood Cancer J. 2021;11(2):41. - PMC - PubMed
    1. Daver N., Schlenk R.F., Russell N.H., Levis M.J. Targeting FLT3 mutations in AML: review of current knowledge and evidence. Leukemia. 2019;33(2):299–312. - PMC - PubMed

MeSH terms