. 2024 Sep 17;5(9):101728.
doi: 10.1016/j.xcrm.2024.101728.

Targeting NAT10 inhibits osteosarcoma progression via ATF4/ASNS-mediated asparagine biosynthesis

Affiliations

Targeting NAT10 inhibits osteosarcoma progression via ATF4/ASNS-mediated asparagine biosynthesis

Yutong Zou et al. Cell Rep Med. .

Abstract

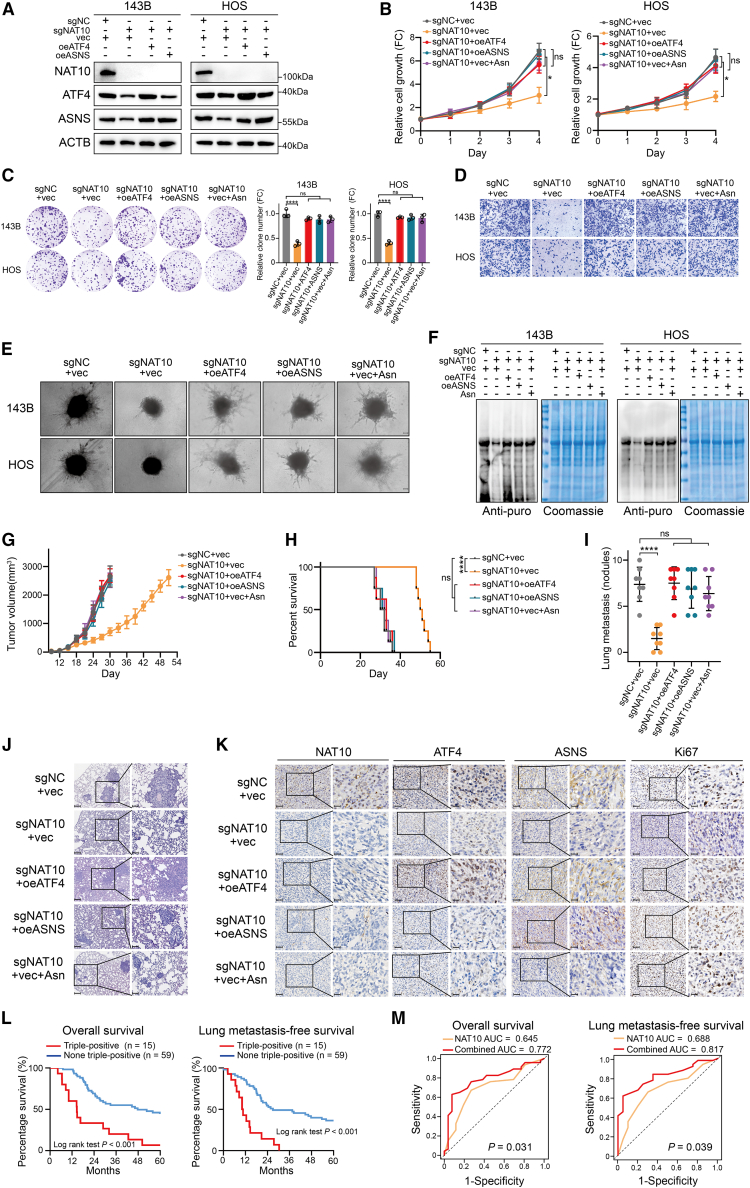
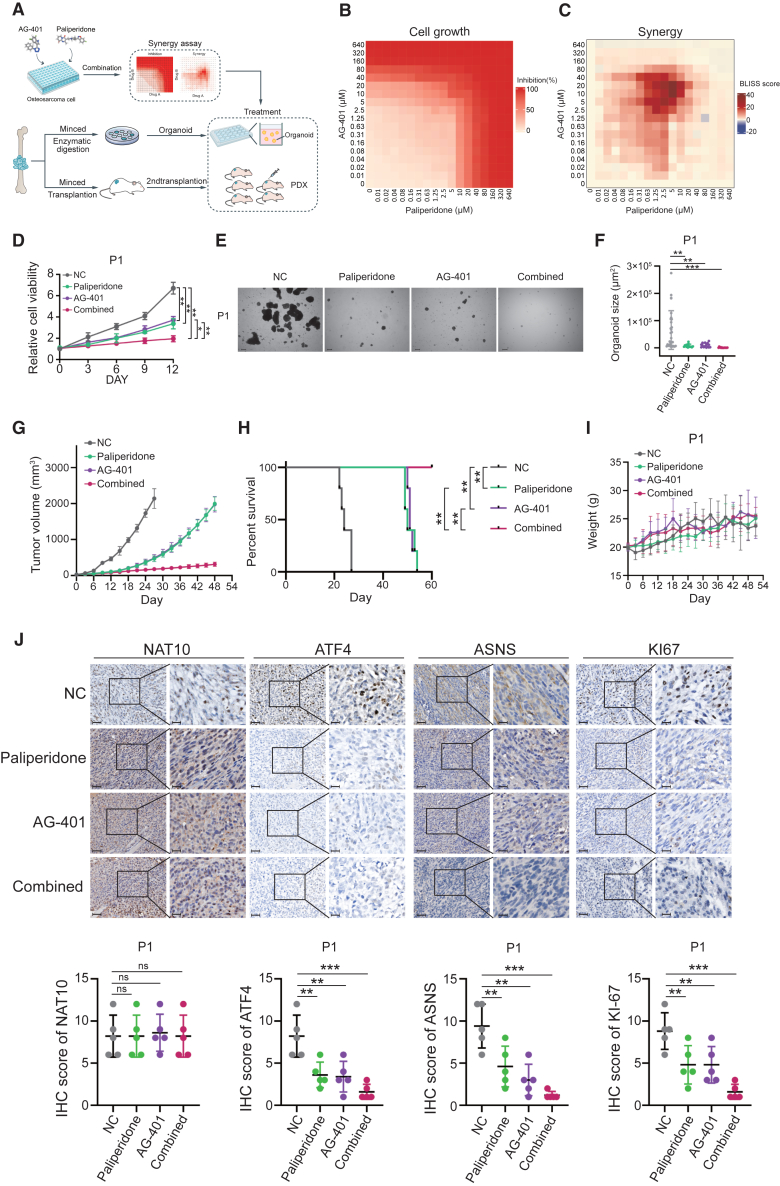
Despite advances in treatment, the prognosis of patients with osteosarcoma remains unsatisfactory, and searching for potential targets is imperative. Here, we identify N4-acetylcytidine (ac4C) acetyltransferase 10 (NAT10) as a candidate therapeutic target in osteosarcoma through functional screening. NAT10 overexpression is correlated with a poor prognosis, and NAT10 knockout inhibits osteosarcoma progression. Mechanistically, NAT10 enhances mRNA stability of activating transcription factor 4 (ATF4) through ac4C modification. ATF4 induces the transcription of asparagine synthetase (ASNS), which catalyzes asparagine (Asn) biosynthesis, facilitating osteosarcoma progression. Utilizing virtual screening, we identify paliperidone and AG-401 as potential NAT10 inhibitors, and both inhibitors are found to bind to NAT10 proteins. Inhibiting NAT10 suppresses osteosarcoma progression in vivo. Combined treatment using paliperidone and AG-401 produces synergistic inhibition for osteosarcoma in patient-derived xenograft (PDX) models. Our findings demonstrate that NAT10 facilitates osteosarcoma progression through the ATF4/ASNS/Asn axis, and pharmacological inhibition of NAT10 may be a feasible therapeutic approach for osteosarcoma.

Keywords: ASNS; ATF4; N4-acetylcytidine; NAT10; asparagine; osteosarcoma.


Conflict of interest statement

Declaration of interests The authors declare no competing interests.

Figures

None
Graphical abstract
Figure 1
Figure 1
NAT10 is a candidate therapeutic target for osteosarcoma and is associated with a poor prognosis in patients with osteosarcoma (A) Diagram depicting RNA-seq combined functional screening to identify candidate therapeutic targets in RNA modification for osteosarcoma. (B and C) MA plot (B) and volcano plot (C) showing the gene expression of osteosarcoma patient samples. Red dots indicate upregulated genes, red dots with borders indicate oncogenes in osteosarcoma, blue dots indicate downregulated genes, and blue dots with borders indicate tumor suppressors in osteosarcoma. Tumor tissues compared to normal tissues. (D) GSEA of RNA modification gene sets in RNA-seq of patients, by permutation test. (E) Top 40 genes from core enriched genes in RNA modification gene sets. (F) Venn diagram showing the intersection between upregulated genes (log2 fold change >1 and adjusted p value <0.05) and the GSEA-derived core enriched genes in the RNA modification pathway. (G and H) Proliferation (G) and migration (H) of RNAi-mediated functional screening targeting 28 genes in GFP+ 143B cells. Red square indicated siNAT10. (I and J) Quantification of proliferation (I) and migration (J) in the functional screen. Red square indicated siNAT10. (K) Dot plot showing the inhibitory efficiency of proliferation and migration of each siRNA. Red dots indicate NAT10 interference with siRNA. (L) NAT10 mRNA expression measured in 20 matched pairs of osteosarcoma and adjacent normal samples by RT-qPCR. (M) NAT10 protein levels measured in 5 matched pairs of osteosarcoma and normal samples (top) and NAT10 expression in osteosarcoma cell lines (bottom) by immunoblotting. (N) mRNA ac4C modification level measured in 5 matched pairs of osteosarcoma and normal samples by dot blot. (O) Representative IHC images showing high or low expression of NAT10 in patient tumor specimens. Scale bars: 50 μm (left), 25 μm (right). (P) Overall survival (left) and LMFS (right) of patients according to the expression levels of NAT10, by log-rank test. (Q) Univariate and multivariate analyses of prognostic factors for overall survival and LMFS among patients with osteosarcoma, by Wald test. Data are presented as the mean ± SD. ∗∗∗∗p < 0.0001, by Student’s t test (L).
Figure 2
Figure 2
NAT10 promotes osteosarcoma proliferation and metastasis in vitro and in vivo (A) Knockout of NAT10 in 143B (left) and HOS (right) cell lines. (B) mRNA ac4C modification level in NAT10 knockdown cells measured by dot blot. (C) Proliferation assay of NAT10-KO 143B (left) or HOS (right) cells (n = 3). (D) Colony formation of NAT10-KO 143B or HOS cells (left). Quantification of colony formation (right) (n = 3). (E) Migration and invasion of NAT10-KO 143B cells (left). Quantification of migration and invasion (right). Scale bar: 100 μm (n = 3). (F) Migration and invasion of NAT10-KO HOS cells (left). Quantification of migration and invasion (right). Scale bar: 100 μm (n = 3). (G) 3D invasion assay of NAT10-KO 143B (top) or HOS (bottom) cells. Scale bar: 100 μm. (H and I) Tumor growth (H) and survival (I) of tibial orthotopic mouse models, by log-rank test (n = 8 per group). (J) Representative H&E images showing lung metastasis nodules of the mouse model. Scale bars: 500 μm (left), 200 μm (right). (K) Quantification of lung metastasis in mouse model (n = 8 per group). (L) Representative IHC images (left) and quantification (right) of IHC showing the expression of NAT10 and Ki-67 in tumors (n = 8 per group). Scale bars: 50 μm (left), 25 μm (right). Data are presented as the mean ± SD. ∗p < 0.05, ∗∗p < 0.01, ∗∗∗p < 0.001, and ∗∗∗∗p < 0.0001, by two-way ANOVA with Dunnett’s multiple comparisons test (C) and one-way ANOVA with Dunnett’s multiple comparisons test (D, E, F, K, and L).
Figure 3
Figure 3
ATF4 is regulated by NAT10 through ac4C modification (A) Volcano plot showing the mRNA expression of NAT10-KO compared to control cells. Red dots indicate upregulated genes (fold change >1.25, adjusted p value <0.05), blue dots indicate downregulated genes (fold change <0.75, adjusted p value <0.05). (B) Gene profiling showing the ac4C modification distribution of NAT10-KO cells compared to that of control cells. (C) Volcano plot showing the ac4C peak of NAT10-KO compared to control cells. Red dots indicate upregulated peaks (fold change >1.25, adjusted p value <0.05), while blue dots indicate downregulated peaks (fold change <0.75, adjusted p value <0.05). (D) Sequence logo of representative motifs within ac4C peaks. (E) Venn diagram showing the intersection between downregulated genes (fold change <0.75, adjusted p value <0.05) and peaks (fold change <0.75, adjusted p value <0.05) of NAT10-KO cells compared to control cells for the 143B and HOS cell lines. (F) Correlation analysis of NAT10 expression with each of the overlapping 9 genes from (E) in the RNA-seq analysis of osteosarcoma patient samples. The red dot represents ATF4. (G) Views of ac4C modification peaks of ATF4 in the 143B cell line from acRIP-seq. (H) GSEA of ATF4 targets in the 143B cell line, by permutation test. (I) RT-qPCR analysis of ATF4 mRNA from RIP by ac4C antibody (143B [left] and HOS [right] cell lines) (n = 3). (J) RT-qPCR analysis of ATF4 mRNA in 143B (left) and HOS (right) cells (n = 3). (K) ATF4 protein levels in NAT10-KO cell lines measured by immunoblotting (143B [left] and HOS [right]). (L) Changes in ATF4 mRNA stability measured by RT-qPCR in the indicated groups. Decay graphs were generated by applying the one-phase decay model. Extra sum-of-squares F test. Half-life time calculated using a linear model (n = 3). (M) Diagram depicting the workflow of detection of ac4C site in ATF4 transcript using chemical reduction method. (N) Sanger sequence detected the ac4C site in ATF4 transcript (C > T misincorporation). (O) Misincorporation rates of ATF4 transcript in control and NAT10-KO cell (n = 3). (P) Dual-luciferase reporter assays of wild-type or mutated ac4C sites ATF4 sequence in NAT10-KO 143B (left) and HOS (right) cells (n = 3). (Q) Sequence of ATF4 in WT and ac4C-MUT group detected by Sanger sequencing. (R) RIP-qPCR analysis of ATF4 mRNA using ac4C antibody in WT and ac4C-MUT group (n = 3). (S) ATF4 mRNA stability measured by RT-qPCR in WT and ac4C-MUT group. Decay graphs were generated by applying the one-phase decay model. Extra sum-of-squares F test. Half-life time calculated using a linear model (n = 3). (T–V) Proliferation (T), colony formation (U), and migration and invasion (V) of WT and ac4C-MUT group, Scale bar: 100 μm (n = 3). Data are presented as the mean ± SD; ns, not significant; ∗p < 0.05, ∗∗p < 0.01, ∗∗∗p < 0.001, and ∗∗∗∗p < 0.0001, by one-way ANOVA with Dunnett’s multiple comparisons test (I, J, and P), with Tukey’s multiple comparisons test (O and R), by two-way ANOVA with Sidak’s multiple comparisons test (T), and by Student’s t test (U).
Figure 4
Figure 4
NAT10 regulates ASNS expression and Asn biosynthesis via ATF4 transcriptional regulation (A) RNA-seq showed that ATF4 target ASNS was downregulated in NAT10-KO 143B (left) and HOS (right) cell lines. (B) ASNS is the enzyme responsible for Asn biosynthesis. (C) ASNS expression in NAT10-KO cell lines by immunoblotting. (D) Asn level in NAT10-KO 143B (top) and HOS (bottom) cells by UHPLC-MS/MS targeted amino acids (n = 3). (E and F) Asn (E) and Asp (F) levels in NAT10-KO 143B (top) and HOS (bottom) cells measured by indicated kit (n = 3). (G) qPCR analysis of ASNS promoter signal from ChIP (using ATF4 antibody) (n = 3). (H) Blot of ASNS promoter ChIP signal (using ATF4 antibody) by PCR and DNA gel electrophoresis. (I) Schematic diagram of the dual-luciferase plasmid. (J) Dual-luciferase reporter assays of ASNS promoter activity in ATF4-KD 143B (left) and HOS (right) cells (n = 3). (K) Protein level of ASNS in ATF4-KD 143B (left) and HOS (right) cells. (L) Asn levels in ATF4-KD 143B (left) and HOS (right) cells measured by ELISA (n = 3). (M) Dual-luciferase reporter assays of ASNS promoter activity of ATF4-OE in NAT10-KO 143B (left) and HOS (right) cells (n = 3). (N) ASNS protein level of ATF4-OE in NAT10-KO 143B (left) and HOS (right) cells. (O) Asn level of ATF4-OE in NAT10-KO 143B (left) and HOS (right) cells measured by ELISA (n = 3). (P–R) Proliferation (P), colony formation (Q), and migration (R) of ATF4-KD 143B and HOS cells. Scale bar: 100 μm (n = 3). (S) ASNS protein levels in ASNS-KO 143B (left) and HOS (right) cells. (T) Diagram depicting the workflow of flux assay across using N15-labeled Asp. (U) N15-labeled Asn amount in ASNS-KO and control cell lines (n = 3). Data are presented as the mean ± SD; ns, not significant; ∗p < 0.05, ∗∗p < 0.01, ∗∗∗p < 0.001, and ∗∗∗∗p < 0.0001, by Student’s t test (G), by one-way ANOVA with Dunnett’s multiple comparisons test (E, F, L, Q, and U), with Tukey’s multiple comparisons test (J, M, and O), and two-way ANOVA with Dunnett’s multiple comparisons test (P).
Figure 5
Figure 5
NAT10 promotes osteosarcoma progression via ATF4/ASNS/Asn in vivo and in vitro (A) Overexpression of ATF4 and ASNS in NAT10-KO 143B (left) and HOS (right) cell lines. (B) Proliferation assay of ATF4-OE, ASNS-OE, and Asn (0.1 mM)-treated NAT10-KO 143B (left) and HOS (right) cells (n = 3). (C–E) Colony formation (C), migration (D), and invasion (E) of ATF4-OE, ASNS-OE, and Asn (0.1 mM)-treated NAT10-KO 143B (left) and HOS (right) cells. Scale bar: 100 μm (n = 3). (F) Global protein synthesis of ATF4-OE, ASNS-OE, and Asn (0.1 mM)-treated NAT10-KO 143B (left) and HOS (right) cells. (G and H) Tumor growth (G) and survival (H) of the ATF4-OE, ASNS-OE, and Asn-treated (0.25 mmol/kg every two days by intraperitoneal injection [i.p.]) mouse models (n = 8 per group), by log-rank test in (H). (I) Quantification of lung metastasis in the mouse model (n = 8 per group). (J) Representative H&E images showing lung metastasis nodules of the mouse model. Scale bars: 500 μm (left), 200 μm (right). (K) Representative IHC images showing the expression of NAT10, ATF4, ASNS, and Ki-67 in the mouse model. Scale bars: 50 μm (left), 25 μm (right). (L) Kaplan-Meier analysis showing overall survival and LMFS curves generated for patients stratified according to the protein levels of NAT10, ATF4, and ASNS, by log-rank test. (M) ROC analysis of three marker combinations (NAT10, ATF4, and ASNS) and NAT10 in OS (left) (combination: AUC = 0.772, NAT10: AUC = 0.645) and LMFS (right) (combination: AUC = 0.817, NAT10: AUC = 0.688) in the osteosarcoma patient cohort, by Venkatraman method test. Data are presented as the mean ± SD; ns, not significant; ∗p < 0.05, ∗∗p < 0.01, ∗∗∗p < 0.001, and ∗∗∗∗p < 0.0001, by one-way ANOVA with Tukey’s multiple comparisons test (C and I) and two-way ANOVA with Tukey’s multiple comparisons test (B).
Figure 6
Figure 6
Structure-based virtual screen identified paliperidone and AG-401 as potential inhibitors of NAT10 (A) Diagram depicting the workflow of screening potential inhibitors of NAT10. (B) Docking score of molecular docking in NAT10 inhibitor screening for FDA-approved drugs and the Specs compound library. (C) mRNA ac4C modification level of 143B cells treated with the top 20 ranked compounds (20 μM, 24 h) from molecular docking by dot blot. (D) ITC assay between NAT10 and paliperidone (left) or NAT10 and AG-401 (right). (E) mRNA ac4C modification level of 143B (left) and HOS (right) cells treated with paliperidone, AG-401, and Remodelin at the indicated concentrations (24 h) by dot blot. (F–I) Proliferation (F), colony formation (G and H), and migration (I) of 143B (left) and HOS (right) cells treated with paliperidone or AG-401 at the indicated concentrations (n = 3). (J) NAT10, ATF4, and ASNS protein levels in 143B (left) and HOS (right) cells treated with paliperidone or AG-401 (24 h) at the indicated concentrations. (K) Asn levels in 143B (left) and HOS (right) cells treated with paliperidone or AG-401 (24 h) at the indicated concentrations (n = 3). (L and M) Tumor growth (L) and survival (M) of the mouse model treated with paliperidone (2 mg/kg daily, i.p.) and AG-401 (5 mg/kg daily, i.p.), by log-rank test in (M) (n = 8 per group). (N) Quantification of mouse lung metastasis in the mouse model (n = 8 per group). (O) Representative H&E images showing lung metastasis nodules of the mouse model. Scale bars: 500 μm (left), 200 μm (right). (P) Representative IHC images showing the expression of NAT10, ATF4, ASNS, and Ki-67 in the mouse model. Scale bars: 50 μm (left), 25 μm (right). Data are presented as the mean ± SD. ∗p < 0.05, ∗∗p < 0.01, ∗∗∗p < 0.001, and ∗∗∗∗p < 0.0001, by one-way ANOVA with Dunnett’s multiple comparisons test (K and N), with Tukey’s multiple comparisons test (G and H), and two-way ANOVA with Dunnett’s multiple comparisons test (F).
Figure 7
Figure 7
Combination of paliperidone and AG-401 inhibited osteosarcoma progression in organoid and PDX models (A) Diagram depicting the workflow of drug synergy assay and establishment of PDX models and organoids. (B and C) Cell viability (B) and Bliss score (C) for paliperidone and AG-401 combined treatment. (D) Cell viability of organoids derived from patient 1 (P1) treated with paliperidone (8 μM), AG-401 (22 μM), or combination (paliperidone: 5 μM, AG-401: 10 μM) (n = 3). (E) Representative images showing organoids derived from patient and treated with paliperidone, AG-401, or combination. Scale bars: 200 μm. (F) Quantification of area of organoids derived from patient 1 (P1) treated with paliperidone, AG-401, or combination.. (G and H) Tumor growth (G) and survival (H) of the PDX model treated with paliperidone (2 mg/kg daily, i.p.), AG-401 (5 mg/kg daily, i.p.), or combination (paliperidone: 1 mg/kg daily, i.p., AG-401: 2.5 mg/kg daily, i.p.) (n = 5 per group). (I) Body weight of the PDX model treated with paliperidone, AG-401, or combination (n = 5 per group). (J) Representative IHC images showing the expression of NAT10, ATF4, ASNS, and Ki-67 in the PDX model. Scale bars: 50 μm (left), 25 μm (right) (n = 5 per group). Data are presented as the mean ± SD. ∗p < 0.05, ∗∗p < 0.01, ∗∗∗p < 0.001, and ∗∗∗∗p < 0.0001, by one-way ANOVA with Dunnett’s multiple comparisons test (F and J), two-way ANOVA with Dunnett’s multiple comparisons test (D), and log-rank tests (H).

References

    1. Whelan J.S., Davis L.E. Osteosarcoma, Chondrosarcoma, and Chordoma. J. Clin. Oncol. 2018;36:188–193. doi: 10.1200/jco.2017.75.1743. - DOI - PubMed
    1. Zheng R., Zhang S., Zeng H., Wang S., Sun K., Chen R., Li L., Wei W., He J. Cancer incidence and mortality in China, 2016. J. Natl. Cancer Cent. 2022;2:1–9. doi: 10.1016/j.jncc.2022.02.002. - DOI - PMC - PubMed
    1. Belayneh R., Fourman M.S., Bhogal S., Weiss K.R. Update on Osteosarcoma. Curr. Oncol. Rep. 2021;23:71. doi: 10.1007/s11912-021-01053-7. - DOI - PubMed
    1. Daw N.C., Chou A.J., Jaffe N., Rao B.N., Billups C.A., Rodriguez-Galindo C., Meyers P.A., Huh W.W. Recurrent osteosarcoma with a single pulmonary metastasis: a multi-institutional review. Br. J. Cancer. 2015;112:278–282. doi: 10.1038/bjc.2014.585. - DOI - PMC - PubMed
    1. Crompton J.G., Ogura K., Bernthal N.M., Kawai A., Eilber F.C. Local Control of Soft Tissue and Bone Sarcomas. J. Clin. Oncol. 2018;36:111–117. doi: 10.1200/jco.2017.75.2717. - DOI - PubMed

MeSH terms