. 2024 Sep 17;5(9):101734.
doi: 10.1016/j.xcrm.2024.101734.

Glycan-specific IgM is critical for human immunity to Staphylococcus aureus

Affiliations

Glycan-specific IgM is critical for human immunity to Staphylococcus aureus

Astrid Hendriks et al. Cell Rep Med. .

Abstract

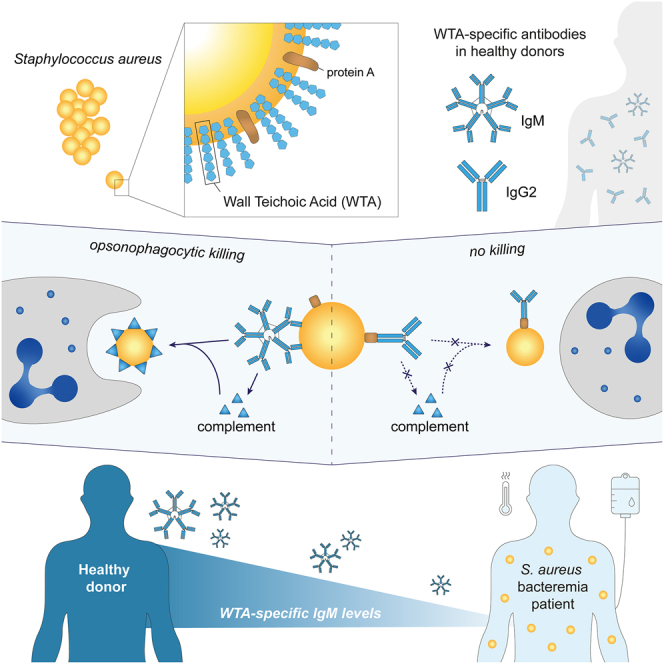
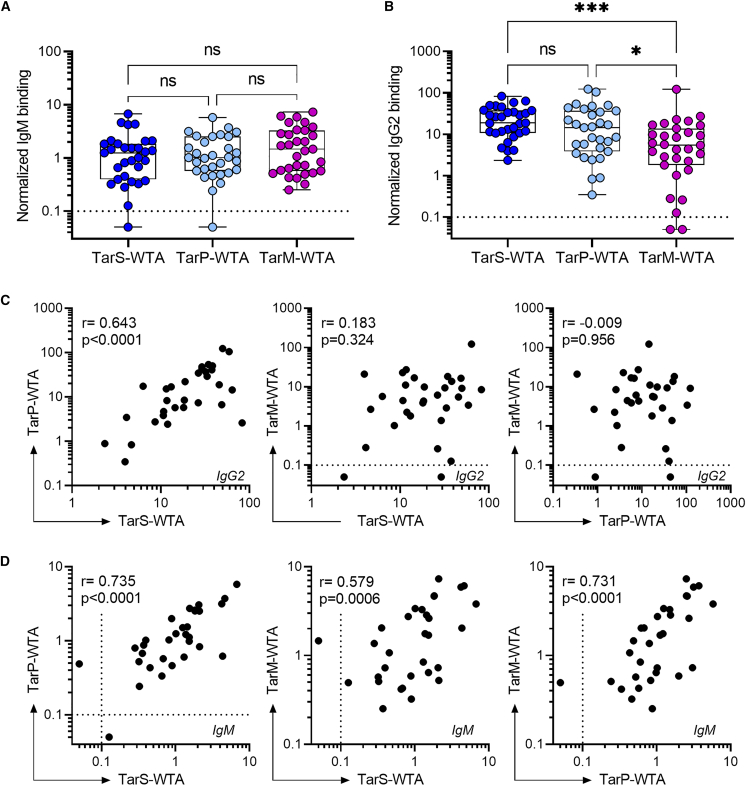
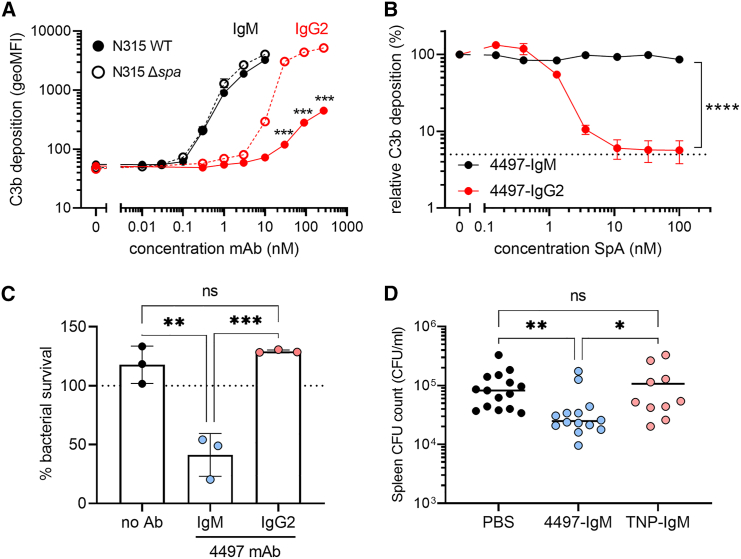
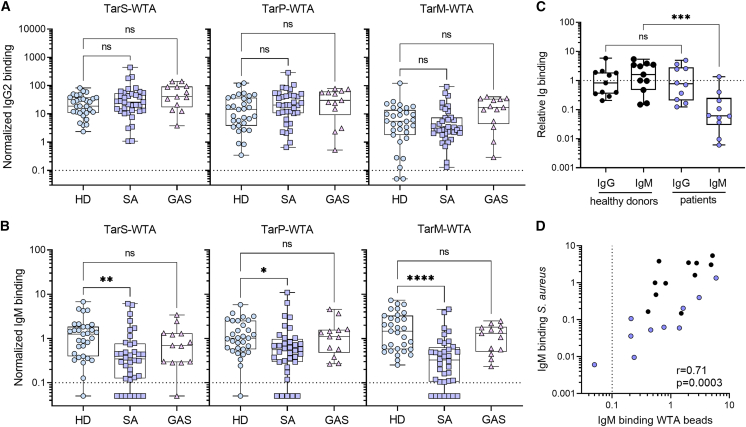
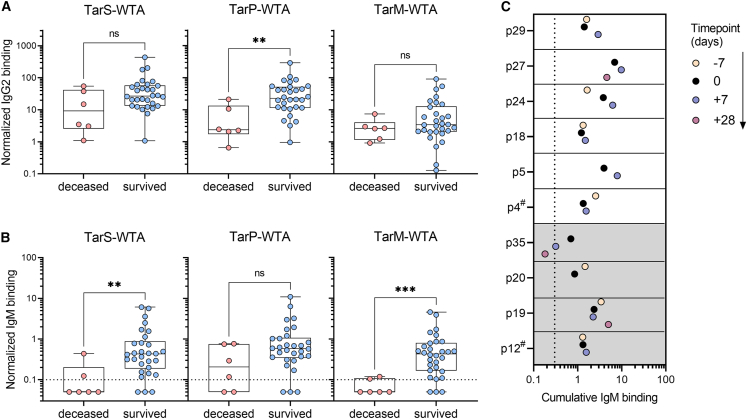
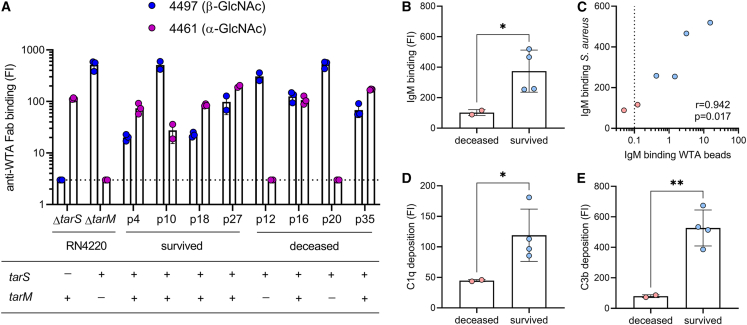
Staphylococcus aureus is a major human pathogen, yet the immune factors that protect against infection remain elusive. High titers of opsonic IgG antibodies, achieved in preclinical animal immunization studies, have consistently failed to provide protection in humans. Here, we investigate antibody responses to the conserved S. aureus surface glycan wall teichoic acid (WTA) and detect the presence of WTA-specific IgM and IgG antibodies in the plasma of healthy individuals. Functionally, WTA-specific IgM outperforms IgG in opsonophagocytic killing of S. aureus and protects against disseminated S. aureus bacteremia through passive immunization. In a clinical setting, patients with S. aureus bacteremia have significantly lower WTA-specific IgM but similar IgG levels compared to healthy controls. Importantly, low WTA-IgM levels correlate with disease mortality and impaired bacterial opsonization. Our findings may guide risk stratification of hospitalized patients and inform future design of antibody-based therapies and vaccines against serious S. aureus infection.

Keywords: IgM; Staphylococcus aureus; WTA; antibody; bacteremia; glycan; opsonic; protective immunity; protein A; wall teichoic acid.


Conflict of interest statement

Declaration of interests The authors declare no competing interests.

Figures

None
Graphical abstract
Figure 1
Figure 1
IgM and IgG2 antibody responses against three WTA glycotypes in healthy subjects (A and B) Normalized binding of (A) IgM and (B) IgG2 to beads coated with TarS-WTA, TarP-WTA, and TarM-WTA in plasma from healthy donors (n = 31). Boxplots extend from the 25th to 75th percentiles,the line represents the median, and the whiskers indicate the total range. Differences in antibody responses to the three WTA glycotypes were analyzed with Kruskal-Wallis test with Dunn’s correction. (C, D) Spearman correlations between binding of (C) IgG2 and (D) IgM reactivity toward distinct WTA glycotypes within individual donors. Each dot represents an individual donor (n = 31). Dotted line represents the lower limit of quantification, symbols shown below this line represent extrapolated values. ∗p < 0.05, ∗∗∗p < 0.001. See also Figure S2.
Figure 2
Figure 2
WTA-specific IgM supports immune-mediated clearance of S. aureus in vitro and in mouse infection experiments (A) Complement C3b deposition on S. aureus N315 wild-type (WT) or staphylococcal protein A-deficient (Δspa) bacteria, pre-opsonized with 4497-IgG2 (0.3–270 nM) or 4497-IgM (0.01–10 nM). Error bars indicate SD of the mean of biological triplicates. Multiple unpaired t tests with Holm-Šídák correction were used to compare antibody-mediated C3b deposition on N315 WT and Δspa for either IgM or IgG2. (B) Relative complement C3b deposition on SpA-deficient S. aureus (Newman Δspa/sbi), pre-opsonized with 4497-IgG2 (10 nM) or 4497-IgM (1 nM) in presence of recombinant protein A (SpA, 0.15–100 nM). C3b deposition in the absence of SpA was set at 100%; the dotted line represents background C3b deposition without antibody opsonization. Error bars indicate SEM of the mean of biological triplicates. Differences between 4497-IgM and 4497-IgG2 were assessed using a two-way ANOVA with Šídák correction. (C) Neutrophil opsonophagocytic killing (OPK) of S. aureus N315 WT, in presence of 10 nM 4497-IgM, 10 nM 4497-IgG2, or no antibody control. Bacterial survival has been normalized over inoculum (dotted line at 100%); data are shown from three independent donors (mean + SD). Statistical analysis was performed using a one-way ANOVA with Tukey correction. (D) Spleen CFU counts from mice (n = 10–15 per group) at 24 h post infection with S. aureus N315 WT, passively immunized with 30 μg 4497-IgM, anti-TNP-IgM, or PBS control. Data were pooled from three independent experiments. Statistical analysis was performed using a Kruskal-Wallis test with Dunn’s correction. ns, non-significant, ∗p < 0.05, ∗∗p < 0.01, ∗∗∗p < 0.001, ∗∗∗∗p < 0.0001. See also Figure S3.
Figure 3
Figure 3
Patients with S. aureus bacteremia display reduced WTA-specific IgM antibody levels (A and B) Normalized binding of (A) IgG2 and (B) IgM to beads coated with TarS-WTA, TarP-WTA, and TarM-WTA. Boxplots represent data for healthy donors (HD, n = 31) and ICU patients with S. aureus (SA, n = 36) or S. pyogenes (GAS, n = 13) bacteremia and extend from the 25th to 75th percentiles. The line inside the box represents the median, whiskers indicate the total range with symbols representing individual donors. Statistical analysis was performed using a Kruskal-Wallis test with Dunn’s multiple comparison test to compare both patient cohorts with healthy donors. (C) IgG and IgM binding to S. aureus strain Newman Δspa/sbi in sera from healthy donors (n = 11) and patients with S. aureus infection (n = 10), defined as relative binding compared to pooled human serum. Statistical analysis was performed using a Mann-Whitney test, to compare either IgG or IgM binding between healthy donors and patients. (D) Spearman correlation between IgM binding to Newman Δspa/sbi and cumulative IgM binding to TarS- and TarM-WTA beads; patients (n = 10) are shown in blue and healthy donors (n = 11) in black. Dotted line represents the lower limit of quantification and symbols shown below the line represent extrapolated values. ns, non-significant, ∗p < 0.05, ∗∗p < 0.01, ∗∗∗∗p < 0.0001. See also Figure S4.
Figure 4
Figure 4
Association between longitudinal WTA-specific antibody responses and ICU mortality in patients with S. aureus bacteremia (A and B) Normalized binding of plasma-derived WTA-specific (A) IgG2 and (B) IgM according to the three WTA glycotypes from ICU patients with S. aureus bacteremia, stratified by ICU mortality. Boxplots extend from the 25th to 75th percentiles, and whiskers represent the total range. Symbols indicate individual patients with S. aureus infection (n = 36). Statistical analysis was performed using a Mann-Whitney test. (C) Cumulative IgM binding for the three WTA glycotypes (TarS-, TarP-, and TarM-WTA) in longitudinal plasma samples (in days from positive blood culture) for ten patients with S. aureus bacteremia. Plasma samples at time point zero coincides with plasma samples shown in Figures 3A/B and 4A/B. The shading indicates patients that died in the ICU (p12, p19, p20, and p35). # refers to a different timing of sample acquisition (not −7 days). Dotted line represents the lower limit of quantification and symbols shown below the line represent extrapolated values. See also Figure S5. ns, non-significant, ∗p < 0.05, ∗∗p < 0.01.
Figure 5
Figure 5
Complement deposition on S. aureus by WTA glycoprofile-specific IgM is reduced in ICU patients that succumbed to S. aureus bacteremia (A) Expression of β-GlcNAc-WTA (Fab clone 4497) and α-GlcNAc-WTA (Fab clone 4461) by clinical isolates from eight patients (survived patients: p4, p10, p18, p27; deceased patients: p12, p16, p20, p35) and reference strains RN4220 ΔtarS and ΔtarM. Below the corresponding WTA glycosyltransferase genotypes (tarS, tarM) as determined by PCR analysis. The dotted line indicates background staining. (B) IgM binding to S. aureus strain Newman Δspa/sbi in 1% plasma from six patients infected with a tarS+tarM+S. aureus isolate (as shown in A), stratified on ICU mortality. (C) Spearman correlation between IgM binding to S. aureus (shown in A) and cumulative IgM binding to TarS-WTA and TarM-WTA beads in six patients, with deceased patients shown in red and survived patients in blue. Dotted line represents the lower limit of quantification and symbols shown below the line represent extrapolated values. (D and E) Deposition of (d) C1q and (e) C3b on Newman Δspa/sbi, pre-opsonized with 3% patient plasma, stratified on ICU mortality. Anti-WTA Fab staining, deposition of IgM, C1q and C3b on S. aureus bacteria is depicted as geometric mean fluorescence intensity (FI) (mean + SD of biological duplicates or triplicates), each symbol indicates individual patients. Statistical analysis for C, D, and E was performed using unpaired t tests with Welch correction. ∗p < 0.05, ∗∗p < 0.01. See also Figure S6.

References

    1. Bergin S.P., Holland T.L., Fowler V.G., Jr., Tong S.Y.C. Bacteremia, Sepsis, and Infective Endocarditis Associated with Staphylococcus aureus. Curr. Top. Microbiol. Immunol. 2017;409:263–296. doi: 10.1007/82_2015_5001. - DOI - PubMed
    1. Antimicrobial Resistance Collaborators Global burden of bacterial antimicrobial resistance in 2019: a systematic analysis. Lancet. 2022;399:629–655. doi: 10.1016/S0140-6736(21)02724-0. - DOI - PMC - PubMed
    1. Spaan A.N., Surewaard B.G.J., Nijland R., van Strijp J.A.G. Neutrophils versus Staphylococcus aureus: a biological tug of war. Annu. Rev. Microbiol. 2013;67:629–650. doi: 10.1146/annurev-micro-092412-155746. - DOI - PubMed
    1. Rigby K.M., DeLeo F.R. Neutrophils in innate host defense against Staphylococcus aureus infections. Semin. Immunopathol. 2012;34:237–259. doi: 10.1007/s00281-011-0295-3. - DOI - PMC - PubMed
    1. Boero E., Brinkman I., Juliet T., van Yperen E., van Strijp J.A.G., Rooijakkers S.H.M., van Kessel K.P.M. Use of Flow Cytometry to Evaluate Phagocytosis of Staphylococcus aureus by Human Neutrophils. Front. Immunol. 2021;12 doi: 10.3389/fimmu.2021.635825. - DOI - PMC - PubMed

MeSH terms