. 2024 Oct 9;32(10):1805-1821.e10.
doi: 10.1016/j.chom.2024.08.013. Epub 2024 Sep 17.

Microbiota regulates neonatal disease tolerance to virus-evoked necrotizing enterocolitis by shaping the STAT1-NLRC5 axis in the intestinal epithelium

Affiliations

Microbiota regulates neonatal disease tolerance to virus-evoked necrotizing enterocolitis by shaping the STAT1-NLRC5 axis in the intestinal epithelium

Saravanan Subramanian et al. Cell Host Microbe. .

Abstract

Microbiota and feeding modes influence the susceptibility of premature newborns to necrotizing enterocolitis (NEC) through mechanisms that remain unknown. Here, we show that microbiota colonization facilitated by breastmilk feeding promotes NOD-like receptor family CARD domain containing 5 (Nlrc5) gene expression in mouse intestinal epithelial cells (IECs). Notably, inducible knockout of the Nlrc5 gene in IECs predisposes neonatal mice to NEC-like injury in the small intestine upon viral inflammation in an NK1.1+ cell-dependent manner. By contrast, formula feeding enhances neonatal gut colonization with environment-derived tilivalline-producing Klebsiella spp. Remarkably, tilivalline disrupts microbiota-activated STAT1 signaling that controls Nlrc5 gene expression in IECs through a PPAR-γ-mediated mechanism. Consequently, this dysregulation hinders the resistance of neonatal intestinal epithelium to self-NK1.1+ cell cytotoxicity upon virus infection/colonization, promoting NEC development. Together, we discover the underappreciated role of intestinal microbiota colonization in shaping a disease tolerance program to viral inflammation and elucidate the mechanisms impacting NEC development in neonates.

Keywords: Early life microbiota colonization; NLRC5; PPAR-γ; STAT1; autoimmunity; breastmilk feeding and formula feeding; intestinal epithelial cells; necrotizing enterocolitis; tilivalline-producing Klebsiella spp.; viral inflammation and NK cell cytotoxicity.


Conflict of interest statement

Declaration of interests The authors declare no competing interests.

Figures

Figure 1.
Figure 1.. FF breaks neonatal gut disease tolerance to viral inflammation.
(A) Experimental design for Postnatal Feeding + R837 model. R837 (25 μg/g, gavage). (B-D) Histological images (B), histological grading of intestinal injury (C), and body weight measurement (D) at 24 h after indicated treatment (n = 9–14/group). (E) The intestinal permeability to gavaged fluorescein isothiocyanate (FITC)-dextran [FD]-10S (n=6/group). (F) 24-h survival rate after R837 or Vehicle treatment (n = 9–19/group). (G) Experimental design for Postnatal Feeding + WU23 model. WU23 (5×10⁸ TCID50 units by gavaging for BF and HMF pups; 5×10⁷ TCID50 units by gavaging for FF pups). (H-J) Histological images (H), histological grading of intestinal injury (I), and body weight measurement (J) at 4 days post-infection (dpi) with WU23 or mock-treatment (n = 10–15/group). Panels of A and G were created with BioRender.com. Representative histological images depict H&E-stained small intestinal tissue sections (B and H). Dashed line indicates the cut-off point for histologic grade of NEC (C and I). Data summarize three (E) and five (B-D, F, and H-J) independent experiments. Data are mean ± SD (C-E, I, and J). 2-way ANOVA with Tukey posttest (D, E, and J), Log-rank test (F), and χ2 test (C and I). Scale bars, 100 μm (B and H). *P < 0.05, ****P < 0.0001.
Figure 2.
Figure 2.. FF promotes colonization of environment-derived KoSCTV+ in the small intestine of neonates.
(A) Strategy for depleting Gram-negative bacteria by gavaging a cocktail of antibiotics (Abx) containing aztreonam and colistin (100 – 140 μg/pup/feeding, 4-h interval between P7 and P11) and inducing the viral inflammation by gavage-treatment with R837 (25 μg/g). (B-E) Histological images (B), histological grading of intestinal injury (C), body weight measurement (D), and survival rate of pups at 24 h (E) after treatment with or without R837 (25 μg/g, gavage) (n = 5–9/group). (F) Experimental design to generate small intestinal tissues from P2 pups for 16S rRNA sequencing. (G-U) Normalized OTUs/106 bacteria count for Klebsiella spp. (G) and identified species belonging to KoSC (H-K), KpSC (L-P), and species not in KoSC and KpSC (Q-U) in small intestine samples of P2 cohorts (n = 4/group). (V) Strategy for executing indicated postnatal feeding interventions. (W) PCR analysis of npsB gene in the small intestinal lumen contents from indicated cohorts/postnatal age (n = 6/group) and milk sources including human donor milk (HM) and formula milk (FM) (n = 3/group). (X) Spectrum profile of TV in water and in feces detected by UPLC-MS/MS assay. (Y and Z) UPLC-MS/MS analysis of TV levels in small intestinal lumen contents (Y, n = 6/group) and serum samples (Z, n = 5/group) of P2 and P10 cohorts. Panels of A, F, and V were created with BioRender.com. Representative histological images depict H&E-stained small intestinal tissue sections (B). Dashed line indicates the cut-off point for histologic grade of NEC (C). Data summarize two (G-U and W-Z), and four (B-E) independent experiments and data are mean ± SD (C, D, G-U, Y, and Z). 1-way ANOVA with Tukey posttest (G-U, Y, and Z), 2-way ANOVA with Tukey posttest (D), Log-rank test (E), and χ2 test (C). Scale bars, 100 μm (B). *P < 0.05, **P<0.01, ***P<0.001, ****P<0.0001.
Figure 3.
Figure 3.. TV mediates the effect of FF on breakdown of disease tolerance to viral inflammation in the small intestine of neonates.
(A) Strategy for gavage-treatment of BF pups with indicated K. oxytoca strains (1 ×10⁸ CFU/pup/two times a day [b.i.d.]) combined with induction of viral inflammation by gavaging with 25 μg/g of R837. (B-D) Histological images (B), histological grading of intestinal injury (C), and body weight measurement (D) of BF mouse pups (P7–P11) colonized with indicated K. oxytoca strains (1×10⁸ CFU/pup/b.i.d.) at 24 h after gavage-treatment with or without R837 (n = 9 – 12/group). (E) Strategy for gavage-treatment of BF pups with indicated K. oxytoca strains (1 ×10⁸ CFU/pup/b.i.d.) combined with induction of viral inflammation by gavaging with 5×10⁸ TCID50 units of WU23. (F-H) Histological images (F), histological grading of intestinal injury (G), and body weight measurement (H) of BF mouse pups colonized with specified K. oxytoca strain at 4 days after gavage-treatment with or without WU23. n = 6 – 10/group. (I) Strategy for determining effect of TV treatment on disease tolerance of BF mouse pups to NEC upon R837-induced viral inflammation. (J-L) Histological images (J), histological grading of intestinal injury (K), and body weight measurement (L) of TV (20 μg/pup/feeding in 4 h intervals between P9 and P10)-pretreated BF mouse pups at 24 h after gavage-treatment with or without R837 (n = 5 – 7/group). Panels of A, E, and I were created with BioRender.com. Representative histological images depict H&E-stained small intestinal tissue sections (B, F, and J). Dashed line indicates the cut-off point for histologic grade of NEC (C, G, and K). Data summarize two (J-L), three (F-H) and four (B-D) independent experiments. Data are mean ± SD (C, D, G, H, K and L). 2-way ANOVA with Tukey posttest (D and H), Student’s t-test (L), and χ2 test (C, G and K). Scale bar, 100 μm (B, F, and J). **P < 0.01, ***P < 0.001, ****P<0.0001.
Figure 4.
Figure 4.. K. oxytocaTV+ and TV prime the neonatal small intestine for autologous NK1.1+ cell-mediated injury during viral inflammation.
(A and B) Representative flow cytometry (A) and aggregate results (B) for assessment of NK1.1+ cells (CD45+CD11b+CD3NK1.1+) in the small intestine of indicated P11 mouse pups at 24 h after treatment with or without R837 (n = 6/group). (C) Representative immunofluorescent images of NK cells (CD56+) in indicated human neonatal small intestinal samples (n = 5/group). (D) Experimental design associated with data in E-G panels. (E-G) Histological images (E), body weight measurement (F), and histological grading of intestinal injury (G) of mouse pups at 24 h after gavage-treatment with or without R837 (n = 6–11/group). H, Experimental design associated with data in I-K panels. (I-K) Histological images (I), histological grading of intestinal injury (J), and body weight measurement (K) of mouse pups at 24 h after gavage-treatment with or without R837 (n = 6/group). (L) Experimental design associated with data in M-O panels. (M-O) Histological images (M), histological grading of intestinal injury (N), and body weight measurement (O) of mouse pups from the indicated groups at 24 h after gavage-treatment with or without R837 (n = 6/group). Panels of D, H, and L were created with BioRender.com. Representative histological images depict H&E-stained small intestinal tissue sections (E, I, and M). Dashed line indicates the cut-off point for histologic grade of NEC (G, J, and N). Data summarize two (A-C and I-O) and three (E-G) independent experiments. Data are mean ± SD. (B, F, G, J, K, N, and O). 1-way ANOVA with Tukey posttest (F), 2-way ANOVA with Tukey posttest (B), Student’s t-test (K and O), and χ2 test (G, J, and N). Scale bars: 20 μm (C) and 100 μm (E, I, and M). *P < 0.05, **P < 0.01, ***P < 0.001 ****P < 0.0001.
Figure 5.
Figure 5.. Commensal microbiota colonization and TV regulate NLRC5 expression in IECs.
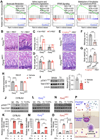
(A) Experimental design associated with data in B and C panels. (B) MA (the logged intensity ratio [M] versus the mean logged intensities [A]) plot showing DEGs (adjust P<0.01, FF vs. BF) in the small intestine of P2 mouse pups (n = 3/group). (C) Heatmap shows GO Tree analysis revealing the downregulation of genes in the small intestine due to FF (adjust P<0.01, n = 3/group). Red font indicates NK cell-associated genes. (D-F) RT-qPCR analysis of Nlrc5 expression in the small intestine of P2 pups with indicated postnatal feeding interventions (D, n = 6/group), fetus (E16 and E18) and BF pups at specified postnatal stages (E, n = 5/group), and FF and BF mouse pups on the indicated postnatal days (F, n = 6/ group). (G) Representative immunoblot showing NLRC5 levels in the small intestine of P2 pups with indicated postnatal feeding interventions (n = 6/group). (H) Representative immunofluorescent images showing levels of NLRC5 in villous IECs of P2 pups under indicated postnatal feeding conditions (n = 6/group). (I) RT-qPCR analysis of Nlrc5 expression in the small intestine of BF conventionally raised (Conv) and germ-free (GF) pups at specified postnatal stages (n = 5/group). J) Representative immunofluorescent images of NLRC5 in indicated human neonatal small intestinal samples (n = 5/group). (K) Experimental design associated with data in L and M panel. (L and M) Analysis of Nlrc5 expression in the small intestine of indicated P10 mouse pups with RT-qPCR (L) and immunofluorescent staining (M). n = 6/group. (N) Experimental design associated with data in (O) panel. (O) RT-qPCR analysis of Nlrc5 expression in the small intestine of TV or vehicle-treated P10 BF mouse pups (n = 6/group). Panels of A, K, and N were created with BioRender.com. Data summarize two (B, C, G, H, J, M, and O), three (D and L), four (F) and five (E and I) independent experiments. Data are mean ± SD. (D-F, I, L, and O). One-way ANOVA (E), one-way ANOVA with Tukey posttest (D and L), two-way ANOVA with interaction posttest (F and I), and Student’s t-test (O). Scale bars, 20 μm (H, J, and M). ***P < 0.001 ****P < 0.0001.
Figure 6.
Figure 6.. R837-mimicked viral inflammation induces NEC-like injury in the small intestine of Nlrc5iΔIEC mouse pups via NK1.1+ cell dependent manner.
(A) Experimental design associated with data in B-D panels. (B-D) Histological images (B), histological grading of intestinal injury (C), and body weight measurement (D) of mouse pups at 24 h after gavage treatment with or without R837 (n = 6 – 8/group). Nlrc5Ctr: vehicle-treated Nlrc5fl/fl/Vil-cre-ERT2 pups. Nlrc5iΔIEC: tamoxifen (Tam; 50 μg/day/pup, s.c.)-treated Nlrc5fl/fl/Vil-cre-ERT2 pups. (E) Experimental design associated with data in F and G panels. (F and G) Histological images (F) and histological grading of intestinal injury (G) of Nlrc5iΔIEC mouse pups at 24 h after treatment with or without R837 (n = 6 – 8/group). (H) Schematic diagram showing the strategy for determining resistance of indicated IECs to autologous NK1.1+ cell cytotoxicity. (I) In vitro analysis of autologous NK1.1+ cell cytotoxicity to indicated IECs using multiparametric flow cytometry-based cytolysis assay (n = 6/group). Panels of A, E, and H were created with BioRender.com. Representative histological images depict H&E-stained small intestinal tissue sections (B and F). Dashed line indicates the cut-off point for histologic grade of NEC (C and G). Data summarize two (I), three (F and G), or four (B-D) independent experiments. Data are mean ± SD. (C, D, G, and I). χ2 test (C and G) and 2-way ANOVA with Tukey posttest (D and I). Scale bars: 100 μm (B and F). *P < 0.05, ***P < 0.001 ****P < 0.0001.
Figure 7.
Figure 7.. PPAR-γ mediates the effect of TV on inhibiting IFN/STAT1 signal-controlled Nlrc5 expression in IECs, thereby predisposing neonatal gut to NEC during viral inflammation.
(A) TV-activated KEGG pathways in NCM460D IECs. Gene set enrichment analysis (GSEA) of RNAseq data derived from TV-treated cells (10 μM for 24 h). n = 4/group, FDR < 0.05. (B-G) Histological images (B and E), histological grading of intestinal injury (C and F), and body weight measurement (D and G) of mouse pups at 24 h after gavage-treatment with or without R837 (n = 5 – 7/group). PpargCtr, vehicle-pretreated Ppargfl/fl/Vil-cre-ERT2 pups. PpargiΔIEC, tamoxifen-treated Ppargfl/fl/Vil-cre-ERT2 pups. K. oxytocaTV+, colonizing with TV-producing K. oxytoca. (H) RT-qPCR analysis of intestinal Nlrc5 expression in indicated mouse pups at 24 h after gavage-treatment with or without TV (n = 5/group). (I) Levels of total and phosphor-STAT1 in the small intestine of vehicle or TV-treated BF pups (n = 3/group). Repres entative immunoblot (left) and quantitative densitometric data (right). (J-O) Immunoblot analysis of expression of total and phosphor-STAT1 (J, L, and N), and RT-qPCR analysis of Nlrc5 expression (K, M, and O) in neonatal (P10, BF) intestinal epithelial organoids isolated from wild-type cohorts (J and K), PpargCtr cohorts (L and M), and PpargiΔIEC cohorts (N and O). n = 3/group. P, Schematic diagram showing the overview of proposed therapeutic targets (marked with blue stars) for prevention of NEC (created with BioRender.com). Representative histological images depict H&E-stained small intestinal tissue sections (B and E). Dashed line indicates the cut-off point for histologic grade of NEC (C and F). Data summarize two (H and J-O) or three (B-G) independent experiments. Data are mean ± SD (C, D, F-I, K, M, and O). 2-way ANOVA with Tukey posttest (D, H, K, M, and O), Student’s t-test (G and I), and χ2 test (C and F). Scale bars, 100 μm (B and E). *P < 0.05, **P < 0.01, ***P < 0.001 ****P < 0.0001.

References

    1. Rakoff-Nahoum S, Kong Y, Kleinstein SH, Subramanian S, Ahern PP, Gordon JI, and Medzhitov R. (2015). Analysis of gene-environment interactions in postnatal development of the mammalian intestine. Proc. Natl. Acad. Sci. U. S. A. 112, 1929–1936. 10.1073/pnas.1424886112. - DOI - PMC - PubMed
    1. Nicholson JK, Holmes E, Kinross J, Burcelin R, Gibson G, Jia W, and Pettersson S. (2012). Host-gut microbiota metabolic interactions. Science 336, 1262–1267. 10.1126/science.1223813. - DOI - PubMed
    1. Cho I, Yamanishi S, Cox L, Methe BA, Zavadil J, Li K, Gao Z, Mahana D, Raju K, Teitler I, et al. (2012). Antibiotics in early life alter the murine colonic microbiome and adiposity. Nature 488, 621–626. 10.1038/nature11400. - DOI - PMC - PubMed
    1. Hooper LV, Wong MH, Thelin A, Hansson L, Falk PG, and Gordon JI (2001). Molecular analysis of commensal host-microbial relationships in the intestine. Science 291, 881–884. 10.1126/science.291.5505.881. - DOI - PubMed
    1. Medzhitov R, Schneider DS, and Soares MP (2012). Disease tolerance as a defense strategy. Science 335, 936–941. 10.1126/science.1214935. - DOI - PMC - PubMed

MeSH terms

Substances

LinkOut - more resources