. 2024 Oct 3;187(20):5587-5603.e19.
doi: 10.1016/j.cell.2024.08.044. Epub 2024 Sep 17.

Intracellular Ebola virus nucleocapsid assembly revealed by in situ cryo-electron tomography

Affiliations

Intracellular Ebola virus nucleocapsid assembly revealed by in situ cryo-electron tomography

Reika Watanabe et al. Cell. .

Abstract

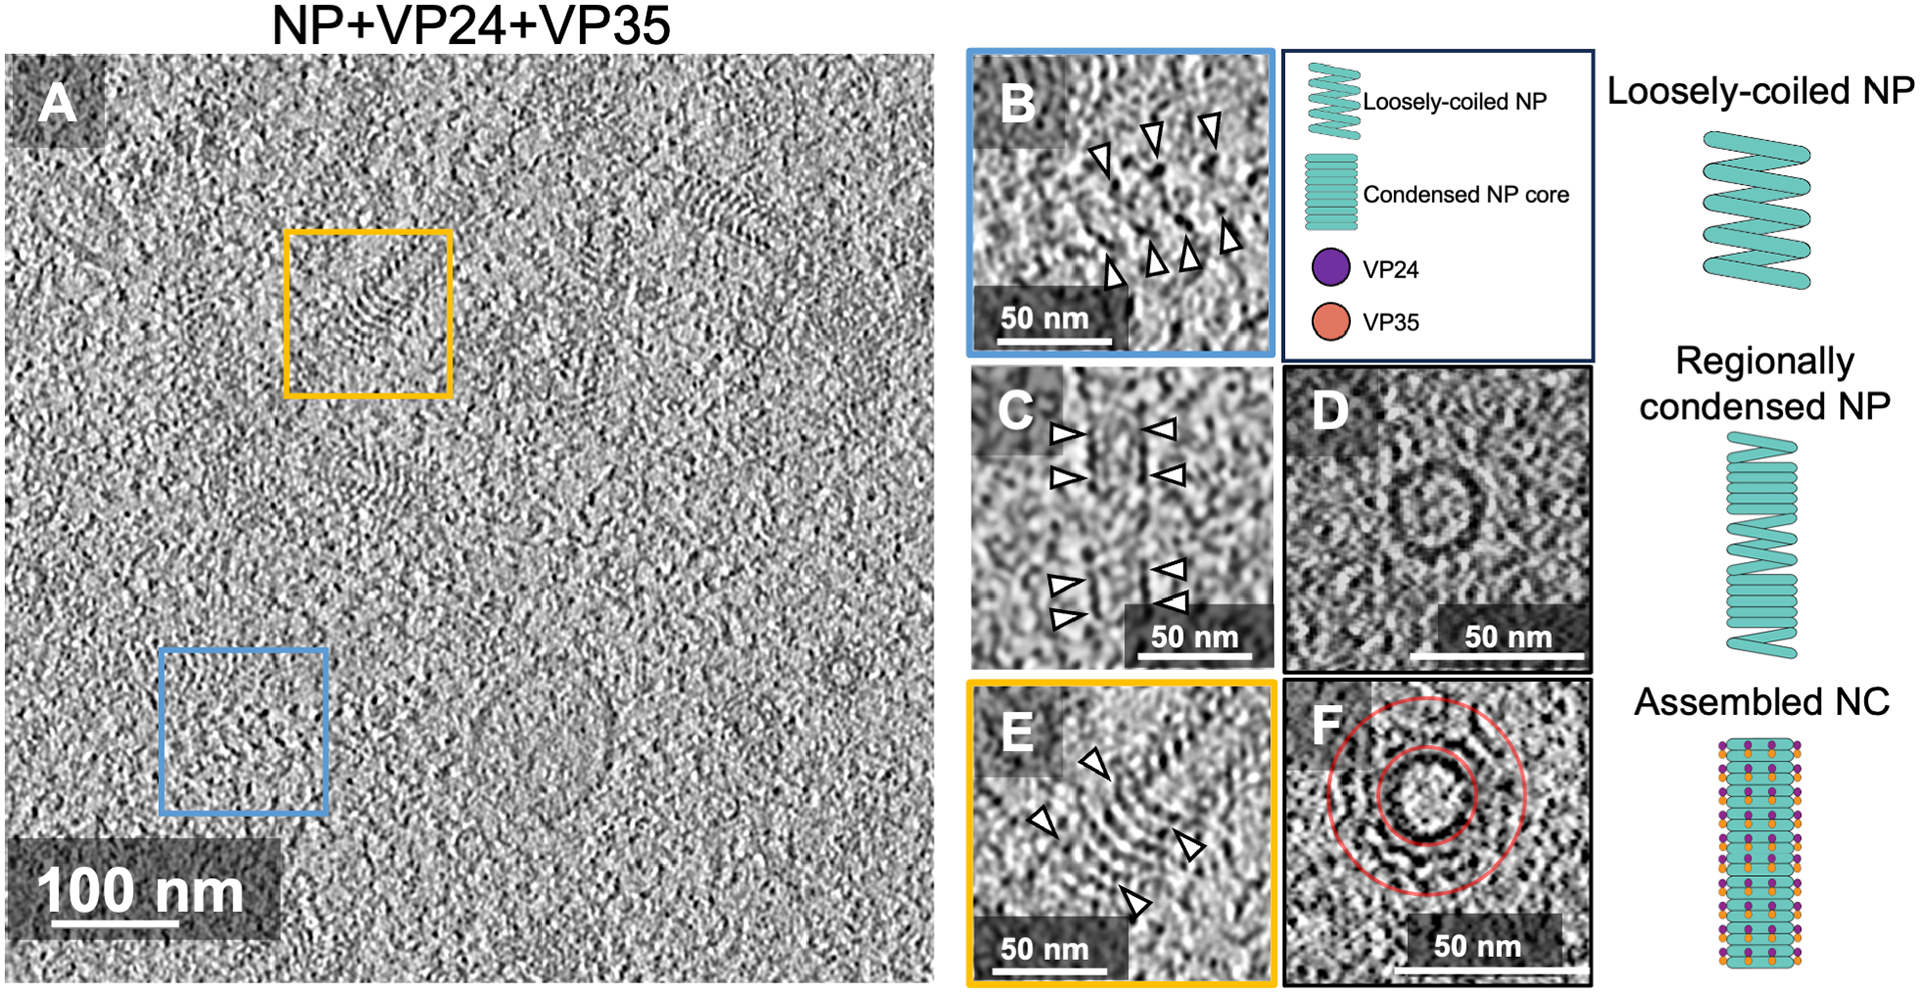
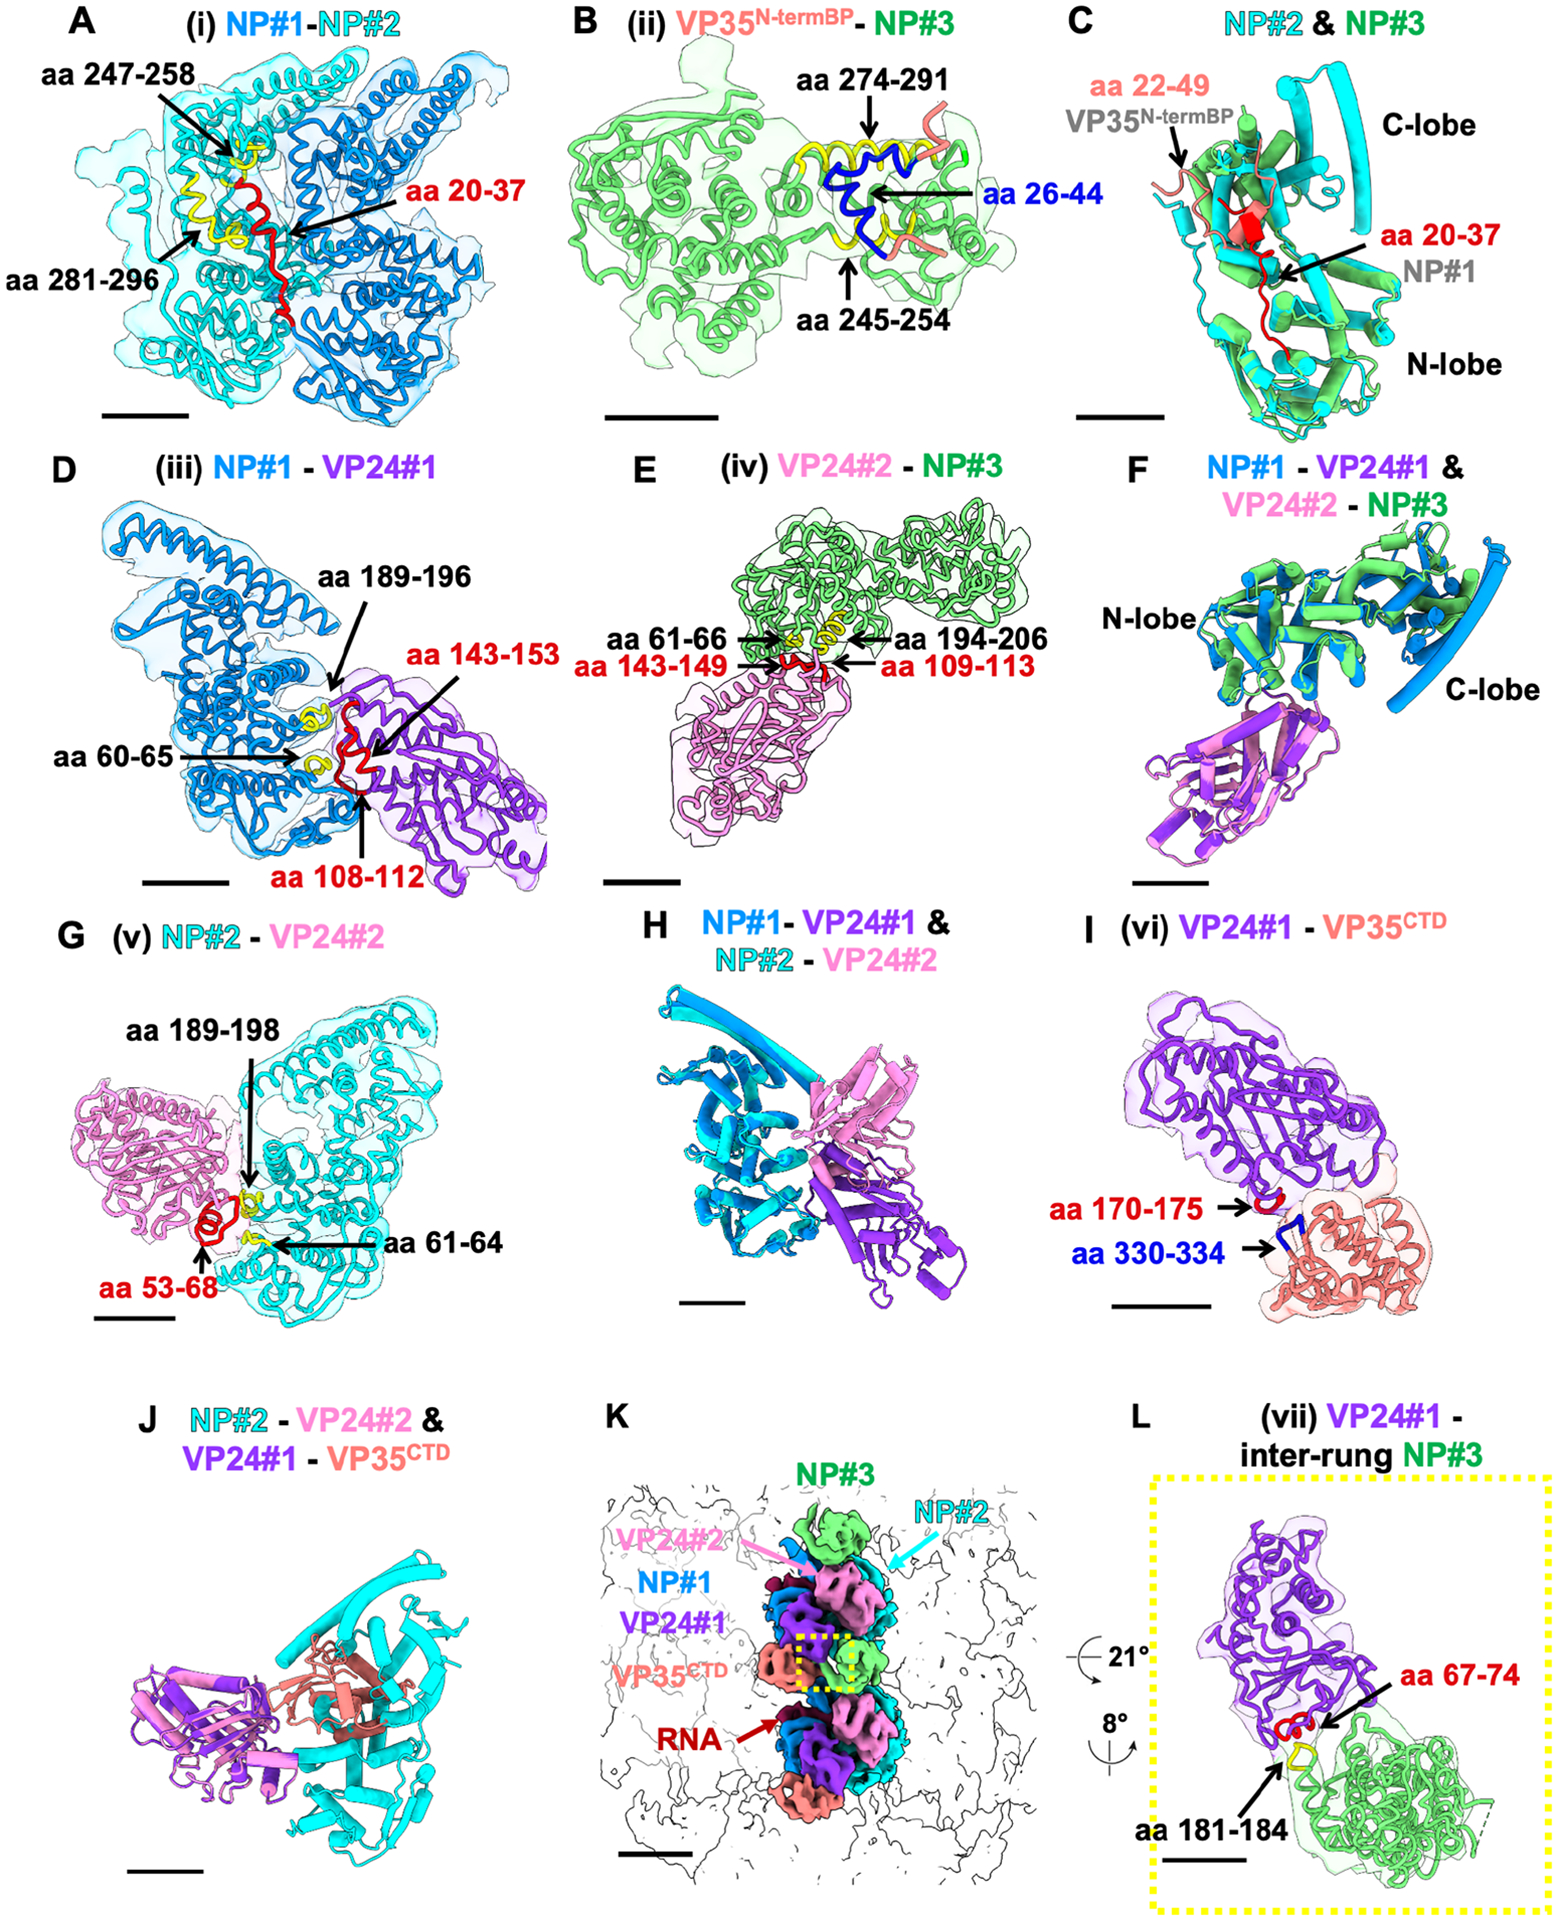
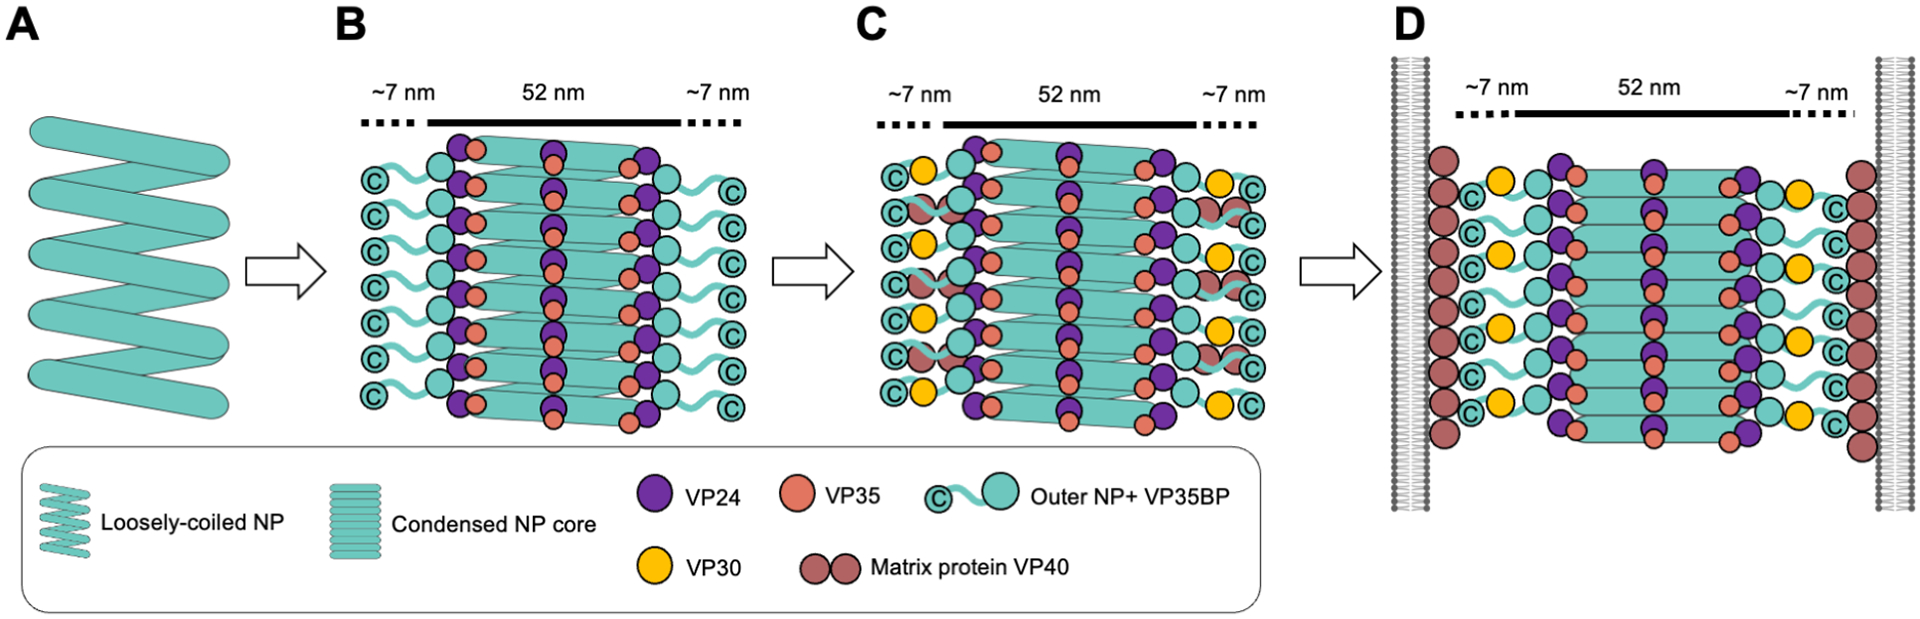
Filoviruses, including the Ebola and Marburg viruses, cause hemorrhagic fevers with up to 90% lethality. The viral nucleocapsid is assembled by polymerization of the nucleoprotein (NP) along the viral genome, together with the viral proteins VP24 and VP35. We employed cryo-electron tomography of cells transfected with viral proteins and infected with model Ebola virus to illuminate assembly intermediates, as well as a 9 Å map of the complete intracellular assembly. This structure reveals a previously unresolved third and outer layer of NP complexed with VP35. The intrinsically disordered region, together with the C-terminal domain of this outer layer of NP, provides the constant width between intracellular nucleocapsid bundles and likely functions as a flexible tether to the viral matrix protein in the virion. A comparison of intracellular nucleocapsids with prior in-virion nucleocapsid structures reveals that the nucleocapsid further condenses vertically in the virion. The interfaces responsible for nucleocapsid assembly are highly conserved and offer targets for broadly effective antivirals.

Keywords: Ebola virus; Mononegavirales; antiviral; correlative light and electron microscopy; cryo-electron tomography; filovirus; focused-ion beam milling; immune suppressor; in situ structural biology; integrative modeling; nucleocapsid; nucleoprotein; phosphoprotein; subtomogram averaging; virus assembly; virus pathogenesis; virus structure.


Conflict of interest statement

Declaration of interests The authors declare no competing interests.

Figures

Figure 1.
Figure 1.. Ebola nucleocapsid assembly intermediates
(A-F) Representative tomographic slice of cells transiently expressing NP, VP24, and VP35 (A); enlarged views showing loosely-coiled NP (B); regionally condensed NP-only coils (C, D), and fully assembled nucleocapsid with additional outer layers on condensed NP (E, F), highlighted by the arrowheads respectively. Schematic representations of the intermediate structures are shown on the right. Cross-sectional views of (C and E) are shown in (D and F), respectively. The cross-sectional diameter of NP (D) is 23 nm, and the assembled nucleocapsid (F) is ~50 nm. The outer layer of nucleocapsid lies between the red circles in the cross-sectional view (F). See also Figures S1, and Video S1.
Figure 2.
Figure 2.. Structure of intracellular Ebola NPΔ601-739-VP24-VP35 nucleocapsid
(A) Domain organization of Ebola virus (EBOV) NP, VP35, and VP24. Regions that have been modeled and unmodeled in this study are indicated by filled and open boxes, respectively. (B) The initial map of intracellular Ebola NPΔ601-739-VP24-VP35 nucleocapsid. The repeating unit is marked with a white outline. (C-E) Intracellular NPΔ601-739-VP24-VP35 nucleocapsid subunit densities. The two central NP core domains (NPcore#1, NPcore#2) are in blue and cyan. Two copies of VP24 (VP24#1, VP24#2) are in purple and pink. The C-terminal domain of VP35 (VP35CTD) is in orange, and the third NP core (NPcore#3) is in green. Continuous red density at the interior core of the NP copies corresponds to RNA. (F-I) Molecular models fitted into EM densities. Colors are as in (C-E). Pink and purple cones indicate the orientation of the pyramid shape of VP24 molecules in (G, I). The locations of N-lobe (aa 15-240) and C-lobe (aa 241-405) of NP are shown in (G, J). (J and K) Crystal structure of NP (green; PDB: 4ZTG) complexed with the VP35 N-terminal NP-binding peptide (orange; PDB: 4ZTG) and the NP core structure obtained from isolated NP (aa 16-405)-RNA helix (blue; PDB: 6EHL) each fitted into the outermost density indicated by the dotted line in (G). (L) Local resolution map. Scale bars indicate 10 nm (B), 5 nm (C-E), 2 nm (F, J). See also Figures S2-S3 and Videos S2-S3.
Figure 3.
Figure 3.. Structure of intracellular Ebola NP-VP24-VP35 from full-length NP
(A) Initial map of the intracellular Ebola virus nucleocapsid made from full-length NP-VP24-VP35. The repeating unit is marked with a white outline. (B-C), Intracellular full-length NP-VP24-VP35 nucleocapsid subunit densities. Density colors correspond to those for Figure 2. (D-F) Molecular models fitted into the EM densities and the hypothetical position of NP aa 601-739 based on the measured distance between intracellular nucleocapsids. The crystal structure of the NP C-terminal domain (aa 641-739; PDB: 4QB0) is fit into the gap. (G and J) Representative tomographic slices of cells, (H and K) Initial averages mapped back onto tomograms, and (I and L) Two-dimensional histograms showing the distance of the center-to-center and angle of the intracellular nucleocapsids formed by full-length NP-VP24-VP35 and NPΔ601-739-VP24-VP35, respectively. Yellow lines in G, H, J and K indicate the center-to-center distance of the closest neighboring nucleocapsid. H and K panel insets show oriented views to visualize the distance between aligned nucleocapsids. Scale bars indicate 10 nm (A), 5 nm (B-C), 2 nm (D), 100 nm (G, J). See also Figure S2 and Video S1-S2.
Figure 4.
Figure 4.. Molecular model of in-virion nucleocapsids and condensation of intracellular nucleocapsids upon virion incorporation
(A and D) Previously published EM maps of in-virion NP-VP24-VP35 (EMD-3871) and Ebola nucleocapsid (EMD-3873). The single repeating units are highlighted in pink. (B and E), EM densities fitted with the published molecular model of two copies of NP (in blue and cyan) and two copies of VP24 (in purple and pink) (PDB: 6EHM) molecules show previously unannotated densities (white). (C and F) Updated in-virion model created based on an in-cell model (Figure 2) fitted into EM densities of the virus like particles (VLPs) and authentic virus. Model colors correspond to those for Figure 2. (G) Comparison of single repeating units of intracellular (in-cell in pink) and in-virion (in white) nucleocapsid shows that the models are nearly identical. (H-J) Assembled models consisting of nine repeating units of in-cell and in-virion nucleocapsid models based on intracellular NP(Δ601-739)-VP24-VP35 and in-virion NP-VP24-VP35 nucleocapsid densities (EMD-3871) and their overlaid models. In the overlaid model, the in-cell surface model is shown in opaque pink. (K-L) Side view of assembled models consisting of three vertically aligned nucleocapsid models based on EM densities of intracellular NPΔ601-739-VP24-VP35 and in-virion NP-VP24-VP35 nucleocapsids(EMD-3871), respectively. Red and blue arrowheads show longer and shorter inter-rung gaps, respectively. (M-N) Enlarged views of the boxed regions in (H) and (I), respectively. Molecular models are fitted into the EM densities. Yellow arrowhead in (M) and red arrowhead in (N) indicate the inter-rung interfaces identified in the in-cell nucleocapsid and in the in-virion nucleocapsid, respectively. In (N), yellow arrowhead points to the same location of VP24 (purple) as in (M) as a reference point. Scale bars indicate 5 nm (A, D, J, and K) and 2 nm (B, C, E, F, G, M, and N). See also Figure S4 and Video S4.
Figure 5.
Figure 5.. EBOV-GFP-ΔVP30 virus-infected cells illuminate the authentic assembly process
(A) Overlay of the fluorescence signal (green) and cryo-SEM image (greyscale) of chemically fixed and plunge-frozen EBOV-GFP-ΔVP30-infected VP30-Vero cell 24 hours post-infection. The locations of the nucleus and viral replication factory are marked in white and red arrowheads, respectively. (B) Overlay of the fluorescence signal (green) and an SEM image after FIB-milling (greyscale) of the area marked in (A). (C) TEM image of the area marked in (B) showing presence of virus replication factory in the host cell cytoplasm (marked with white dotted curve). (D) Tomographic slice of the area marked in (C). The replication factory is inside and above the white dotted curve. (E) Annotation of the fully assembled nucleocapsid (in pink) and membrane (in yellow) and densities inside of viral factory (in blue-gray) in the tomogram shown in (D). (F, G) The enlarged views of loosely coiled NP and fully assembled nucleocapsid, respectively. (H) Representative tomographic slice showing intracellular nucleocapsid found in EBOV-GFP-ΔVP30 virus-infected cells. Blue arrowheads indicate fluffy densities extending from the intracellular nucleocapsid. (I) Representative tomographic slice of a virus emerging from of chemically fixed and plunge-frozen EBOV-GFP-ΔVP30-infected VP30-Vero cell 24 hours post-infection. (J) Enlarged view of the boxed region in (I). (K) Annotation of tomogram in (J). The viral envelope lipid bilayer, matrix protein VP40 layer, and nucleocapsids are in yellow, green, and blue, respectively. (L) Representative tomographic slice of intact virus and naked nucleocapsids without viral envelope found in the cell periphery of infected cells 24 hours post-infection. Blue arrowheads highlight fluffy densities extending from the in-virion nucleocapsid. Inset: Enlarged views of the boxed region. Scale bars indicate 10 μm (A), 5 μm (B), 500 nm (C), 200 nm (D) and 50 nm (F-I and L). See also Figure S5.
Figure 6.
Figure 6.. Interfaces involved in nucleocapsid formation
(A) Interface (i) NP#1-NP#2. The view is from inside the nucleocapsid as shown in Figure 2H. (B) Interface (ii) VP35N-termBP-NP#3. The view is from the top of the nucleocapsid as shown in Figure 2K. (C) Superimposing NP#2 and NP#3. N-terminal tail from the adjacent NP#1 and VP35 N-terminal binding peptide are shown in red and orange, respectively. (D) Interface (iii) NP#1-VP24#1. Side view as shown in Figure 2G. (E) Interface (iv) VP24#2-NP#3. Side view as shown in Figure 2G. (F) Superimposing NP#1-VP24#1 and VP24#2-NP#3 with alignment of the VP24#1 and VP24#2. (G) Interface (v) NP#2-VP24#2. Side view as shown in Figure 2I. (H) Superimposing NP#1-VP24#1 and NP#2-VP24#2 with alignment of NP#1 and NP#2. (I) Interface (vi) VP24#1-VP35CTD. Side view as shown in Figure 2G. (J) Superimposing NP#2-VP24#2 and VP24#1-VP35CTD with alignment of VP24#2 and VP24#1. (K) Two central repeating units are colored within the EM density of intracellular NPΔ601-739-VP24-VP35. Yellow box shows an inter-rung interface. (L) Interface (vii) VP24#1-inter-rung NP#3. (A-L) The color of each fit model matches that of the EM map in Figure 2. Regions forming interfaces are colored yellow, red, and blue to distinguish them from the rest of the proteins. Density thresholds are set to show helical densities. Scale bars indicate 2 nm except in (K); 5nm. See also Figure S6 and Table S1.
Figure 7.
Figure 7.. Schematic model of the Ebola virus nucleocapsid assembly process
(A) The loosely coiled NP. (B) VP24, VP35, and outer NP assemble on the loosely coiled NP, which transition into a rigid and condensed state. A portion of the intrinsically disordered domain and C-terminal domain of NP extends from the assembled nucleocapsid and fills the additional 7 nm-wide space along the intracellular nucleocapsid. (C) In virus-infected cells, the essential transcription factor VP30 and matrix protein VP40 interact with C-terminal domains of NP-,, (D) Assembled nucleocapsids are incorporated into virions. In the virion, nucleocapsids are further condensed relative to intracellular nucleocapsids. The matrix-to-matrix distance in the virion measured in the tomographic slice shown in Figures 5I is ~66 nm, which matches well with the estimated width of ~66 nm of nucleocapsid including NP (aa 601-739) regions (52 + 14 nm) shown in Figures 3F and 3I.

References

    1. Malvy D, McElroy AK, de Clerck H, Günther S, and van Griensven J (2019). Ebola virus disease. Lancet 393, 936–948. 10.1016/S0140-6736(18)33132-5. - DOI - PubMed
    1. Henao-Restrepo AM, Camacho A, Longini IM, Watson CH, Edmunds WJ, Egger M, Carroll MW, Dean NE, Diatta I, Doumbia M, et al. (2017). Efficacy and effectiveness of an rVSV-vectored vaccine in preventing Ebola virus disease: final results from the Guinea ring vaccination, open-label, cluster-randomised trial (Ebola Ça Suffit!). Lancet 389, 505–518. 10.1016/S0140-6736(16)32621-6. - DOI - PMC - PubMed
    1. Cao W, He S, Liu G, Schulz H, Emeterio K, Chan M, Tierney K, Azaransky K, Soule G, Tailor N, et al. (2023). The rVSV-EBOV vaccine provides limited cross-protection against Sudan virus in guinea pigs. NPJ Vaccines 8, 91. 10.1038/s41541-023-00685-z. - DOI - PMC - PubMed
    1. Keita AK, Koundouno FR, Faye M, Düx A, Hinzmann J, Diallo H, Ayouba A, Le Marcis F, Soropogui B, Ifono K, et al. (2021). Resurgence of Ebola virus in 2021 in Guinea suggests a new paradigm for outbreaks. Nature 597, 539–543. 10.1038/s41586-021-03901-9. - DOI - PubMed
    1. Noda T, Ebihara H, Muramoto Y, Fujii K, Takada A, Sagara H, Kim JH, Kida H, Feldmann H, and Kawaoka Y (2006). Assembly and budding of Ebolavirus. PLoS Pathog. 2, e99. 10.1371/journal.ppat.0020099. - DOI - PMC - PubMed

MeSH terms

LinkOut - more resources