. 2024 Nov;635(8039):736-745.
doi: 10.1038/s41586-024-08043-2. Epub 2024 Sep 18.

A lymphocyte chemoaffinity axis for lung, non-intestinal mucosae and CNS

Affiliations

A lymphocyte chemoaffinity axis for lung, non-intestinal mucosae and CNS

Borja Ocón et al. Nature. 2024 Nov.

Abstract

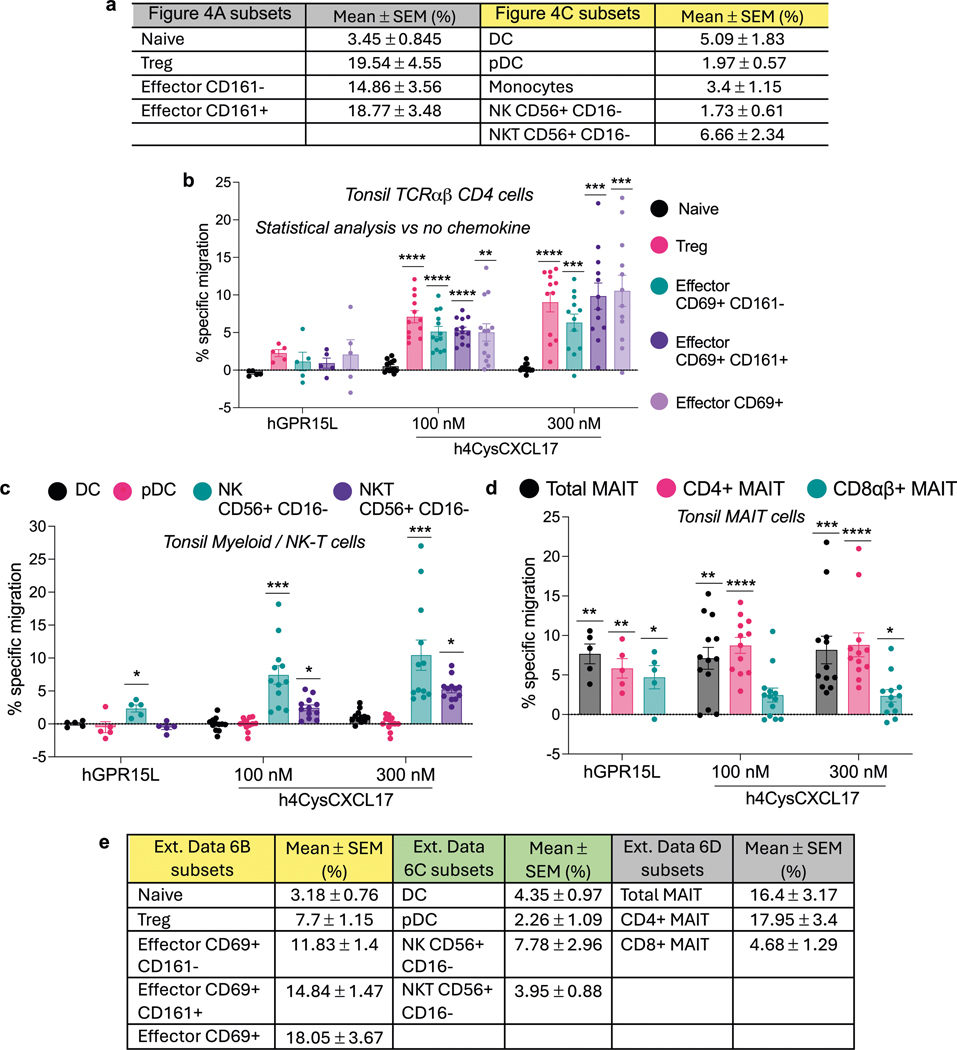
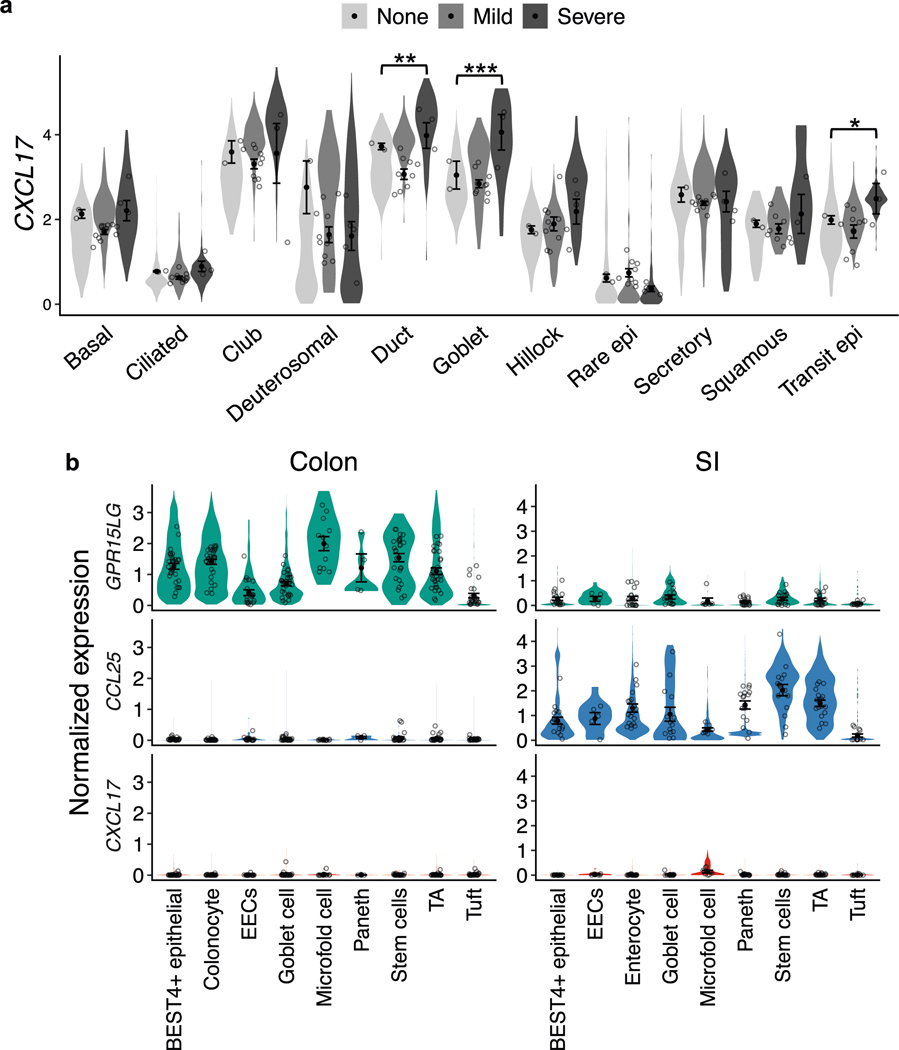
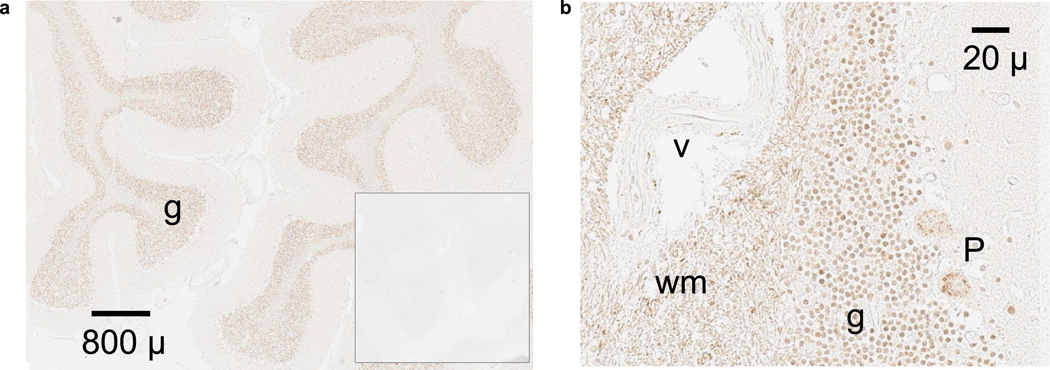
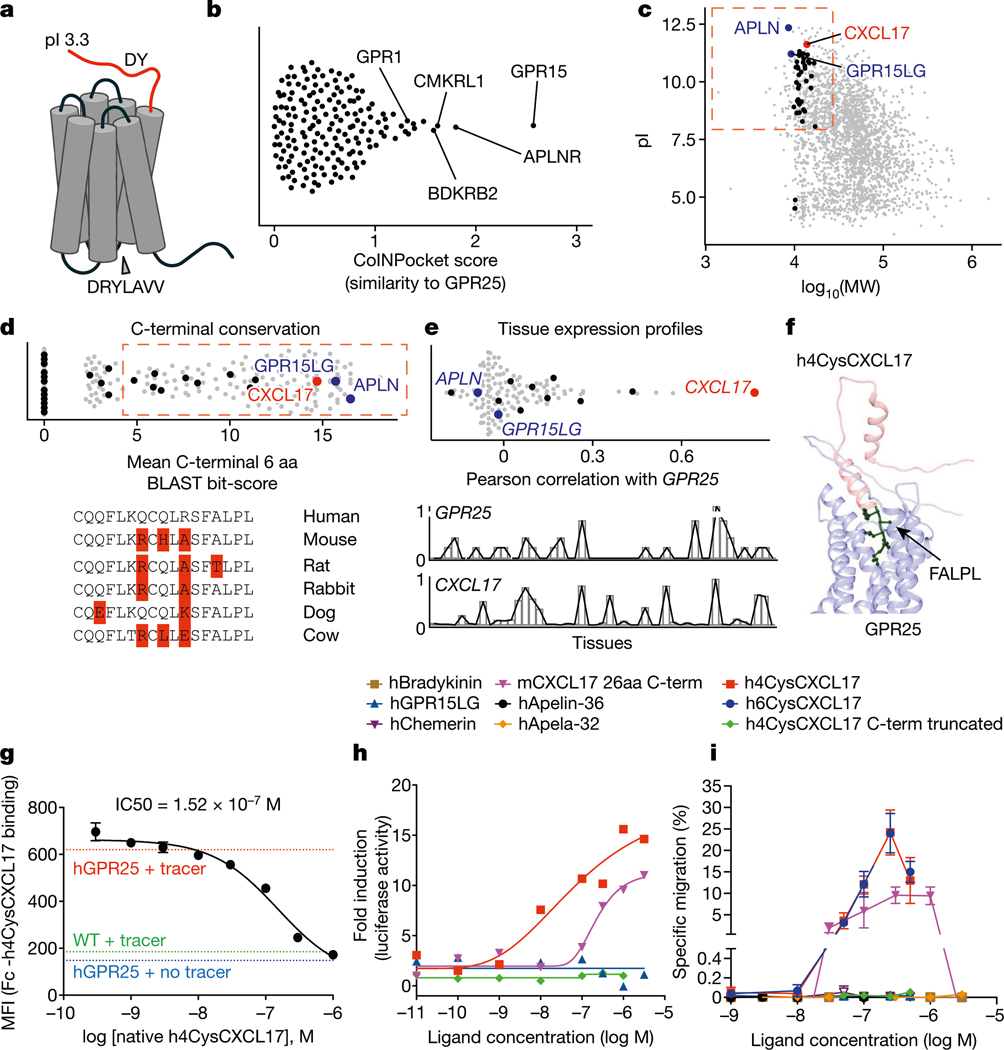
Tissue-selective chemoattractants direct lymphocytes to epithelial surfaces to establish local immune environments, regulate immune responses to food antigens and commensal organisms, and protect from pathogens. Homeostatic chemoattractants for small intestines, colon and skin are known1,2, but chemotropic mechanisms selective for respiratory tract and other non-intestinal mucosal tissues remain poorly understood. Here we leveraged diverse omics datasets to identify GPR25 as a lymphocyte receptor for CXCL17, a chemoattractant cytokine whose expression by epithelial cells of airways, upper gastrointestinal and squamous mucosae unifies the non-intestinal mucosal tissues and distinguishes them from intestinal mucosae. Single-cell transcriptomic analyses show that GPR25 is induced on innate lymphocytes before emigration to the periphery, and is imprinted in secondary lymphoid tissues on activated B and T cells responding to immune challenge. GPR25 characterizes B and T tissue resident memory cells and regulatory T lymphocytes in non-intestinal mucosal tissues and lungs in humans and mediates lymphocyte homing to barrier epithelia of the airways, oral cavity, stomach, and biliary and genitourinary tracts in mouse models. GPR25 is also expressed by T cells in cerebrospinal fluid and CXCL17 by neurons, suggesting a role in central nervous system (CNS) immune regulation. We reveal widespread imprinting of GPR25 on regulatory T cells, suggesting a mechanistic link to population genetics evidence that GPR25 is protective in autoimmunity3,4. Our results define a GPR25-CXCL17 chemoaffinity axis with the potential to integrate immunity and tolerance at non-intestinal mucosae and the CNS.


Conflict of interest statement

Competing interests: The authors declare no competing interests.

Figures

Extended Data Fig. 1 |
Extended Data Fig. 1 |. Tissue- and subset-selective expression of GPR25 by lymphocytes.
a. Comparison of GPR25, GPR15 and CCR9 in the airway, colon, and SI, respectively, in total CD4 or CD8 T cells. Data from healthy adult and pediatric donors (n = 12–16). Boxplots of GPR25, GPR15 and CCR9 mean imputed expression per patient sample in total CD4 or CD8 T cells are shown, with each dot representing the mean value per sample. Hinges of box correspond to the first and third quartiles. Whisker extends from the corresponding hinge to the max/min value no further than 1.5x interquartile range from the hinge. Samples with fewer than 10 cells are not plotted. *: p-value < 0.05; ****: p-value < 0.0001, two-tailed T-test. b. Normalized transcript per million (TPM) of GPR25 from scRNAseq of all human cell types from the Human Protein Atlas. C. Mean TPM of GPR25 from bulk RNAseq of immune cell types sorted from PBMC of 4 healthy donors. Sample source information is provided in Supplementary Table 1.
Extended Data Fig. 2 |
Extended Data Fig. 2 |. GPR25 expression and association with neurodegeneration.
scRNAseq violin plots of imputed GPR25 expression in T cell subsets and myeloid cells in CSF samples from healthy donors and patients with mild cognitive impairment/Alzheimer’s Disease (MCI/AD). Data from all patients with more than 1000 cells are presented with means of individual donors (open circles) and mean values of the donor means (solid circles) ± SEM (n = 28). *: p-value < 0.05; **: p-value < 0.01; ****: p-value < 0.0001; n.s.: non-significant, multivariate regression. Trending differences between healthy and diseased samples are not statistically significant. Sample source information is provided in Supplementary Table 1.
Extended Data Fig. 3 |
Extended Data Fig. 3 |. Expression of GPR25 in T cells in the MLN, TLN and small intestines.
a. GPR25+ cells are enriched in mature Tregs during CD4 T cell differentiation in MLN and TLN. CD4 T cells aligned along a developmental path from CD4 naive cells illustrating sequential expression of CCR9 and GPR25 by T cells along a developmental (pseudotime) trajectory seeded from naive CD4 cells. Mature FOXP3-high IL2RA-hi Tregs (Treg hi) emerge late and are enriched in GPR25 + CCR9+ cells in MLN. Cells are pooled from 14 MLN and 9 TLN samples from healthy donors. b. GPR25 is expressed by subsets of Treg and TEM in the small intestines. Violin plots illustrating CCR9 and GPR15 expression by GPR25 + (GPR25 > 0.2) vs GPR25- (GPR25 < 0.2) T cells in SI, pooled from 12 healthy donors and presented with means of individual donors (open circles) and mean values of donor means (solid circles) ± SEM. All gene expression imputed. Sample source information is provided in Supplementary Table 1.
Extended Data Fig. 4 |
Extended Data Fig. 4 |. Predicted structure of the GPR25 complex with CXCL17.
a. The overall view of the complex. Receptor and the CXCL17 C-terminal helix are shown in white and black ribbons, respectively, and viewed along the plane of the membrane. b. The acidic C-terminus of CXCL17 is predicted to insert into the predominantly positively charged orthosteric binding pocket of GPR25. The receptor is viewed along the plane of the membrane as in (A) and is shown as a cut-away space-filling mesh colored by electrostatic potential (blue: positive, red: negative). The C-terminal part of CXCL17 is shown as black ribbon (backbone) and sticks (for the carboxyl group and residue side-chains only). c. The amino-acid residue environment in the receptor binding pocket is complementary to the molecular composition of the distal C-terminus of CXCL17, which ensures favorable hydrophobic packing against W952.60 and prominent hydrogen bonding interactions with the network of S1163.29, R1784.64, E19345.52, and R2646.55. Receptor is viewed across the plane of the membrane from the extracellular side and shown in white ribbon and sticks; the two C-terminal residues of CXCL17 are shown in black. Cyan dotted lines denote hydrogen bonds. The model was built using AlphaFold 2.3.2 Multimer. Structure was refined and visualized in ICM 3.9–3b.
Extended Data Fig. 5 |
Extended Data Fig. 5 |. CXCL17 is a chemoattractant ligand for GPR25 but not GPR15 or CMKLR1.
a. Human GPR15 transfectants migration to GPR15LG (250 nM) and CXCL17 (10–300 nM). b. Human CMKLR1 transfectants migration to chemerin and CXCL17 (10–300 nM). c. Checkerboard assay with human 4CysCXCL17 250 nM and human GPR25 transfectants. d. Pertussis toxin (100 ng/ml, 2 h pre-treatment before migration assay) inhibits CXCL17-induced chemotaxis on human GPR25 L1–2 transfectants. e. Intact mouse 6CysCXCL17 (3 nM - 1μM) is an active chemoattractant on human GPR25. f. Intact human 4CysCXCL17 is an active chemoattractant on mouse GPR25. g. mGPR25 transduced cells, but not the empty vector transduced counterparts robustly chemotax to mouse and human CXCL17 in in vitro trans well-based migration assays. Results with 3–9 replicates pooled from at least two independent experiments are shown as mean ± SEM. ****; P < 0.0001 vs no chemokine control in a two-tailed T-test.
Extended Data Fig. 6 |
Extended Data Fig. 6 |. Subset selective T cell chemotaxis to CXCL17.
a. Table showing % of migration to no chemokine in Fig. 4a and c. b-d. Tonsil cells were migrated in transwells to human 4CysCXCL17 or human GPR15LG for 3 hrs. Migrated and input cells were counted and phenotyped by flow cytometry. b-d. Naive (CD45RO− CD45RA +) or indicated effector/memory (CD45RO + CD45RA−) TCRαβ + CD4+ subsets were defined with MAbs to intracellular Foxp3 and CD25 (Tregs), and CD161, a marker of mucosal tissue homing T cells. Mucosal-associated invariant T cells are Vα7.2 +. NK cells were defined as CD14−, HLA/DR−, CD3−, CD19−, CD56 +, CD16−. NKT shared the same immunophenotyping but were gated as CD3 +. Conventional dendritic cells (DC) were defined as CD3−, CD19−, CD14−, HLA/DR +, CD11c +. Plasmacytoid dendritic cells (pDC) were defined as CD3−, CD19−, CD14−, HLA/DR +, CD123 +. Data are % of input cells migrated above mean “no chemokine/NC control” migration (which defines 0). e. Table showing % of migration to no chemokine in panels b-d. Results pooled from three independent experiments and shown as mean ± SEM of % of specific migration, except for hGPR15LG (two experiments). N ≥ 5. *; P < 0.05, **; p < 0.01, ***; p < 0.001, ****; p < 0.0001. One way ANOVA analysis with Dunnet post hoc test was performed to each cell subset comparing the indicated condition vs no chemokine control (NC).
Extended Data Fig. 7 |
Extended Data Fig. 7 |. CXCL17 expression in the human and mouse CNS.
a. UMAP of scRNAseq data of the human brain from Human Protein Atlas. Cells with CXCL17 expression are denoted in black. b. Violin plots illustrating CXCL17 expression by subsets in the hippocampus from healthy donors (n = 2). c. Violin plots of Cxcl17 expression by CNS cells from whole brains of mice at 4-week (n = 2) or 90-week (n = 2). d. Violin plots of Cxcl17 in mouse spinal cord subsets in injury models (n = 3). In B-D mean imputed expression values from individual donors (open circles) and mean values of the donor means (solid circles) are shown with SEM. Sample source information is provided in Supplementary Table 1.
Extended Data Fig. 8 |
Extended Data Fig. 8 |. CXCL17 expression in the airway and the gut.
a. Violin plots showing CXCL17 expression in airway epithelial populations of healthy donors and COVID-19 patients. *: p-value < 0.05; **: p-value < 0.01; ***: p-value < 0.001, multivariate regression between healthy and severe COVID-19 samples. b. Violin plots illustrating low expression level of CXCL17 in the gut of healthy donors. Selective expression of GPR15LG in colon and CCL25 in SI are shown for comparison. Mean imputed expression values from individual donors (open circles) and mean values of the donor means (solid circles) are shown with SEM. Sample source information is provided in Supplementary Table 1.
Extended Data Fig. 9 |
Extended Data Fig. 9 |. CXCL17 immunohistology of the human cerebellum.
a. CXCL17 immunoreactivity highlights granule neurons (g). b. Reactivity of Purkinje (P) neurons and white matter (wm) surrounding a vessel (v). Methods: Sections of formalin fixed paraffin embedded normal human cerebellum were processed for antigen retrieval and staining with monoclonal mouse IgG anti-human CXCL17 (clone 422204, R&D) using the polymerized goat anti mouse IgG ImmPRESS (peroxidase) kit. DAB shown without counterstain. Isotype control (clone G3A1 mouse IgG1, Cell Signaling) is shown as inset in A. Results representative of 3 or more sections from 2 independent donors.
Fig. 1 |
Fig. 1 |. Human GPR25 is expressed by lymphocytes in lungs, non-intestinal mucosae and CNS.
a, Expression of GPR25, GPR15 and CCR9 (black, labelled) and other class A GPCRs (grey) in total CD4/CD8 T cells from airway (combined nasal cavity, trachea, bronchus samples) versus colon (left), and in airway versus small intestine (SI) (right). b, Violin plots of GPR25, GPR15, CCR9 and CCR10 in CD4 T cell subsets in indicated target tissues. For cells from lungs, presumptive parenchymal versus bronchiolar cells are identified by expression of the genes ITGAL and ITGB2 that encode the distinguishing marker lymphocyte function-associated 1 (LFA-1). c,d, Violin plots of GPR25 in B cell (c) and innate T cell (d) subsets in indicated target tissues. Data shown are pooled from adult and paediatric donors unless specified otherwise. Mean imputed expression values from individual donors (open circles) and mean ± s.e.m. of the donor means (solid circles) are shown (n = 1–33, bd). Subsets with fewer than ten cells are not plotted. All samples were from healthy donors except: patients with primary Sjogren’s syndrome (salivary gland), combined healthy and pancreatic ductal adenocarcinoma (pancreas), healthy and cognitively impaired cerebrospinal fluid (CSF) and HSV-2 seropositive (cervix). Detailed source and meta data are shown in Supplementary Table 1. ILCP, ILC progenitor; Mem, memory.
Fig. 2 |
Fig. 2 |. GPR25 induction on innate T cells in the thymus and Treg, Teff and B cells during peripheral immune activation in human.
a, GPR25 expression by maturing innate T cells in human thymus. Left, UMAPs of postnatal thymocytes, coloured by subset and GPR25 expression. Immature CD4+CD8+ thymocytes in grey. Data from three healthy donors aged 3, 10 and 30 months. Right, violin plots showing prominent expression by NKT cells and CD8αα(II) mucosal intraepithelial lymphocyte (IEL) precursors. Means of individual donors (open circles) and mean of means (solid circles) ± s.e.m. Subset annotation and UMAP were from the original publication. b, tUMAPs of activated tonsil CD4 T cells showing GPR25 expression on differentiating CD4 cells. Cells with GPR25 expression less than 0.1 are in grey. c, tUMAPs of tonsil B cells illustrating GPR25 expression by plasmablasts (PBs) and FCRL4+ tissue-homing MBCs. Cells with GPR25 expression less than 0.05 are in grey. dg, Expression of GPR25 and CCR9 by T cells from lung-draining TLNs and SI-draining MLNs, pooled from 14 MLN and 9 TLN healthy donors. d, UMAP illustrating GPR25+CCR9, GPR25CCR9+ and GPR25+CCR9+ T cells. GPR25+ and CCR9+ were defined by expression greater than 0.1. e, Mean GPR25 expression and percentage of GPR25+ cells within T cell subsets from individual MLN and TLN donors (open circles), presented with mean of donor means (solid circles) ± s.e.m. Solid lines, comparison between different subsets within MLN (black) or TLN (red). Dashed lines, comparison of the same subset between different tissues. ***P < 0.001; NS, not significant, multivariate regression. f, Representation of subsets among MLN and TLN T cells expressing different levels of GPR25. g, Dot plots of mean GPR25 versus CCR9 expression by T cell subsets from independent MLN and TLN donors, illustrating co-expression of CCR9 and GPR25 by Treg and Teff cells in the MLN. Ellipses are 1 s.d. around mean of the replicate sample means. ag, All gene expression imputed. DN, double negative; DP, double positive; GC, germinal centre cell; TCM, central memory T cell.
Fig. 3 |
Fig. 3 |. Bioinformatic discovery of a GPR25–CXCL17 lymphocyte chemoattractant axis.
a, Schematic of GPR25 protein structure. b, Similarity of ligand binding pocket of GPR25 to that of other class A GPCRs. c, pI and MW of human secreted proteins. Chemokines (black) and ligands of interest are highlighted. Square indicates predicted pI > 8 and MW < 25 kD. d, C-terminal conservation of proteins gated in c. Top, mean BLAST bit-scores calculated from pairwise alignment of the C-terminal 6 amino acids (aa) of the human protein and orthologs in mouse, rat, rabbit, dog and cow. Square indicates BLAST score greater than 4. Bottom, C termini of CXCL17 in indicated species. Red indicates mismatch with human. e, GPR25 correlation with candidate ligands gated in d across 49 tissues assessed by bulk RNA-seq. Scaled log-transformed tissue profiles of GPR25 and CXCL17 are shown underneath. f, AlphaFold model of human 4CysCXCL17 (h4CysCXCL17; red) interaction with GPR25 (blue), illustrating insertion of C-terminal FALPL peptide of CXCL17. g, Human IgFc-4CysCXCL17 chimera (‘tracer’) binding to GPR25-expressing versus control CHO cells, and inhibition by unlabelled native 4CysCXCL17. Representative of four experiments. n = 3 per condition. h, CXCL17 activation of RhoA signalling pathway through GPR25. SRF-RE-driven luciferase reporter activity of GPR25-transfected L1.2 cells incubated with the indicated amounts of human 4CysCXCL17, mouse CXCL17 26-aa C-terminal peptide (mCXCL17 26aa C-term), human 4CysCXCL17 C-term-truncated and human GPR15LG. Sequences of CXCL17 variants are shown in Supplementary Table 5. One experiment representative of three is shown. Mean of two replicates per condition. i, Transwell chemotaxis of human GPR25-transfected L1.2 cells to indicated chemoattractants or ligands, illustrating selective migration to CXCL17 variants with intact C terminus. n = 3–6 per condition. Pooled from two or more experiments. In g and i, data are shown as mean ± s.e.m. Schematic in a was created using Biorender (https://BioRender.com). C-term, C terminus; IC50, half-maximal inhibitory concentration; MFI, mean fluorescence intensity.
Fig. 4 |
Fig. 4 |. Chemotaxis of blood lymphocytes to CXCL17.
ad, Transwell migration of blood T cells (a,b), innate lymphocytes and myeloid cells (c) and ASCs (d). PBMCs (a,c,d) or purified T cells (b) were migrated to the indicated chemoattractants for 3 h. Migrated and input subsets were quantified by flow cytometry (a,c), scRNA-seq (b) or ELISPOT (d). Data in a and c are percentage of input cells migrated above mean background in the absence of chemokine (subset-specific background migration is indicated in Extended Data Fig. 6a). Data in b and d are percentage of input T cells subsetted by GPR25 expression (b) or by immunoglobulin A (IgA) or IgG secretion that migrated to the indicated ligands (d). Representative gating and sorting strategies are summarized in Supplementary Fig. 1a–c. In a, results are pooled from four experiments, except hGPR15LG and hCCL25 (two), and h4CysCXCL17 30 nM, 1 μM and 3 μM (one). In b, results are from one blood donor but representative of two. In c and d, results are pooled from three experiments, except for hGPR15LG and CCL25 (one). Data are shown as mean (b) or mean ± s.e.m. (a,c,d), with n = 3–15. *P < 0.05, **P < 0.01, ***P < 0.001, ****P < 0.0001. One way analysis of variance (ANOVA) with Dunnet post hoc tests comparing the indicated condition versus no chemokine control (NC). DC, dendritic cell; pDC, plasmacytoid dendritic cell.
Fig. 5 |
Fig. 5 |. Subset- and tissue-selective epithelial and neuronal expression of CXCL17.
a, Pseudo-bulk expression of CXCL17 by epithelial cell subsets and other cells from various tissues (Human Protein Atlas). Data represent normalized gene expression by subsets of the indicated cell classes and are shown with means. b, Violin plots illustrating imputed expression of CXCL17, GPR15LG and CCL25 by airway epithelial cells in healthy donors, presented with means of individual donors (open circles) and mean of donor means (solid circles) ± s.e.m. (n = 1–16). Subsets with fewer than ten cells are not plotted. c, Histological localization of CXCL17 gene expression: RNAscope was performed using probes for CXCL17 (blue) and GPR15LG (red) in sections of the indicated tissues. Asterisk is adjacent to CXCL17+ alveolar epithelial cells. Arrows highlight CXCL17+ conjunctival epithelium: epithelium overlying the cornea is negative. Neurons are cerebellar granule neurons. Results are representative of three or more sections from 2–4 donor samples. Scale bars, 100 μm, except 25 μm for neurons. B, bronchus; N, nasal cavity; T, trachea; kc, keratinocytes; nTPM, normalized transcripts per million; transit epi, transitional epithelium.
Fig. 6 |
Fig. 6 |. CXCL17 and GPR25 in T cell localization to airways and upper GI, biliary and GU tracts.
a, Ratio of GPR25- to control vector-transduced donor cells recovered 1 or 7 weeks after intravenous injection into Rag1−/− mice. Normalized to mean of spleen and PLN. Representative gating strategies are summarized in Supplementary Fig. 1d. Two (1 week) or one (7 weeks) independent experiments with 7–8 recipients per timepoint. Two 7 week recipients were male. Shown with mean ± s.e.m. b, Ratio of GPR25- to control-transduced injected cells, distinguished by fluorescent labels 10–12 h after intravenous transfer. Intravascular or extravasated cells were assessed by confocal microscopy of whole mounts or sections. Fisher’s exact test was used, comparing pooled counts in tissues versus spleen in WT recipients (+P < 0.001); or comparing Cxcl17 −/− versus WT (*P < 0.05). Data are from one (gallbladder) or 3–4 experiments with one recipient per condition and experiment. Shown with mean. ce, Images of trachea (c), lymph node (d) and section of lung (e) 10–12 h after injection of approximately 1:1 GPR25 (green) and control (red) CD4 T cells. e, Arrowheads, GPR25 transductants localized to bronchus (Br). Asterisks, cells near veins (V). f, Ratio of GPR25 to control cells in 30 μm of bronchial basement membrane (Bronchi); 30 μm of or in contact with venous endothelium (Veins); or within alveolar areas (Alveoli). Each dot is the ratio in a ×10 field (about 4 mm2 per field). Data are from 2–6 fields per mouse from three independent experiments, one WT and one Cxcl17 −/− mouse per experiment. Mean ± s.e.m. g,h, Immunofluorescence quantification of endogenous T cells in lung microenvironments (g) and epithelia of indicated organs (h). Data are shown as cells per cross-sectional area of epithelia or interstitial zones from 2–5 sections per mouse, 3–4 mice per group. Mean ± s.e.m., n ≥ 9. i, CD8αβ IELs in WT versus Cxcl17 −/− mouse bronchiole or stomach. CD103+ (*); CD103 (arrows). Two-tailed t-test (a,f) and bivariate linear regression analyses (g,h). *P < 0.05; **P < 0.01; ***P < 0.001; ****P < 0.0001. Scale bars, 100 μm (c,d,e), 10 μm (i, airway) and 50 μm (i, stomach). GI, gastrointestinal; GU, genitourinary; N/A, not applicable.

References

    1. Kunkel EJ & Butcher EC Chemokines and the tissue-specific migration of lymphocytes. Immunity 16, 1–4 (2002). - PubMed
    1. Ocon B. et al. A mucosal and cutaneous chemokine ligand for the lymphocyte chemoattractant receptor GPR15. Front. Immunol 8, 1111 (2017). - PMC - PubMed
    1. Ricaño-Ponce I. et al. Refined mapping of autoimmune disease associated genetic variants with gene expression suggests an important role for non-coding RNAs. J. Autoimmun 68, 62–74 (2016). - PMC - PubMed
    1. Robinson PC et al. Genetic dissection of acute anterior uveitis reveals similarities and differences in associations observed with ankylosing spondylitis. Arthritis Rheumatol. 67, 140–151 (2015). - PMC - PubMed
    1. Habtezion A, Nguyen LP, Hadeiba H. & Butcher EC Leukocyte trafficking to the small intestine and colon. Gastroenterology 150, 340–354 (2016). - PMC - PubMed

MeSH terms