. 2024 Sep 14;100(10):fiae119.
doi: 10.1093/femsec/fiae119.

Transient hypoxia drives soil microbial community dynamics and biogeochemistry during human decomposition

Affiliations

Transient hypoxia drives soil microbial community dynamics and biogeochemistry during human decomposition

Lois S Taylor et al. FEMS Microbiol Ecol. .

Abstract

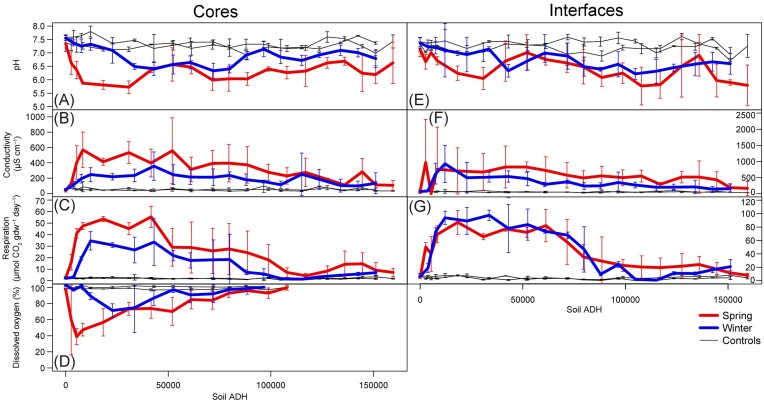
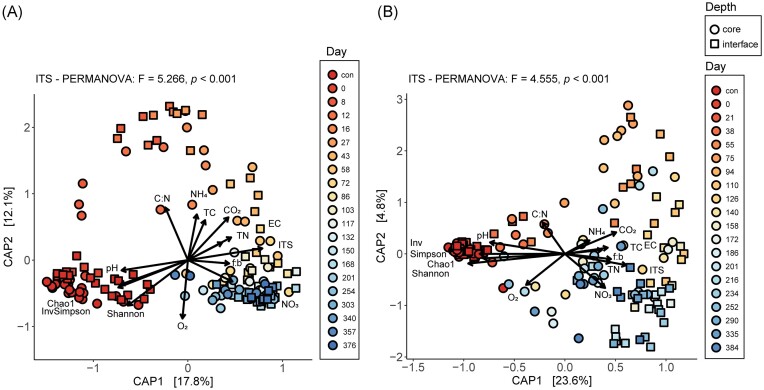
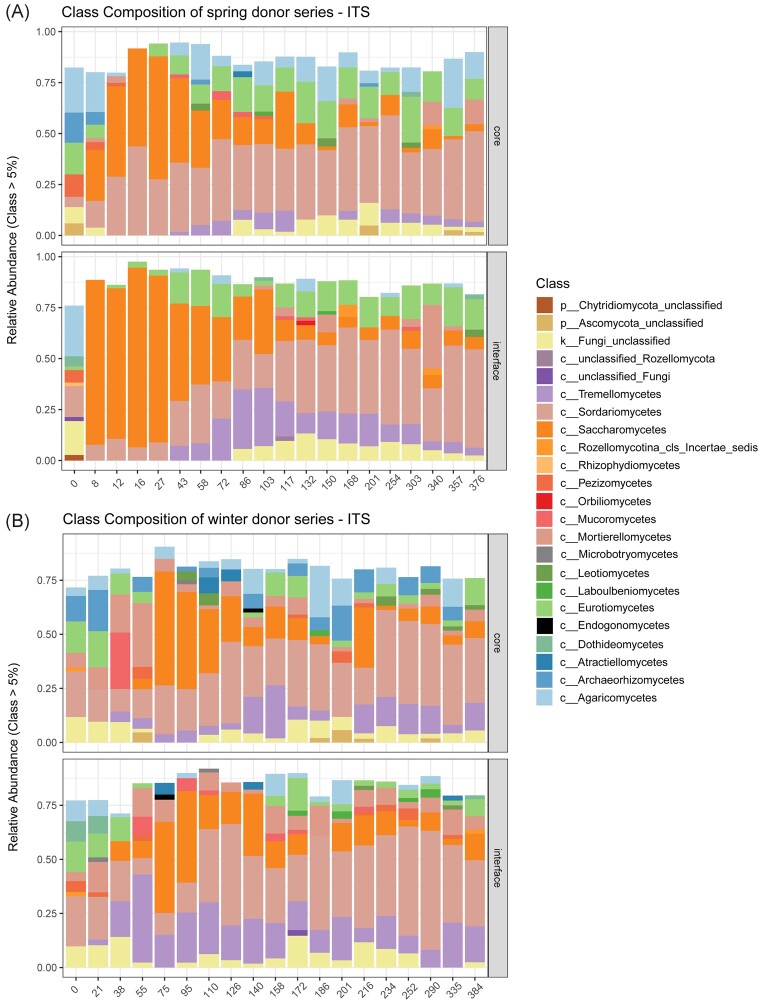
Human decomposition in terrestrial ecosystems is a dynamic process creating localized hot spots of soil microbial activity. Longer-term (beyond a few months) impacts on decomposer microbial communities are poorly characterized and do not typically connect microbial communities to biogeochemistry, limiting our understanding of decomposer communities and their functions. We performed separate year-long human decomposition trials, one starting in spring, another in winter, integrating bacterial and fungal community structure and abundances with soil physicochemistry and biogeochemistry to identify key drivers of microbial community change. In both trials, soil acidification, elevated microbial respiration, and reduced soil oxygen concentrations occurred. Changes in soil oxygen concentrations were the primary driver of microbial succession and nitrogen transformation patterns, while fungal community diversity and abundance was related to soil pH. Relative abundance of facultative anaerobic taxa (Firmicutes and Saccharomycetes) increased during the period of reduced soil oxygen. The magnitude and timing of the decomposition responses were amplified during the spring trial relative to the winter, even when corrected for thermal inputs (accumulated degree days). Further, soil chemical parameters, microbial community structure, and fungal gene abundances remained altered at the end of 1 year, suggesting longer-term impacts on soil ecosystems beyond the initial pulse of decomposition products.

Keywords: biogeochemical hotspot; forensic taphonomy; human decomposition; necrobiome; soil biogeochemistry; soil microbiology.


Conflict of interest statement

None declared.

Figures

Figure 1.
Figure 1.
Seasonal comparisons between biogeochemical variables in core and interface soils. The magnitude and timing of changes in (A and E) pH, (B and F) conductivity, (C and G) CO2, and (D) DO in core (1–16 cm) and interface (0–1 cm) soils are presented in units of equivalent thermal units based upon soil temperatures (soil ADH). Means and standard deviations are shown (n = 3).
Figure 2.
Figure 2.
Seasonal comparisons between carbon and nitrogen in core and interface soils. The magnitude and timing of changes in soil (A and F) TC (expressed as %C), (B and G) TN (%N), (C and H) NH4-N, (D and I) NO3-N, and (E and J) the carbon: nitrogen ratio in core (1–16 cm) and interface (0–1 cm) soils are presented in units of equivalent thermal units based upon soil temperatures (soil ADH). Means and standard deviations are shown (n = 3). Shaded areas correspond to the periods of reduced soil oxygen for the spring (lighter shading) and winter (darker shading).
Figure 3.
Figure 3.
Seasonal comparisons in fungal diversity in core and interface soils. The magnitude and timing of changes in (A and F) the Shannon index, (B and G) the Inverse Simpson index, (C and H) the Chao1 index, (D and I) log of gene copy number, and (E and J) the fungal:bacterial gene copy ratio in core (1–16 cm) and interface (0–1 cm) soils are presented in units of equivalent thermal units based upon soil temperatures (soil ADH). Data is based on internal transcribed spacer (ITS) sequences of fungal rRNA genes, and abundance data was calculated based on fungal gene copy numbers determined by qPCR. Means and standard deviations are shown for samples (n = 3). Controls for each time point were pooled. Shaded areas correspond to periods of reduced soil oxygen for the spring (lighter shading) and winter (darker shading).
Figure 4.
Figure 4.
CAP coordinates ordination of fungal community structures. CAP plot of Bray–Curtis dissimilarities shows changes in fungal beta diversity between study days for both the (A) spring trial and (B) winter trial. Arrows show the influence of biogeochemical and biological variables: pH, EC, soil oxygen (O2), respiration (CO2), ammonium (NH4), nitrate (NO3), TC, TN, the carbon:nitrogen ratio (C:N), Shannon diversity, Inverse Simpson diversity (InvSimpson), Chao1 diversity, log ITS gene copy number (ITS), and the fungal:bacterial ratio (f:b). Winter trial communities exhibited greater dispersion. Community structure did not fully return to initial state after 1 year in either seasonal trial. Soil depth is indicated by shape: circles (1–16 cm cores) and squares (0–1 cm interfaces). Statistical differences between controls (con) and impacted soils were evaluated by PERMANOVA.
Figure 5.
Figure 5.
Soil fungal community composition during human decomposition. Relative abundances of fungal classes comprising >5% of communities in core (1–16 cm) and interface (0–1 cm) soils shown for the (A) spring and (B) winter trial.
Figure 6.
Figure 6.
Seasonal comparisons in bacterial diversity in core and interface soils. The magnitude and timing of changes in (A and E) the Shannon index, (B and F) the Inverse Simpson index, (C and G) the Chao1 index, (D and H) and the log of gene copy number in core (1–16 cm) and interface (0–1 cm) soils are presented in units of equivalent thermal units based upon soil temperatures (soil ADH). Data is based on 16S sequences of bacterial rRNA genes, and abundance data was calculated based on bacterial gene copy numbers determined by qPCR. Means and standard deviations are shown for samples (n = 3). Controls for each time point were pooled. Shaded areas correspond to periods of reduced soil oxygen for the spring (light shading) and winter (darker shading).
Figure 7.
Figure 7.
CAP coordinates ordination of bacterial community structures. CAP plot of Bray–Curtis dissimilarities shows changes in bacterial beta diversity between study days for both the (A) spring trial and (B) winter trial. Arrows show the influence of biogeochemical and biological variables: pH, EC, soil oxygen (O2), respiration (CO2), ammonium (NH4), nitrate (NO3), TC, TN, the carbon:nitrogen ratio (C:N), Shannon diversity, Inverse Simpson diversity (InvSimpson), Chao1 diversity, log 16S gene copy number (16S), and the fungal:bacterial ratio (f:b). Winter trial communities exhibited greater dispersion. Depth effects are evidenced by greater community dispersion in interface soils (0–1 cm). Soil depth is indicated by shape: circles (1–16 cm cores) and squares (0–1 cm interfaces). Statistical differences between controls (con) and impacted soils were evaluated by PERMANOVA.
Figure 8.
Figure 8.
Soil bacterial community composition during human decomposition. Relative abundances of classes comprising >5% of communities in 1–16 cm cores and 0–1 cm interfaces for the (A) spring and (B) winter trials.

Similar articles

Cited by

References

    1. Abarenkov K, Zirk A, Piirmann T et al. Full mothur UNITE+INSD dataset 1. Version 04.02.2020. Mothur, 2020.
    1. Adserias-Garriga J, Hernandez M, Quijada NM et al. Daily thanatomicrobiome changes in soil as an approach of postmortem interval estimation: an ecological perspective. Forensic Sci Int. 2017;278:388–95. 10.1016/j.forsciint.2017.07.017. - DOI - PubMed
    1. Aitkenhead-Peterson JA, Owings CG, Alexander MB et al. Mapping the lateral extent of human cadaver decomposition with soil chemistry. Forensic Sci Int. 2012;216:127–34. 10.1016/j.forsciint.2011.09.007. - DOI - PubMed
    1. Anderson B, Meyer J, Carter DO. Dynamics of ninhydrin-reactive nitrogen and pH in gravesoil during the extended postmortem interval. J Forensic Sci. 2013;58:1348–52. 10.1111/1556-4029.12230. - DOI - PubMed
    1. Apprill A, McNally S, Parsons R et al. Minor revision to V4 region SSU rRNA 806R gene primer greatly increases detection of SAR11 bacterioplankton. Aquat Microb Ecol. 2015;75:129–37. 10.3354/ame01753. - DOI