. 2024 Sep 18;7(11):e202402880.
doi: 10.26508/lsa.202402880. Print 2024 Nov.

Ccrk-Mak/Ick signaling is a ciliary transport regulator essential for retinal photoreceptor survival

Affiliations

Ccrk-Mak/Ick signaling is a ciliary transport regulator essential for retinal photoreceptor survival

Taro Chaya et al. Life Sci Alliance. .

Abstract

Primary cilia are microtubule-based sensory organelles whose dysfunction causes ciliopathies in humans. The formation, function, and maintenance of primary cilia depend crucially on intraflagellar transport (IFT); however, the regulatory mechanisms of IFT at ciliary tips are poorly understood. Here, we identified that the ciliopathy kinase Mak is a ciliary tip-localized IFT regulator that cooperatively acts with the ciliopathy kinase Ick, an IFT regulator. Simultaneous disruption of Mak and Ick resulted in loss of photoreceptor ciliary axonemes and severe retinal degeneration. Gene delivery of Ick and pharmacological inhibition of FGF receptors, Ick negative regulators, ameliorated retinal degeneration in Mak -/- mice. We also identified that Ccrk kinase is an upstream activator of Mak and Ick in retinal photoreceptor cells. Furthermore, the overexpression of Mak, Ick, and Ccrk and pharmacological inhibition of FGF receptors suppressed ciliopathy-related phenotypes caused by cytoplasmic dynein inhibition in cultured cells. Collectively, our results show that the Ccrk-Mak/Ick axis is an IFT regulator essential for retinal photoreceptor maintenance and present activation of Ick as a potential therapeutic approach for retinitis pigmentosa caused by MAK mutations.


Conflict of interest statement

T Chaya and T Furukawa are inventors on a patent application related to this work filed by the Osaka University.

Figures

Figure S1.
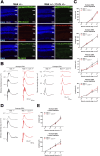
Figure S1.. Phenotypic analysis of the retina from Ick CKO mice at 1 mo.
(A) Immunostaining of retinal sections from the control and Ick CKO mice using anti-Ick and anti-acetylated α-tubulin (Actub) (a marker for the ciliary axoneme) antibodies. Ick signals were detected at the distal region of ciliary axonemes in photoreceptor cells of the control retina but not of the Ick CKO retina. (B) Ciliary localization of IFT components in photoreceptor cells of the Ick CKO retina. Retinal sections obtained from the control and Ick CKO mice were immunostained using antibodies against IFT88 (an IFT-B component), IFT140 (an IFT-A component), and Actub. (C) Immunostaining of retinal sections from the control and Ick CKO mice using marker antibodies against Rhodopsin (rod outer segments), S-opsin (S-cone outer segments), and M-opsin (M-cone outer segments). (D, E) ERG analysis of Ick CKO mice. (D) Representative scotopic and photopic ERGs elicited by four different stimulus intensities (−4.0 to 1.0 log cd s/m2 and −0.5 to 1.0 log cd s/m2, respectively) from the control and Ick CKO mice. (E) Scotopic and photopic amplitudes of a- and b-waves are shown as a function of the stimulus intensity. Data are presented as the mean ± SD. The amplitudes of a- and b-waves were not significantly different between the control and Ick CKO mice (unpaired t test). n = 6 and 4 mice (control and Ick CKO, respectively). Nuclei were stained with DAPI. OS, outer segment; IS, inner segment; ONL, outer nuclear layer; INL, inner nuclear layer; GCL, ganglion cell layer.
Figure S2.
Figure S2.. Phenotypic analysis of the retina from Ick CKO mice at 6 mo.
(A, B, C) Measurement of retinal thickness in the control and Ick CKO mice at P14, 1 mo, and 6 mo. (A) Toluidine blue staining of retinal sections from the control and Ick CKO mice at P14, 1 mo, and 6 mo. (B) ONL thickness was measured. Data are presented as the mean ± SD. *P < 0.05, **P < 0.01, ***P < 0.001 (unpaired t test). n = 4 and 5 mice at P14, n = 6 and 4 mice at 1 mo (control and Ick CKO, respectively), and n = 4 mice per each genotype at 6 mo. (C) Relative ONL thickness was expressed as a proportion of the ONL thickness to the INL+IPL+GCL thickness. Data are presented as the mean ± SD. ***P < 0.001 (unpaired t test). n = 4 and 5 mice at P14, n = 6 and 4 mice at 1 mo (control and Ick CKO, respectively), and n = 4 mice per each genotype at 6 mo. (D) Immunostaining of retinal sections from the control and Ick CKO mice using marker antibodies against Rhodopsin, S-opsin, and M-opsin. Nuclei were stained with DAPI. Arrowheads indicate mislocalization of M-opsin to the OPL in the Ick CKO retina. (E, F) ERG analysis of Ick CKO mice. (E) Representative scotopic and photopic ERGs elicited by four different stimulus intensities (−4.0 to 1.0 log cd s/m2 and −0.5 to 1.0 log cd s/m2, respectively) from the control and Ick CKO mice. (F) Scotopic and photopic amplitudes of a- and b-waves are shown as a function of the stimulus intensity. Data are presented as the mean ± SD. *P < 0.05, **P < 0.01, ***P < 0.001 (unpaired t test). n = 4 mice per each genotype. OS, outer segment; ONL, outer nuclear layer; OPL, outer plexiform layer; INL, inner nuclear layer; IPL, inner plexiform layer; GCL, ganglion cell layer.
Figure 1.
Figure 1.. Ciliary localization of IFT components is changed by Mak overexpression or knockout.
(A) Schematic diagrams of the experimental workflow for the screening of serine–threonine kinase(s) other than Ick that function as IFT regulators in retinal photoreceptor cells. (B) Subcellular localization of Ick and nine serine–threonine kinases that are close to Ick in the phylogenetic tree of the human kinome. A plasmid encoding a FLAG-tagged Ick, Mak, Mok, Cdkl1, Cdkl2, Cdkl3, Cdkl4, Cdkl5, Gsk3a, or Gsk3b was transfected into NIH3T3 cells. Cells were immunostained with anti-FLAG and anti-Actub antibodies. Arrowheads indicate ciliary tips. (C, D) Effects of Mak and Ick overexpression on ciliary localization of IFT57. (C) FLAG-tagged EGFP or IFT57 expression plasmid was co-transfected into NIH3T3 cells with a plasmid expressing Mak or Ick. Cells were immunostained with anti-FLAG and anti-Actub antibodies. Arrowheads indicate ciliary tips. (D) Number of cilia with the FLAG-tagged EGFP or IFT57 predominantly localized at ciliary tips was counted. Data are presented as the mean ± SD. ****P < 0.0001 (two-way ANOVA followed by Tukey’s multiple comparisons test). n = 3 experiments. (E, F) Effects of Mak and Ick overexpression on ciliary localization of IFT88. (E) FLAG-tagged EGFP or IFT88 expression plasmid was co-transfected into NIH3T3 cells with a plasmid expressing Mak or Ick. Cells were immunostained with anti-FLAG and anti-Actub antibodies. Arrowheads indicate ciliary tips. (F) Number of cilia with the FLAG-tagged EGFP or IFT88 predominantly localized at ciliary tips was counted. Data are presented as the mean ± SD. ***P < 0.001, ****P < 0.0001 (two-way ANOVA followed by Tukey’s multiple comparisons test). n = 3 experiments. (G) Ciliary localization of IFT components in photoreceptor cells of the Mak−/− mouse retina. Retinal sections obtained from Mak+/+ and Mak−/− mice at 1 mo were immunostained using antibodies against IFT88, IFT140, and Actub. IFT components were concentrated at the tips of photoreceptor connecting cilia in the Mak−/− retina (arrowheads). OS, outer segment; IS, inner segment; ONL, outer nuclear layer. (H) Kif3a phosphorylation in the Mak+/+ and Mak−/− retina. The retinal lysates were analyzed by Phos-tag (blue box) and conventional (black box) Western blotting using an anti-Kif3a antibody. The level of Kif3a phosphorylation presented as the ratio of the upper band intensity (white arrowhead) to the lower band intensity (black arrowhead) decreased in the Mak−/− retina compared with that in the Mak+/+ retina. Nuclei were stained with DAPI.
Figure S3.
Figure S3.. Effects of Cdkl5 and Mak overexpression on ciliary localization of IFT components, and ERG analysis of Cdkl5−/Y mice.
(A) Effects of Cdkl5, Mak, and Ick overexpression on ciliary localization of IFT57. A FLAG-tagged IFT57 expression plasmid was co-transfected into NIH3T3 cells with a plasmid expressing Cdkl5, Mak, or Ick. Cells were immunostained with anti-FLAG and anti-Actub antibodies. Arrowheads indicate ciliary tips. IFT57 localization to the ciliary tips increased by Mak or Ick but not Cdkl5 overexpression. (B) RT–PCR analysis of the Cdkl5 transcript in mouse tissues at 4 wk. β-Actin was used as a loading control. (C) ERG analysis of Cdkl5−/Y mice. Representative scotopic and photopic ERGs elicited by four different stimulus intensities (−4.0 to 1.0 log cd s/m2 and −0.5 to 1.0 log cd s/m2, respectively) from Cdkl5+/Y and Cdkl5−/Y mice at 1 and 3 mo are shown. There were no substantial differences between Cdkl5+/Y and Cdkl5−/Y mice. (D) Effects of Mak and Ick overexpression on ciliary localization of IFT140. A FLAG-tagged EGFP or IFT140 expression plasmid was co-transfected into NIH3T3 cells with a plasmid expressing Mak or Ick. Arrowheads indicate ciliary tips. IFT140 localization to the ciliary base increased by Mak or Ick overexpression. (E) Effects of Mak and Ick overexpression on ciliary localization of BBS8. A FLAG-tagged EGFP or BBS8 expression plasmid was co-transfected into NIH3T3 cells with a plasmid expressing Mak or Ick. Arrowheads indicate ciliary tips. There were no substantial differences in the ciliary localization of BBS8 among control, and Mak- and Ick-overexpressing cells. (F, G) Effects of human MAK and ICK overexpression on ciliary localization of IFT57. (F) FLAG-tagged EGFP or IFT57 expression plasmid was co-transfected into NIH3T3 cells with a plasmid expressing human MAK or ICK. Cells were immunostained with anti-FLAG and anti-Actub antibodies. Arrowheads indicate ciliary tips. (G) Number of cilia with the FLAG-tagged EGFP or IFT57 predominantly localized at ciliary tips was counted. Data are presented as the mean ± SD. ****P < 0.0001 (two-way ANOVA followed by Tukey’s multiple comparisons test). n = 3 experiments. Nuclei were stained with DAPI.
Figure 2.
Figure 2.. Severe progressive retinal degeneration in Mak Ick DKO mice.
(A, B) Toluidine blue staining of retinal sections from the control, Mak−/−, and Mak Ick DKO mice at P14 and 1 mo. The ONL thickness was measured. Data are presented as the mean ± SD. *P < 0.05, ***P < 0.001, ****P < 0.0001 (one-way ANOVA followed by Tukey’s multiple comparisons test). n = 4 mice per each genotype. (C) Immunostaining of retinal sections from the control, Mak−/−, and Mak Ick DKO mice at P14 using marker antibodies against Rhodopsin, S-opsin, and M-opsin. Severe photoreceptor outer segment disorganization and mislocalization of Rhodopsin and cone opsins were observed in the Mak Ick DKO retina. (D) Ciliary localization of IFT components in photoreceptor cells of the Mak Ick DKO retina. Retinal sections obtained from the control, Mak−/−, and Mak Ick DKO mice at P14 were immunostained using antibodies against IFT88, Actub, and γ-tubulin (γTub) (a marker for basal bodies). The ciliary axoneme of retinal photoreceptor cells was absent in Mak Ick DKO mice. (E) Longitudinal profiles of the connecting cilia in the P14 control and Mak Ick DKO photoreceptors observed by electron microscopy. Arrowheads indicate basal bodies. Connecting cilia were absent in the Mak Ick DKO retina. (F) Schematic representation of retinal photoreceptor cilia in the control and Mak Ick DKO mice. Although basal bodies were observed, ciliary axonemes and outer segments were not observed in the Mak Ick DKO retina. (G, H) ERG analysis of Mak Ick DKO mice. (G) Representative scotopic and photopic ERGs elicited by four different stimulus intensities (−4.0 to 1.0 log cd s/m2 and −0.5 to 1.0 log cd s/m2, respectively) from the control, Mak−/−, and Mak Ick DKO mice at 1 mo. (H) Scotopic and photopic amplitudes of a- and b-waves are shown as a function of the stimulus intensity. Data are presented as the mean ± SD. One-way ANOVA followed by Tukey’s multiple comparisons test, Control versus Mak−/− indicated by asterisks, *P < 0.05, **P < 0.01, ***P < 0.001, ****P < 0.0001, and Mak−/− versus Mak Ick DKO indicated by hash symbols, #P < 0.05, ##P < 0.01, ###P < 0.001, ####P < 0.0001, n = 4, 4, and 3 mice (control, Mak−/−, and Mak Ick DKO, respectively). Nuclei were stained with DAPI. OS, outer segment; IS, inner segment; ONL, outer nuclear layer; INL, inner nuclear layer; GCL, ganglion cell layer.
Figure S4.
Figure S4.. Histological analysis of the Mak Ick DKO mouse retina.
(A) Immunostaining of retinal sections from the control, Mak−/−, and Mak Ick DKO mice at 1 mo using marker antibodies against Rhodopsin, S-opsin, and M-opsin. Severe photoreceptor degeneration was observed in the Mak Ick DKO retina. (B) Ciliary formation in photoreceptor cells of the Mak Ick DKO retina. Retinal sections obtained from the control, Mak−/−, and Mak Ick DKO mice at P9 and P14 were immunostained using antibodies against pericentrin (a marker for basal bodies) and Actub. Nuclei were stained with DAPI. OS, outer segment; IS, inner segment; ONL, outer nuclear layer; INL, inner nuclear layer; GCL, ganglion cell layer.
Figure 3.
Figure 3.. Ick haploinsufficiency exacerbates retinal degeneration caused by loss of Mak.
(A) Uniform Manifold Approximation and Projection visualization of retinal cells in adult human retinas. (B) Feature plots showing the expression of MAK and ICK in retinal cells of adult human retinas. (C, D) Toluidine blue staining of retinal sections from Mak+/−, Mak−/−, and Mak−/−; Ick+/− mice at 2 mo. The ONL thickness was measured. Data are presented as the mean ± SD. *P < 0.05 (unpaired t test). n = 5, 3, and 7 mice (Mak+/−, Mak−/−, and Mak−/−; Ick+/−, respectively). The blue dotted line indicates the ONL thickness in the Mak+/− retina. (E, F) Immunostaining of retinal sections from Mak+/−, Mak−/−, and Mak−/−; Ick+/− mice at 2 mo using marker antibodies against Rhodopsin, S-opsin, and M-opsin. Nuclei were stained with DAPI. The rod outer segment length was measured. Data are presented as the mean ± SD. *P < 0.05 (unpaired t test). n = 4, 3, and 5 mice (Mak+/−, Mak−/−, and Mak−/−; Ick+/−, respectively). The blue dotted line indicates the rod outer segment length in the Mak+/− retina. (G, H) ERG analysis of Mak−/−; Ick+/− mice at 2 mo. (G) Representative scotopic and photopic ERGs elicited by four different stimulus intensities (−4.0 to 1.0 log cd s/m2 and −0.5 to 1.0 log cd s/m2, respectively) from Mak+/−, Mak−/−, and Mak−/−; Ick+/− mice. (H) Scotopic and photopic amplitudes of a- and b-waves are shown as a function of the stimulus intensity. Data are presented as the mean ± SD. *P < 0.05, **P < 0.01 (unpaired t test). n = 5, 3, and 6 mice (Mak+/−, Mak−/−, and Mak−/−; Ick+/−, respectively). OS, outer segment; ONL, outer nuclear layer; INL, inner nuclear layer; GCL, ganglion cell layer.
Figure S5.
Figure S5.. Phenotypic analysis of the Mak+/−; Ick+/− mouse retina.
(A) RT–PCR analysis of the MAK and ICK transcripts in the human retina. β-Actin was used as a loading control. (B, C) Toluidine blue staining of retinal sections from Mak+/+; Ick+/+ and Mak+/−; Ick+/− mice at 6 mo. Data are presented as the mean ± SD. ns, not significant (unpaired t test). n = 4 and 3 mice (Mak+/+; Ick+/+ and Mak+/−; Ick+/−, respectively). (D) Immunostaining of retinal sections from Mak+/+; Ick+/+ and Mak+/−; Ick+/− mice at 6 mo using marker antibodies against Rhodopsin, S-opsin, and M-opsin. (E, F) ERG analysis of Mak+/−; Ick+/− mice at 6 mo. (E) Representative scotopic and photopic ERGs elicited by four different stimulus intensities (−4.0 to 1.0 log cd s/m2 and −0.5 to 1.0 log cd s/m2, respectively) from Mak+/+; Ick+/+ and Mak+/−; Ick+/− mice. (F) Scotopic and photopic amplitudes of a- and b-waves are shown as a function of the stimulus intensity. Data are presented as the mean ± SD. The amplitudes of a- and b-waves were not significantly different between Mak+/+; Ick+/+ and Mak+/−; Ick+/− mice (unpaired t test). n = 4 and 3 mice (Mak+/+; Ick+/+ and Mak+/−; Ick+/−, respectively). Nuclei were stained with DAPI. OS, outer segment; ONL, outer nuclear layer; INL, inner nuclear layer; GCL, ganglion cell layer.
Figure 4.
Figure 4.. Activation of Mak and Ick can rescue the abnormalities caused by Ick, Mak, and Dync2li1 deficiency.
(A, B, C) Effects of Mak overexpression on ciliary defects in Ick−/− MEFs. (A) Plasmid encoding a FLAG-tagged EGFP, Ick, Mak isoform1 (Mak iso1), or Mak isoform2 (Mak iso2) was transfected into Ick−/− MEFs. Cells were immunostained with anti-FLAG and anti-Actub antibodies. (B, C) Numbers (B) and length (C) of the cilia stained with an antibody against Actub in FLAG-positive cells were measured. Data are presented as the mean ± SD. ***P < 0.001, ****P < 0.0001 (one-way ANOVA followed by Tukey’s multiple comparisons test). n = 3 experiments. (D, E, F) Subcellular localization of Rhodopsin in Ick-overexpressing photoreceptor cells of the Mak−/− mouse retina. (D) Schematic diagram of schedule for AAV subretinal injection and harvest of retinas. An AAV expressing FLAG-tagged Ick driven by the Rhodopsin kinase promoter was injected into P1 Mak−/− mouse retinas. At P14, their retinas were harvested, sectioned, and immunostained with anti-FLAG and anti-Rhodopsin antibodies. (E) Rhodopsin signals in the inner part of photoreceptors decreased in FLAG-positive regions. (F) Immunofluorescence signals of Rhodopsin detected in the inner part of photoreceptors were quantified using ImageJ software. The signals of Rhodopsin in the inner part of photoreceptors were normalized to the total (OS + the inner part) signals of Rhodopsin in photoreceptors. Rhodopsin signals in the inner part (normalized to the total signals) of FLAG-positive regions relative to those of FLAG-negative regions were then calculated. Data are presented as the mean ± SD. **P < 0.01 (unpaired t test). n = 5 retinas from four mice. (G) Schematic diagram of schedule for drug administration. BGJ398, an inhibitor of Fgfrs, was injected into Mak−/− mice from P7 to 1 mo every day. s.c., subcutaneous. (H, I) Toluidine blue staining of retinal sections from 1 mo Mak−/− mice treated with or without BGJ398, which was injected into the mice from P7 to 1 mo every day. Data are presented as the mean ± SD. **P < 0.01 (unpaired t test). n = 10 mice each. (J) ERG analysis of 1 mo Mak−/− mice treated with or without BGJ398, which was injected into the mice from P7 to 1 mo every day. The scotopic and photopic amplitudes of a- and b-waves are shown as a function of the stimulus intensity (−4.0 to 1.0 log cd s/m2 and −0.5 to 1.0 log cd s/m2, respectively). Data are presented as the mean ± SD. *P < 0.05, **P < 0.01 (unpaired t test). n = 6 mice each (scotopic), n = 5 and 6 mice (photopic) (vehicle-treated and BGJ398-treated, respectively). (K, L) Kif3a phosphorylation in the retina of 1 mo Mak−/− mice treated with or without BGJ398, which was injected into the mice from P7 to 1 mo every day. (K) Retinal lysates were analyzed by Phos-tag (blue box) and conventional (black box) Western blotting with the anti-Kif3a antibody. (L) Relative phosphorylation of Kif3a was quantified by the ratio of the upper band intensity (white arrowhead) to the lower band intensity (black arrowhead). Data are presented as the mean ± SD. *P < 0.05 (unpaired t test). n = 4 mice each. (M, N) Effects of Ick overexpression on ciliary length in cells knocked down for Dync2li1. (M) Plasmid encoding Control-shRNA or Dync2li1-shRNA3 was co-transfected into NIH3T3 cells with or without a plasmid expressing Ick in combination with a construct encoding FLAG-tagged EGFP. Cells were immunostained with anti-FLAG and anti-Actub antibodies. (N) Length of cilia stained with an antibody against Actub in FLAG-positive cells was measured. Data are presented as the mean ± SD. **P < 0.01, ****P < 0.0001, ns, not significant (two-way ANOVA followed by Tukey’s multiple comparisons test). Control-shRNA; Control, Control-shRNA; Ick, Dync2li1-shRNA3; Control, and Dync2li1-shRNA3; Ick, n = 66, 63, 67, and 70 cilia, respectively, from three experiments. (O, P) Effects of BGJ398 treatment on ciliary length in cells knocked down for Dync2li1. (O) NIH3T3 cells transfected with plasmids expressing FLAG-tagged EGFP and Control-shRNA or Dync2li1-shRNA3 were treated with 100 nM BGJ398 or DMSO for 24 h before harvest. Cells were immunostained with anti-FLAG and anti-Actub antibodies. (P) Length of cilia stained with an antibody against Actub in FLAG-positive cells was measured. Data are presented as the mean ± SD. **P < 0.01, ****P < 0.0001, ns, not significant (two-way ANOVA followed by Tukey’s multiple comparisons test). Control-shRNA; DMSO, Control-shRNA; BGJ398, Dync2li1-shRNA3; DMSO, and Dync2li1-shRNA3; BGJ398, n = 71, 70, 74, and 73 cilia, respectively, from three experiments. (Q, R, S) Luciferase reporter gene assay using 8x Gli1-binding sites–minimal promoter–NanoLuc luciferase constructs. (Q) Schematic diagram of the construct expressing NanoLuc luciferase under the control of 8x Gli1-binding sites and minimal promoter. (R, S) NIH3T3 cells were transfected with plasmids expressing Dync2li1-shRNA2 and Ick (R), Mak iso1, or Mak iso2 (S) along with a NanoLuc luciferase reporter construct driven by the 8x Gli1-binding sites and minimal promoter and a Firefly luciferase–expressing construct driven by the SV40 promoter and enhancer. Luciferase activities of cell lysates were measured 24 h after serum starvation with 100 nM smoothened agonist (SAG). NanoLuc luciferase activity was normalized to Firefly luciferase activity. Data are presented as the mean ± SD. *P < 0.05, **P < 0.01, ***P < 0.001, ns, not significant (two-way ANOVA followed by Tukey’s multiple comparisons test). n = 3 (R) and n = 4 (S) experiments. Nuclei were stained with DAPI. OS, outer segment; ONL, outer nuclear layer; INL, inner nuclear layer; GCL, ganglion cell layer.
Figure S6.
Figure S6.. Retinal phenotypes in the mice treated with an Fgfr inhibitor, and effects of Ick overexpression on ciliary abnormities caused by cytoplasmic dynein inhibition.
(A) Schematic diagram of schedule for drug administration. BGJ398 was injected into Mak Ick DKO and Mak+/+ mice from P7 to 1 mo every day. s.c., subcutaneous. (B, C) Toluidine blue staining of retinal sections from 1 mo Mak Ick DKO mice treated with or without BGJ398, which was injected into the mice from P7 to 1 mo every day. Data are presented as the mean ± SD. ns, not significant (unpaired t test). n = 5 and 6 mice (vehicle-treated and BGJ398-treated, respectively). (D) ERG analysis of 1 mo Mak Ick DKO mice treated with BGJ398, which was injected into the mice from P7 to 1 mo every day. Representative scotopic ERGs elicited by two different stimulus intensities (−1.0 and 1.0 log cd s/m2) from 1 mo Mak Ick DKO mice treated with or without BGJ398 are shown. There were no substantial differences between vehicle-treated and BGJ398-treated Mak Ick DKO mice. (E, F) Toluidine blue staining of retinal sections from 1 mo Mak+/+ mice treated with or without BGJ398, which was injected into the mice from P7 to 1 mo every day. Data are presented as the mean ± SD. ns, not significant (unpaired t test). n = 5 and 6 mice (vehicle-treated and BGJ398-treated, respectively). (G) ERG analysis of 1 mo Mak+/+ mice treated with or without BGJ398, which was injected into the mice from P7 to 1 mo every day. The scotopic and photopic amplitudes of a- and b-waves are shown as a function of the stimulus intensity (−4.0 to 1.0 log cd s/m2 and −0.5 to 1.0 log cd s/m2, respectively). Data are presented as the mean ± SD. *P < 0.05 (unpaired t test). n = 5 and 6 mice (vehicle-treated and BGJ398-treated, respectively). (H, I) Effects of Ick overexpression on cilia in cells treated with a cytoplasmic dynein inhibitor. (H) NIH3T3 cells transfected with a plasmid expressing FLAG-tagged EGFP or Ick were treated with 10 μM Ciliobrevin D or DMSO for 24 h before harvest. Cells were immunostained with anti-FLAG and anti-Actub antibodies. (I) Number of cilia stained with an antibody against Actub in FLAG-positive cells was counted. Data are presented as the mean ± SD. *P < 0.05, ****P < 0.0001, ns, not significant (two-way ANOVA followed by Tukey’s multiple comparisons test). n = 5 experiments. (J) Inhibition efficacy of shRNA expression constructs for Dync2li1 knockdown. A plasmid encoding Control-shRNA, Dync2li1-shRNA2, Dync2li1-shRNA3, Dync2li1-shRNA5, or Dync2li1-shRNA6 was co-transfected with plasmids expressing a FLAG-tagged Dync2li1 and a GFP into HEK293T cells. Western blot analysis was performed using anti-FLAG and anti-GFP antibodies. GFP was used as an internal transfection control. Dync2li1-shRNA2, Dync2li1-shRNA3, Dync2li1-shRNA5, and Dync2li1-shRNA6 suppressed Dync2li1 expression. (K, L) Effects of Ick overexpression on ciliary length in cells knocked down for Dync2li1. (K) Plasmid encoding Control-shRNA or Dync2li1-shRNA5 expression plasmid was co-transfected into NIH3T3 cells with or without a plasmid expressing Ick in combination with a construct encoding FLAG-tagged EGFP. Cells were immunostained with anti-FLAG and anti-Actub antibodies. (L) Length of cilia stained with an antibody against Actub in FLAG-positive cells was measured. Data are presented as the mean ± SD. *P < 0.05, ***P < 0.001, ns, not significant (two-way ANOVA followed by Tukey’s multiple comparisons test). Control-shRNA; Control, Control-shRNA; Ick, Dync2li1-shRNA5; Control, and Dync2li1-shRNA5; Ick, n = 79, 77, 78, and 78 cilia, respectively, from three experiments. (M) Luciferase reporter gene assay using 8x Gli1-binding sites–minimal promoter–NanoLuc luciferase constructs. NIH3T3 cells were transfected with a plasmid expressing Control-shRNA, Dync2li1-shRNA3, or Dync2li1-shRNA6 along with a NanoLuc luciferase reporter construct driven by the 8x Gli1-binding sites and minimal promoter and a Firefly luciferase–expressing construct driven by the SV40 promoter and enhancer. Luciferase activities of cell lysates were measured 24 h after serum starvation with 100 nM SAG. NanoLuc luciferase activity was normalized to Firefly luciferase activity. Data are presented as the mean ± SD. *P < 0.05, **P < 0.01 (one-way ANOVA followed by Tukey’s multiple comparisons test). n = 3 experiments. Nuclei were stained with DAPI. ONL, outer nuclear layer; INL, inner nuclear layer; GCL, ganglion cell layer.
Figure 5.
Figure 5.. Severe progressive retinal degeneration in Ccrk CKO mice.
(A) Thr-157 in the Mak and Ick proteins. (Upper panel) Predicted 3D structures of the kinase domains of the Mak and Ick proteins and a superposition of their structures are shown. (Lower panel) Structure-based sequence alignment of the Mak and Ick proteins prepared with ESPript. Similar and identical residues are marked by yellow and red boxes, respectively. The secondary structure assignment is based on the predicted structure of Mak. A green arrow indicates Thr-157. (B) Western blot analysis of the phosphorylated Mak Thr-157 (pMak) and Mak protein in Mak+/+ and Mak−/− retinas. (C) Kif3a phosphorylation in Ick-overexpressing cells. A plasmid encoding a FLAG-tagged EGFP, wild-type Ick (Ick-WT), Ick harboring a Thr-to-Ala mutation at residue 157 (Ick-T157A), or Ick harboring a Lys-to-Arg mutation at residue 33 (Ick-kinase dead [KD]) was transfected into NIH3T3 cells. Cells were immunostained with anti-FLAG and anti-phosphorylated Kif3a Thr-674 (pKif3a) antibodies. Substantial cytoplasmic pKif3a signals were observed in cells expressing Ick-WT but not in those expressing EGFP, Ick-T157A, or Ick-KD. (D) Schematic diagram summarizing search for kinase(s) phosphorylating Mak and Ick Thr-157. (E) Feature plots showing the expression of CCRK and BROMI in retinal cells of adult human retinas. (F, G) Toluidine blue staining of retinal sections from the control and Ccrk CKO mice at P14 and 1 mo. The ONL thickness was measured. Data are presented as the mean ± SD. **P < 0.01, ***P < 0.001 (unpaired t test). n = 4 mice per each genotype at P14 and n = 3 mice per each genotype at 1 mo. (H) Immunostaining of retinal sections from the control and Ccrk CKO mice at P14 using marker antibodies against Rhodopsin, S-opsin, and M-opsin. Severe photoreceptor outer segment disorganization and mislocalization of Rhodopsin and cone opsins were observed in the Ccrk CKO retina. (I) Ciliary localization of IFT components in photoreceptor cells of the Ccrk CKO retina. Retinal sections obtained from the control and Ccrk CKO mice at P14 were immunostained using antibodies against IFT88, Actub, Mak, and Cep164 (a marker for basal bodies). The ciliary axoneme of retinal photoreceptor cells was absent in Ccrk CKO mice. (J) Schematic representation of retinal photoreceptor cilia in the control and Ccrk CKO mice. Although basal bodies were observed, ciliary axonemes and outer segments were not observed in the Ccrk CKO retina. (K) ERG analysis of Ccrk CKO mice. Scotopic and photopic ERGs elicited by four different stimulus intensities (−4.0 to 1.0 log cd s/m2 and −0.5 to 1.0 log cd s/m2, respectively) from the control and Ccrk CKO mice at 1 mo. The scotopic and photopic amplitudes of a- and b-waves are shown as a function of the stimulus intensity. Data are presented as the mean ± SD. *P < 0.05, **P < 0.01, ***P < 0.001 (unpaired t test). n = 3 mice per each genotype. (L) Western blot analysis of pMak and the Mak protein in the control and Ccrk CKO retinas. (M) Schematic diagram of schedule for tamoxifen administration and analysis of mice. Mice were injected with tamoxifen at 1 mo and analyzed at 2 mo. (N, O) Toluidine blue staining of retinal sections from the control and Ccrk iCKO mice at 2 mo. The ONL thickness was measured. Data are presented as the mean ± SD. ns, not significant (unpaired t test). n = 6 and 3 mice (control and Ccrk iCKO, respectively). Nuclei were stained with DAPI. OS, outer segment; IS, inner segment; ONL, outer nuclear layer; INL, inner nuclear layer; GCL, ganglion cell layer.
Figure S7.
Figure S7.. Generation and phenotypic analysis of Ccrk CKO and iCKO mice.
(A) RT–PCR analysis of the Ccrk and Bromi transcripts in mouse tissues at 4 wk. β-Actin was used as a loading control. (B) RT–PCR analysis of the CCRK and BROMI transcripts in the human retina. β-Actin was used as a loading control. (C) In situ hybridization analysis of Ccrk in the P14 mouse retina. The Ccrk signal was detected in the ONL. (D) Schematic representation of the WT allele, targeting vector, Ccrk recombinant allele, Flp recombinant allele, and Cre recombinant allele. Blue and purple arrows indicate primer sets to detect the Flp and Cre recombinant alleles, respectively. Removal of exons 3 and 4 is predicted to result in a translational frameshift and loss of Ccrk function. Ex, exon. (E) RT–PCR analysis of the Ccrk transcript in the control and Ccrk CKO retinas. The primers were designed within exon 2 and exon 3 of Ccrk. No Ccrk transcript was detected in the Ccrk CKO retina. β-Actin was used as a loading control. (F) Western blot analysis of lysates from HEK293T cells expressing FLAG-tagged Ccrk using anti-Ccrk and anti-FLAG antibodies. The anti-Ccrk antibody recognized the Ccrk protein. (G) Western blot analysis of the Ccrk protein in the control and Ccrk CKO retinas. No Ccrk band was detected in the Ccrk CKO retina. α-Tubulin was used as a loading control. (H) Immunostaining of retinal sections from the control and Ccrk CKO mice at 1 mo using marker antibodies against Rhodopsin, S-opsin, and M-opsin. Severe photoreceptor degeneration was observed in the Ccrk CKO retina. (I) RT–PCR analysis of the Ccrk transcript in the control and Ccrk iCKO retinas. The primers were designed within exon 2 and exon 3 of Ccrk. The expression level of Ccrk decreased in the Ccrk iCKO retina. β-Actin was used as a loading control. (J) Western blot analysis of the Ccrk protein in the control and Ccrk iCKO retinas. The expression level of Ccrk decreased in the Ccrk iCKO retina. α-Tubulin was used as a loading control. (K) Immunostaining of retinal sections from the control and Ccrk iCKO mice at 2 mo using marker antibodies against Rhodopsin, S-opsin, and M-opsin. (L, M) ERG analysis of Ccrk iCKO mice. (L) Representative scotopic and photopic ERGs elicited by four different stimulus intensities (−4.0 to 1.0 log cd s/m2 and −0.5 to 1.0 log cd s/m2, respectively) from the control and Ccrk iCKO mice at 2 mo. (M) Scotopic and photopic amplitudes of a- and b-waves are shown as a function of the stimulus intensity. Data are presented as the mean ± SD. The amplitudes of a- and b-waves were not significantly different between the control and Ccrk iCKO mice (unpaired t test). n = 5 and 3 mice (control and Ccrk iCKO, respectively). (N) Western blot analysis of pMak and the Mak protein in the control and Ccrk iCKO retinas. Nuclei were stained with DAPI. OS, outer segment; ONL, outer nuclear layer; INL, inner nuclear layer; GCL, ganglion cell layer.
Figure S8.
Figure S8.. Phenotypic analysis of the Mak+/−; Ccrk+/− mouse retina.
(A) Immunostaining of retinal sections from Mak+/− and Mak+/−; Ccrk+/− mice at 2 mo using marker antibodies against Rhodopsin, S-opsin, and M-opsin. Nuclei were stained with DAPI. OS, outer segment; ONL, outer nuclear layer; INL, inner nuclear layer; GCL, ganglion cell layer. (B, C) ERG analysis of Mak+/−; Ccrk+/− mice at 2 mo. (B) Representative scotopic and photopic ERGs elicited by four different stimulus intensities (−4.0 to 1.0 log cd s/m2 and −0.5 to 1.0 log cd s/m2, respectively) from Mak+/− and Mak+/−; Ccrk+/− mice. (C) Scotopic and photopic amplitudes of a- and b-waves are shown as a function of the stimulus intensity. Data are presented as the mean ± SD. *P < 0.05 (unpaired t test). n = 3 and 7 mice (Mak+/− and Mak+/−; Ccrk+/−, respectively). (D, E) ERG analysis of Mak−/−; Ccrk+/− mice at 2 mo. (D) Representative scotopic ERGs elicited by four different stimulus intensities (−4.0 to 1.0 log cd s/m2) from Mak−/− and Mak−/−; Ccrk+/− mice. (E) Scotopic amplitudes of a- and b-waves are shown as a function of the stimulus intensity. Data are presented as the mean ± SD. The amplitudes of a- and b-waves were not significantly different between Mak−/− and Mak−/−; Ccrk+/− mice (unpaired t test). n = 7 and 4 mice (Mak−/− and Mak−/−; Ccrk+/−, respectively).
Figure 6.
Figure 6.. Effects of Ccrk dosage on retinal degeneration in Mak−/− mice and ciliary abnormalities caused by Dync2li1 deficiency.
(A) Immunostaining of retinal sections from Mak−/− and Mak−/−; Ccrk+/− mice at 2 mo using marker antibodies against Rhodopsin, S-opsin, and M-opsin. Rod outer segment disorganization and mislocalization of cone opsins were enhanced in the Mak−/−; Ccrk+/− retina. OS, outer segment; ONL, outer nuclear layer; INL, inner nuclear layer; GCL, ganglion cell layer. (B, C) ERG analysis of Mak−/−; Ccrk+/− mice at 2 mo. (B) Representative photopic ERGs elicited by four different stimulus intensities (−0.5 to 1.0 log cd s/m2) from Mak−/− and Mak−/−; Ccrk+/− mice. (C) Photopic amplitudes of a- and b-waves are shown as a function of the stimulus intensity. Data are presented as the mean ± SD. *P < 0.05, **P < 0.01 (unpaired t test). n = 7 and 4 mice (Mak−/− and Mak−/−; Ccrk+/−, respectively). (D, E) Effects of Ccrk overexpression on ciliary length in cells knocked down for Dync2li1. (D) Plasmid encoding Control-shRNA or Dync2li1-shRNA3 was co-transfected into NIH3T3 cells with or without a plasmid expressing Ccrk in combination with a construct encoding FLAG-tagged EGFP. Cells were immunostained with anti-FLAG and anti-Actub antibodies. (E) Length of cilia stained with an antibody against Actub in FLAG-positive cells was measured. Data are presented as the mean ± SD. *P < 0.05, ****P < 0.0001, ns, not significant (two-way ANOVA followed by Tukey’s multiple comparisons test). Control-shRNA; Control, Control-shRNA; Ccrk, Dync2li1-shRNA3; Control, and Dync2li1-shRNA3; Ccrk, n = 100, 104, 108, and 101 cilia, respectively, from four experiments. (F) Luciferase reporter gene assay using 8x Gli1-binding sites–minimal promoter–NanoLuc luciferase constructs. NIH3T3 cells were transfected with plasmids expressing Dync2li1-shRNA2 and Ccrk along with a NanoLuc luciferase reporter construct driven by the 8x Gli1-binding sites and minimal promoter and a Firefly luciferase–expressing construct driven by the SV40 promoter and enhancer. Luciferase activities of cell lysates were measured 24 h after serum starvation with 100 nM SAG. NanoLuc luciferase activity was normalized to Firefly luciferase activity. Data are presented as the mean ± SD. **P < 0.01, ****P < 0.0001, ns, not significant (two-way ANOVA followed by Tukey’s multiple comparisons test). N = 4 experiments.

Similar articles

Cited by

References

    1. Gerdes JM, Davis EE, Katsanis N (2009) The vertebrate primary cilium in development, homeostasis, and disease. Cell 137: 32–45. 10.1016/j.cell.2009.03.023 - DOI - PMC - PubMed
    1. Derderian C, Canales GI, Reiter JF (2023) Seriously cilia: A tiny organelle illuminates evolution, disease, and intercellular communication. Dev Cell 58: 1333–1349. 10.1016/j.devcel.2023.06.013 - DOI - PMC - PubMed
    1. Nachury MV, Mick DU (2019) Establishing and regulating the composition of cilia for signal transduction. Nat Rev Mol Cell Biol 20: 389–405. 10.1038/s41580-019-0116-4 - DOI - PMC - PubMed
    1. Wang J, Deretic D (2014) Molecular complexes that direct rhodopsin transport to primary cilia. Prog Retin Eye Res 38: 1–19. 10.1016/j.preteyeres.2013.08.004 - DOI - PMC - PubMed
    1. Fliegauf M, Benzing T, Omran H (2007) When cilia go bad: Cilia defects and ciliopathies. Nat Rev Mol Cell Biol 8: 880–893. 10.1038/nrm2278 - DOI - PubMed

Substances

LinkOut - more resources