Comparative Study
. 2024 Sep 19;15(1):8215.
doi: 10.1038/s41467-024-52380-9.

A comparative analysis of planarian genomes reveals regulatory conservation in the face of rapid structural divergence

Affiliations
Comparative Study

A comparative analysis of planarian genomes reveals regulatory conservation in the face of rapid structural divergence

Mario Ivanković et al. Nat Commun. .

Abstract

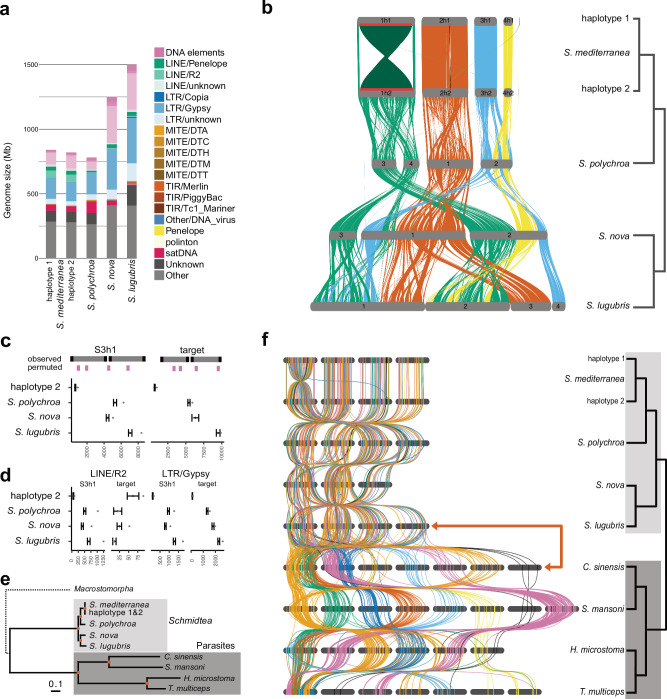
The planarian Schmidtea mediterranea is being studied as a model species for regeneration, but the assembly of planarian genomes remains challenging. Here, we report a high-quality haplotype-phased, chromosome-scale genome assembly of the sexual S2 strain of S. mediterranea and high-quality chromosome-scale assemblies of its three close relatives, S. polychroa, S. nova, and S. lugubris. Using hybrid gene annotations and optimized ATAC-seq and ChIP-seq protocols for regulatory element annotation, we provide valuable genome resources for the planarian research community and a first comparative perspective on planarian genome evolution. Our analyses reveal substantial divergence in protein-coding sequences and regulatory regions but considerable conservation within promoter and enhancer annotations. We also find frequent retrotransposon-associated chromosomal inversions and interchromosomal translocations within the genus Schmidtea and, remarkably, independent and nearly complete losses of ancestral metazoan synteny in Schmidtea and two other flatworm groups. Overall, our results suggest that platyhelminth genomes can evolve without syntenic constraints.


Conflict of interest statement

The authors declare no competing interests.

Figures

Fig. 1
Fig. 1. Quality control metrics and description of the S. mediterranea genome and annotation.
a Hi-C contact map of the reads used for scaffolding on S3h1 (upper right) and S3h2 (lower left), showing high contact intensity in red and low contact intensity in blue. b Results of a Merqury analysis using four Illumina shot-gun datasets not used for the assembly. c Dotplot representing a whole genome alignment between Chromosome 4, inferred with minimap2, of the previously scaffolded assembly (schMedS2) on the y-axis and the genome in this study (schMedS3h1) on the x-axis. Blue lines indicate scaffold gaps in schMedS2 and red lines indicate scaffold gaps in schMedS3h1. Numbered red bars indicate alignment gaps > 1 Mb, which contain highly repetitive satellite DNA absent in the previous assembly. d Self-similarity heatmap, calculated with stained glass, of the numbered gaps in c showing their high self-similarity, typical of centromeric or pericentromeric repeats. e Comparison between the two pseudohaplotypes of schMedS3. The chord diagram in the center indicates synteny regions (grey) and inversions (yellow) between the haplotypes. The black ribbons within the large inversion in Chromosome 1 indicate the contained smaller inversion. Density plots in the outer three circles show the distribution of transposable elements (TE), genes, and heterozygosity. f Representation of the hybrid gene annotation workflow. gi Completeness comparison of benchmarked annotations using BUSCO (g), using the 1054 S. mediterranea transcripts deposited in GenBank (h), and using the mappability of 13 publicly available RNA-seq datasets (i). Box plots show the interquartile range (IQR), with whiskers extending to 1.5 times the IQR. j ORF integrity comparison of benchmarked annotations by manual inspection of 96 gene models for indicated error categories. The scores reflect only the best-predicted transcript/locus/benchmarked annotation. gj Benchmarked gene annotations: S3h1, S3h2, S3BH: this study; dd_v1 the non-stranded dd_Smes_v1 assembly of the sexual strain of S. mediterranea; dd_v6 the dd_Smed_v6 assembly of the asexual strain of S. mediterranea; SMESG the gene prediction on basis of the previous dd_smes_g4 S. mediterranea genome assembly; Oxford_v1 a composite annotation of,, and SMESG. Source data are provided as a Source Data file.
Fig. 2
Fig. 2. Profiling of the chromatin regulatory landscape in Schmidtea mediterranea using ATAC-seq and ChIP-seq.
a Schematic illustration of the ATAC-seq library generation workflow. b Representative fragment size distribution, with peaks at 100 and 200 bp reflecting nucleosome-free and mononucleosome-bound fragments. c Representative TSS enrichment analysis, revealing the expected enrichment of nucleosome-free region fragments (NFR, black) at the transcription start sites (TSS), flanked by enrichments of mononucleosomal fragments (mono, red). d Genome-wide peak size distribution of the 55,585 ATAC-seq peaks used in the subsequent analysis. e Schematic illustration of the ChIP-seq library generation workflow. f Genome-wide average TSS-centered coverage profiles and heatmaps of H3K27ac and H3K4me3 ChIP-seq read distributions, stratified by gene expression level quartiles. g Genome-wide peak size distribution of the 18,361 H3K4me3 and 38,923 H3K27ac ChIP-seq peaks. h Bar graph representation of the total number of H3K27ac, H3K4me3, and ATAC-seq peaks. i ATAC-seq peak categorization into putative promoters, putative enhancers, and uncharacterized peaks on basis of intersection with the two histone marks. j Averaged profiles of the H3K4me3 and H3K27ac ChIP-seq signal centered on the three predominant peak categories defined in h. k Stacked bar plots showing the distribution of the putative promoters, enhancers, and uncharacterized ATAC-seq peaks in relation to the high-confidence gene annotations. l Genome browser snapshot of the sp5 gene locus, showing the exon/intron representation of sp5 (blue, bottom right), a H3K4me3+/ H3K27ac+ promoter overlapping with the TSS and a H3K4me3-/ H3K27ac+ putative enhancer (red bar, asterisk) further upstream. m Close-up of the putative enhancer in l. Boxplots in b and d show the interquartile range (IQR), with whiskers extending to 1.5 times the IQR. Source data are provided as a Source Data file.
Fig. 3
Fig. 3. Comparative ATAC-seq in the genus Schmidtea to assess regulatory element conservation.
a Evolutionary distance of the analyzed Schmidtea species on the basis of 4-fold degenerate sites in the whole genome alignments. Branch lengths indicate expected substitutions per site. The tree topology is based on a phylogenomic analyses of 930 single-copy genes and agrees with previous work. b Hi-C contact maps of the genome assemblies of S. polychroa (schPol2), S. nova (schNov1), and S. lugubris (schLug1). c BUSCO completeness assessment of the genome assemblies (left three bars) and the corresponding annotations (right bars) of the new Schmidtea genomes. Since the annotation assessment was run on the transcript level, the “Duplicate” and “Complete” category were combined for the visualization to avoid apparent duplication due to isoforms. d ATAC-seq fragment-size distributions of the indicated species. e Pileups of nucleosome-free region (NFR) and mononucleosomal (mono) reads at transcription start sites (TSS) of the indicated species. f Schematic diagram showing the definition of a conserved region (sequence conservation without ATAC-seq signal) and conserved peak (sequence conservation and ATAC-seq signal). g Bar plots indicate the conservation status of all S. mediterranea ATAC-seq peaks by conservation category and the degree of conservation across the sister species. The “conserved” bar sub-categorizes the 13.6% of highly conserved peaks according to the histone mark categorization in Fig. 2i. The three bar plots represent the conservation status of putative promoters, putative enhancers, and uncharacterized ATAC-seq peaks. h Highly conserved regulatory elements in association with the wnt1 gene locus. Top: Representation of the S.mediterranea gene locus, including sequence conservation (PhyloP on whole genome alignments), H3K4me3 ChIP, H3K27ac ChIP, and ATAC-seq tracks, annotated regulatory elements (published, black; this study, blue), and the exon/intron representation of the wnt1 gene. Below, the available tracks in the three sister species genomes are shown aligned by the TSS. Note, that only a single peak was called in S. nova and the peak was therefore classified as a conserved region in that species. Source data are provided as a Source Data file.
Fig. 4
Fig. 4. Structural evolution of flatworm genomes.
a Bar plot of the sizes and repetitive element contributions to the indicated Schmidtea assemblies. b Synteny analysis between the four Schmidtea species. Ribbon coloring on the basis of S. mediterranea chromosome locations. Red bars and darker shading in schMedS3h1 indicate the inversions on Chromosome 1 and 2 that distinguish haplotype 1 and 2. c, d Enrichment analysis of 10 kb windows flanking synteny breakpoints, inferred using GENESPACE, in the Schmidtea assemblies. Tests compare the observed value (black dots) to 1000 random permutations of 10 kb windows in the reference (colored mean and standard deviations). Black dots outside the permuted range indicate statistically significant enrichment. Shown are the results for all transposable elements (c) and LINE/R2 and LTR/Gypsy elements (d). See Supporting Information: Section 4.2 and Supplementary Data 15 for details. e Phylogenetic relationship of Schmidtea and the indicated parasitic flatworm species (parasites). The maximum-likelihood phylogeny is based on a concatenated alignment of 930 single-copy orthologs with a total of 818,016 aligned amino-acid positions. Red dots on nodes indicate maximum ultra-fast bootstrap and SH-like approximate likelihood ratio test support. The phylogeny was rooted at its midpoint. The early-branching Macrostomorpha are indicated with a dotted line. f Synteny analysis based on BUSCO gene positions between the indicated Schmidtea and parasitic flatworm assemblies. Genes are represented with bars colored based on the chromosome location in Schistosoma mansoni. Source data are provided as a Source Data file.
Fig. 5
Fig. 5. Lack of metazoan ancestral linkage group (MALG) and synteny conservation in flatworms.
Dotplots between metazoan ancestral linkage groups (MALG) and a Schistosoma mansoni, b Schmidtea mediterranea, and c Macrostomum hystrix. MALGs that are significantly enriched in one or more chromosomes according to a Fisher Exact test are indicated in dark color, while MALGs without enrichment are plotted in light colors. No enrichment was detected for any MALG in S. mediterranea and M. hystrix. df Synteny analysis between Schistosoma mansoni, Schmidtea mediterranea, and Macrostomum hystrix. Boxes indicate chromosome combinations and dots represent one-to-one orthologs inferred with ODP. No chromosome combination was enriched except for 57 orthologs between S. mansoni and S. mediterranea located on Chromosome 6 and Chromosome 4, respectively, indicating that synteny between these three flatworm groups is not conserved. The outline of S. mansoni was drawn with permission based on artwork by Guido Hegasy. Source data are provided as a Source Data file.

References

    1. Kon, T. et al. The genetic basis of morphological diversity in domesticated goldfish. Curr. Biol.30, 2260–2274.e6 (2020). - PubMed
    1. Gordon, C. T. et al. De novo mutations in SMCHD1 cause Bosma arhinia microphthalmia syndrome and abrogate nasal development. Nat. Genet.49, 249–255 (2017). - PubMed
    1. King, M.-C. & Wilson, A. C. Evolution at two levels in humans and chimpanzees: Their macromolecules are so alike that regulatory mutations may account for their biological differences. Science188, 107–116 (1975). - PubMed
    1. Roscito, J. G. et al. Phenotype loss is associated with widespread divergence of the gene regulatory landscape in evolution. Nat. Commun.9, 4737 (2018). - PMC - PubMed
    1. Kvon, E. Z. et al. Progressive loss of function in a limb enhancer during snake evolution. Cell167, 633–642.e11 (2016). - PMC - PubMed

Publication types

LinkOut - more resources