. 2024 Sep 18;15(1):8191.
doi: 10.1038/s41467-024-52317-2.

Multiomic single cell sequencing identifies stemlike nature of mixed phenotype acute leukemia

Affiliations

Multiomic single cell sequencing identifies stemlike nature of mixed phenotype acute leukemia

Cheryl A C Peretz et al. Nat Commun. .

Abstract

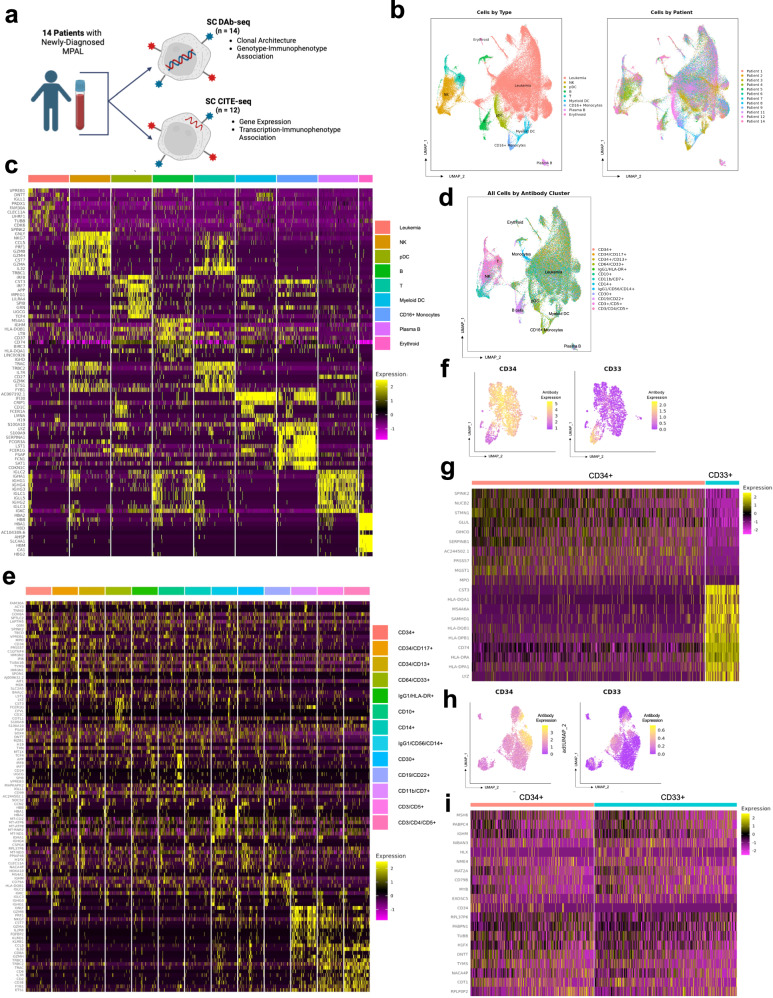
Despite recent work linking mixed phenotype acute leukemia (MPAL) to certain genetic lesions, specific driver mutations remain undefined for a significant proportion of patients and no genetic subtype is predictive of clinical outcomes. Moreover, therapeutic strategy for MPAL remains unclear, and prognosis is overall poor. We performed multiomic single cell profiling of 14 newly diagnosed adult MPAL patients to characterize the inter- and intra-tumoral transcriptional, immunophenotypic, and genetic landscapes of MPAL. We show that neither genetic profile nor transcriptome reliably correlate with specific MPAL immunophenotypes. Despite this, we find that MPAL blasts express a shared stem cell-like transcriptional profile indicative of high differentiation potential. Patients with the highest differentiation potential demonstrate inferior survival in our dataset. A gene set score, MPAL95, derived from genes highly enriched in the most stem-like MPAL cells, is applicable to bulk RNA sequencing data and is predictive of survival in an independent patient cohort, suggesting a potential strategy for clinical risk stratification.


Conflict of interest statement

C.D., Y.X. and K.M.F. are employees of Fluent BioSciences whose technology was used for RNA–protein experiments. C.E.H. is a former employee of Fluent BioSciences. I.C.C. is a shareholder in Fluent BioSciences. A.A. is a co-founder and shareholder of Mission Bio, whose technology was used for DNA–protein experiments, and Fluent BioSciences. All other authors declare no potential conflicts of interest.

Figures

Fig. 1
Fig. 1. MPAL is comprised of a common transcriptomic signature and heterogenous transcription-immunophenotypic associations.
a Schematic depicting sample workflow. Created with BioRender.com released under a Creative Commons Attribution-NonCommercial-NoDerivs 4.0 International license (https://creativecommons.org/licenses/by-nc-nd/4.0/deed.en). b RNA-derived UMAP from comprehensive SC CITE-seq analysis of 71,579 cells from 12 patients. Cells are color-coded by cell lineage/type as determined by gene expression data (left) and by individual patient (right). Source Data are provided as a Source Data file. c Heatmap of scaled expression values for top 10 most upregulated genes for each transcriptionally defined cell type as identified in (b). Source Data are provided as a Source Data file. d RNA-derived UMAP from (b). Cells are annotated based on transcriptionally defined cell populations, clustered by the expression of cell-surface immunophenotypic protein expression into 13 immunophenotype-defined clusters, and then color-coded based on cluster. Source Data are provided as a Source Data file. e Heatmap of scaled expression values for top 10 most upregulated genes in each of the 13 immunophenotypic subpopulations from (d). Source Data are provided as a Source Data file. f RNA-derived UMAP from 2594 cells from Patient 11. Cells are color-coded based on expression of CD34 (left) and CD33 (right). Source Data are provided as a Source Data file. g Heatmap of scaled expression values for top 10 most upregulated genes for the CD34-positive cell population (left columns) and the CD33-positive cell population (right columns) from Patient 11. Source Data are provided as a Source Data file. h RNA-derived UMAP from 6100 cells from Patient 2. Cells are color-coded based on expression of CD34 (left) and CD33 (right). Source Data are provided as a Source Data file. i Heatmap of scaled expression values for top 10 most upregulated genes for the CD34-positive cell population (left columns) and the CD33-positive cell population (right columns) from Patient 2. Source Data are provided as a Source Data file.
Fig. 2
Fig. 2. The MPAL transcriptional signature is stem-like, on the continuum of stem-like AML, and reproducible in an independent cohort.
a Barplot of normalized enrichment scores (NES) derived from gene set expression analysis (GSEA) of all single cells in the common leukemia cluster. The top 10 positively enriched gene sets are color-coded in red, the top 10 negatively enriched in blue, and additional gene sets of interest in green. Statistical significance is indicated as ***q < 0.001, **q < 0.01, *q < 0.05. Source Data are provided as a Source Data file. b Enrichment profile and ranking metric score for three example positively enriched gene sets, all of which are associated with stem cells. Source Data are provided as a Source Data file. c Enrichment profile and ranking metric score for the two significant leukemia-specific genes tested, hematopoietic stem cell (HSC)-like AML and leukemia stem cell (LSC)-47. Source Data are provided as a Source Data file. d Volcano plot of transcription factors as identified by analysis of the top differentially expressed genes in the common leukemia cluster with the ChIP-x Enrichment Analysis (ChEA) and Encyclopedia of DNA Elements (ENCODE) transcription factor targets databases via enrichr. Points color-coded based on significance as pink: p < 0.001, purple: p < 0.01, blue: p < 0.05. The three most significant gene sets are annotated. P values are two-sided and calculated with Fisher’s exact test, where genes are considered independent, and adjusted via the Benjamini–Hochberg method. Source Data are provided as a Source Data file. e Heatmap of scaled expression values of top 50 most differentially expressed genes in the common leukemia cluster of our cohort against clustered and annotated single cells from the comparison cohort. Source Data are provided as a Source Data file. f Enrichment profile and ranking metric score from GSEA of all single cells in the common leukemia cluster of the comparison cohort. The MPAL gene signature is comprised of the top 50 most differentially expressed genes in the common leukemia cluster of our cohort. The GSEA analysis in (b), (d), and (f) employs a one-sided permutation-based test to determine the significance of gene set enrichment, with raw p values adjusted for multiple testing using the Benjamini–Hochberg procedure to control the false discovery rate (FDR). Source Data are provided as a Source Data file.
Fig. 3
Fig. 3. Measures of stemness are prognostic of MPAL patient outcomes.
a RNA-derived UMAP from comprehensive SC CITE-seq analysis of 71,579 cells from 12 patients with MPAL from Fig. 1e. Cells are color-coded based on cytoTRACE score from 0 (most differentiated) to 1 (least differentiated). Source Data are provided as a Source Data file. b UMAP from (a). Cells are color-coded based on cell-surface expression of CD34 protein. Source Data are provided as a Source Data file. c Spearman correlation matrix of CytoTRACE score and cell-surface protein expression. Correlation coefficient is denoted by color coding. Source Data are provided as a Source Data file. d Kaplan–Meier estimates of overall survival stratified by median CytoTRACE score <0.5 vs ≥0.5 for 12 adult patients with MPAL. Curves are compared using log-rank tests. Source Data are provided as a Source Data file. e Heatmap of scaled expression values for the genes with greatest upregulation in single cells with high cytoTRACE (≥0.95) (left columns) vs low cytoTRACE (<0.95) (right columns). Source Data are provided as a Source Data file. f Kaplan–Meier estimates of overall survival stratified by MPAL95, a gene set score derived from single-cell transcriptional data, for 72 adult patients from Soochow University. Curves are compared using log-rank tests. Source Data are provided as a Source Data file. g Kaplan–Meier estimates of overall survival stratified by MPAL95, a gene set score derived from single-cell transcriptional data, for 69 pediatric patients with MPAL from the TARGET initiative. Curves are compared using log-rank tests. Source Data are provided as a Source Data file. h Multivariate Cox proportional hazards model for 69 pediatric patients with MPAL, with the MPAL95 gene signature included. For each variable, the hazard ratio and 95% confidence interval (CI) are graphically depicted. Hazard ratios and 95% confidence intervals are from Cox proportional hazards analyses and p values are two-sided and from Wald tests. Statistical significance is indicated as *p < 0.05. Source Data are provided as a Source Data file.
Fig. 4
Fig. 4. MPAL is comprised of heterogenous genotype–immunophenotype associations.
a Oncoprint of all 14 patients with newly diagnosed MPAL. Each column is a unique patient. Patients (columns) are coded on the top row based on immunophenotypic subtype and mutations (rows) are ordered based on biologic function. Patient-level mutation status is indicated by dark gray (mutated) vs light gray (no detectable mutations) Clonal frequency is based on the total number of clones the mutation was present in, not accounting for zygosity. b Oncoprint of 36 genetically defined clones across all 14 patients with MPAL. Each column is a unique clone, and mutations (rows) are color-coded based on the type of mutation and zygosity. Clonal-level mutation status is indicated by heterozygous (Het.) missense (light green), homozygous (Hom.) missense (dark green), Het. frameshift insertion (light blue), Hom. frameshift insertion (dark blue), or no detectable mutations (light gray). c Pairwise association of driver mutations identified via SC DNA sequencing across 36 clones in 14 patients with MPAL. For each mutation pair, cooccurrence is summarized as log odds ratio (OR), with positive values indicating cooccurrence and negative values mutual exclusivity. Statistical significance is indicated as *p < 0.05; **p < 0.01; ***p < 0.001. P values are two-sided and calculated using Fisher’s exact test. Source Data are provided as a Source Data file. d Immunophenotype-derived UMAP from SC DAb-seq analysis of 51,847 cells from 14 patients. Cells are color-coded based on antibody expression. Selection myeloid and lymphoid markers are shown; all antibodies in the panel are visualized in Supplementary Fig. 14. Source Data are provided as a Source Data file. e UMAP from (d). Cells are color-coded based on the presence of genetic mutation, with further color coding based on biological function. Source Data are provided as a Source Data file. f Spearman correlation matrix across 36 unique genetically defined clones (51,847 single cells) and 22 cell-surface antibodies. Correlation coefficient is denoted by color coding from highly correlated (red) to highly anti-correlated (blue), with significance denoted as *p < 0.05; **p < 0.01; ***p < 0.001. p values are two-sided. Source Data are provided as a Source Data file. g Heatmap of t-statistics generated by comparing cell-surface antibody expression of mutant vs non-mutant cell populations within an individual patient. To account for differences in expression across patients, comparisons are only made within individual patients, and not across multiple patients. Source Data are provided as a Source Data file.
Fig. 5
Fig. 5. Association between immunophenotypic evolution and mutational acquisition.
a Barplot with dot-plot overlain depicting maximum t-statistic for 22 cell-surface antibodies for each patient across all clones. Bars are defined by the interquartile range, centered at the median, and whiskers indicate 95% confidence interval error bars. For each antibody, antibody expression of all subsequent branch phylogenetic clones are compared to the founding phylogenetic clone, generating a t-statistic, and the maximum t-statistic for an individual antibody and patient is plotted. Each bar represents one immunophenotypic protein and each overlain dot represents one of nine individual patients. Immunophenotypic proteins are ranked by maximum t-statistic across all patients, ranging from CD38 (greatest increase in expression with mutational acquisition across patients) to CD8 (lowest increase in expression). Source Data are provided as a Source Data file. b Top: mutation phylogeny of nine patients with MPAL with at least two stepwise mutational acquisitions identified on single-cell DNA analysis. Each oval represents a genetically distinct subclone and arrows represent cumulative acquisition of mutational events. For each patient, the percentage of each clone among the total number of tumor cells and the 95% credible intervals from the posterior sampling are below each oval. Bottom: violin plots depicting normalized expression of CD38, CD33, CD34, CD123, and CD117 for each subclone represented in the above phylogeny. Violin plots color-coded in red indicate protein expression that has significantly increased with mutational acquisition; plots color-coded in blue indicate a significant decrease in protein expression. Statistical significance is considered p < 0.05, with two-sided p values calculated using Student’s t-test and adjusted for multiple comparisons via the Bonferroni method. Het heterozygous, Hom homozygous. All mutations are heterozygous unless specified otherwise. Source Data are provided as a Source Data file.

Update of

References

    1. Munker, R. et al. Mixed phenotype acute leukemia: outcomes with allogeneic stem cell transplantation. A retrospective study from the Acute Leukemia Working Party of the EBMT. Haematologica102, 2134–2140 (2017). - PMC - PubMed
    1. Khoury, J. D. et al. The 5th edition of the World Health Organization Classification of haematolymphoid tumours: myeloid and histiocytic/dendritic neoplasms. Leukemia36, 1703–1719 (2022). - PMC - PubMed
    1. Arber, D. A. et al. International Consensus Classification of myeloid neoplasms and acute leukemias: integrating morphologic, clinical, and genomic data. Blood140, 1200–1228 (2022). - PMC - PubMed
    1. Dickerson, K. M. et al. ZNF384 fusion oncoproteins drive lineage aberrancy in acute leukemia. Blood Cancer Discov.3, 240–263 (2022). - PMC - PubMed
    1. Zaliova, M. et al. A novel class of ZNF384 aberrations in acute leukemia. Blood Adv.5, 4393–4397 (2021). - PMC - PubMed

Publication types

Associated data