. 2024 Sep 18;15(1):8182.
doi: 10.1038/s41467-024-52453-9.

β2 integrins impose a mechanical checkpoint on macrophage phagocytosis

Affiliations

β2 integrins impose a mechanical checkpoint on macrophage phagocytosis

Alexander H Settle et al. Nat Commun. .

Abstract

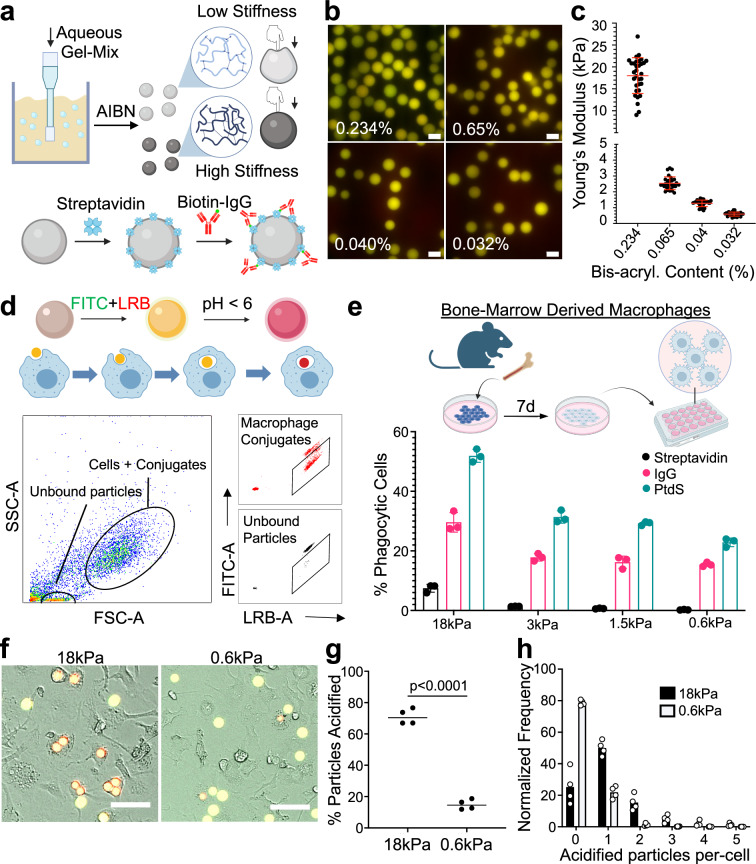
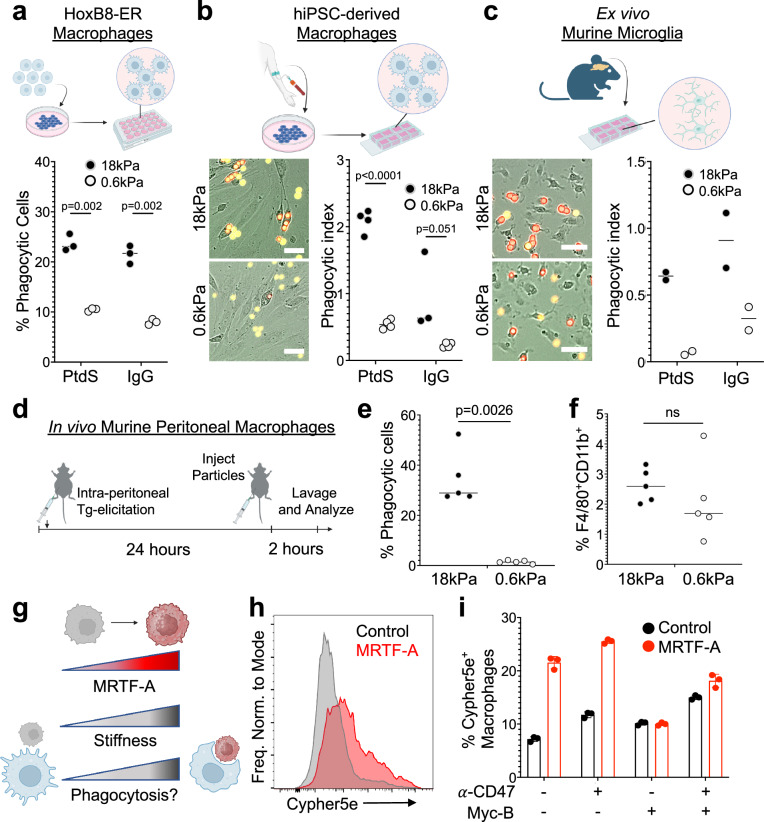
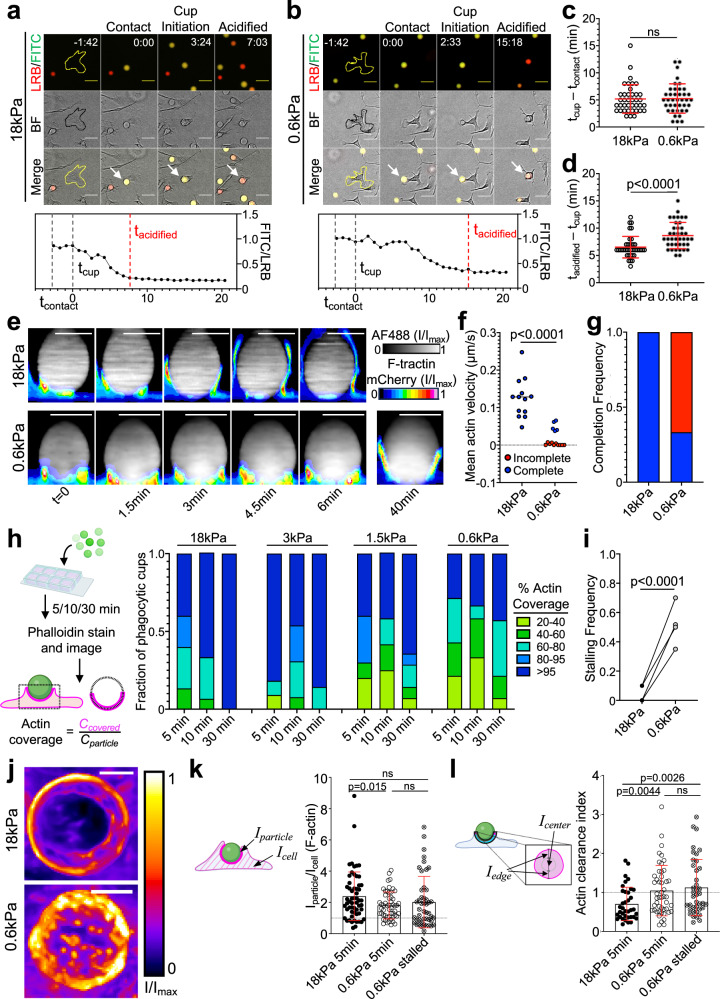
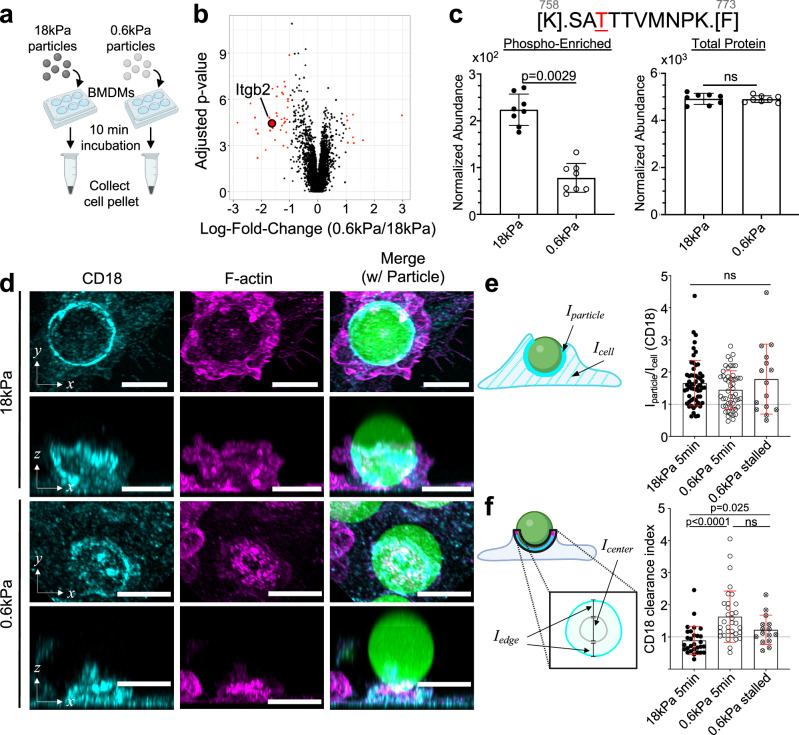
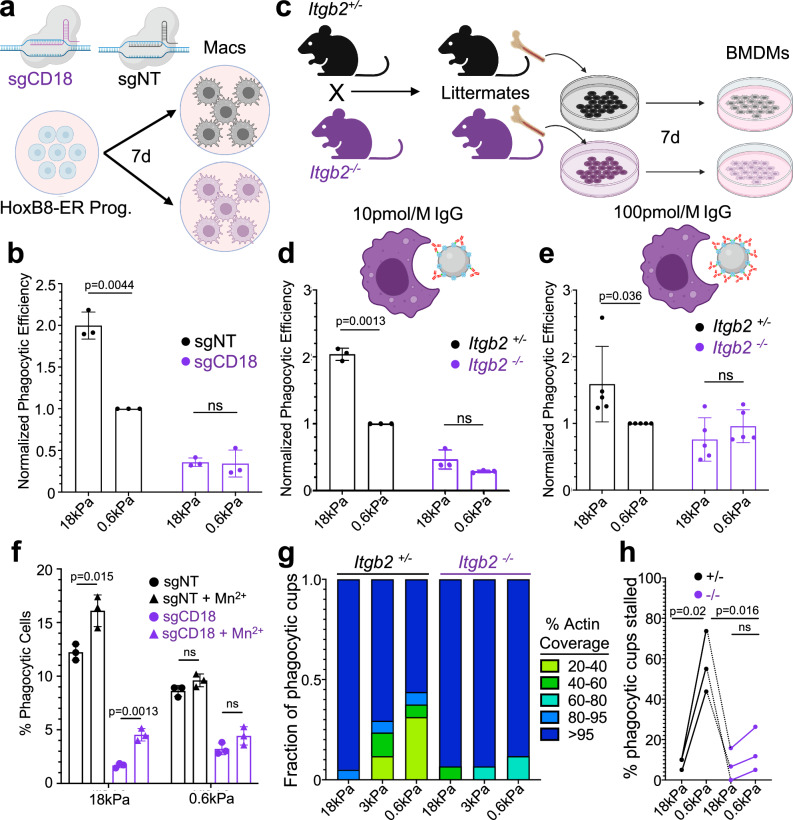
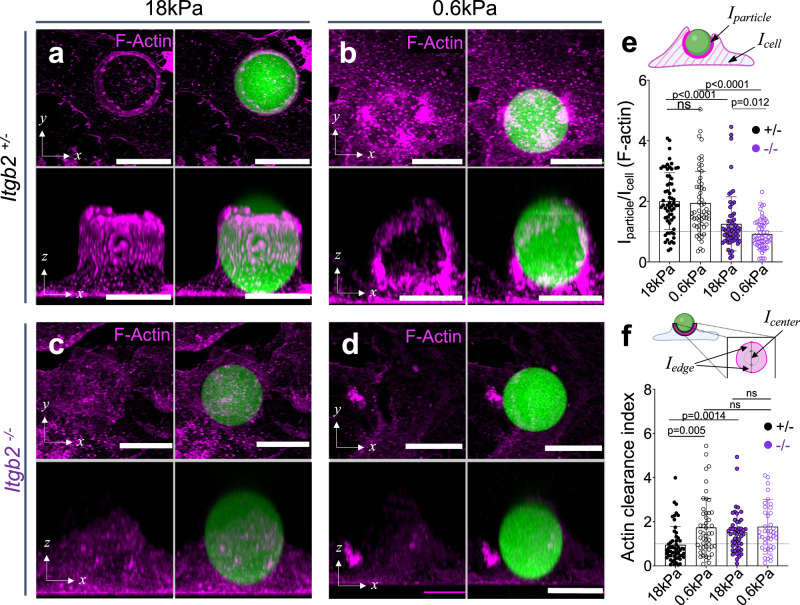
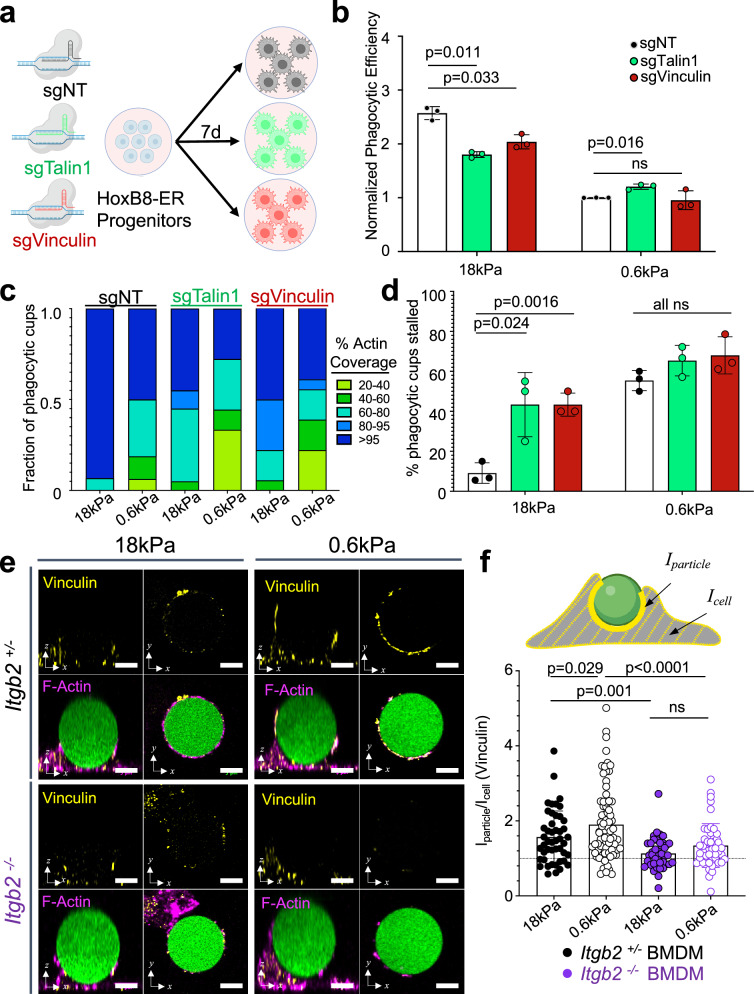
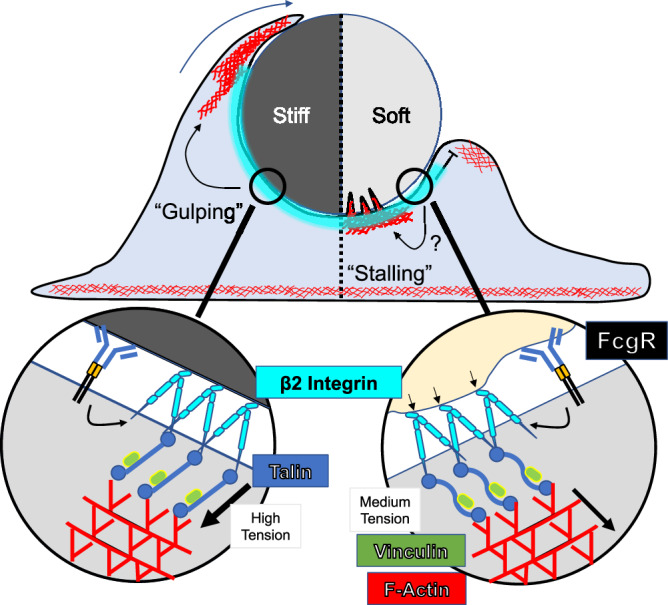
Phagocytosis is an intensely physical process that depends on the mechanical properties of both the phagocytic cell and its chosen target. Here, we employed differentially deformable hydrogel microparticles to examine the role of cargo rigidity in the regulation of phagocytosis by macrophages. Whereas stiff cargos elicited canonical phagocytic cup formation and rapid engulfment, soft cargos induced an architecturally distinct response, characterized by filamentous actin protrusions at the center of the contact site, slower cup advancement, and frequent phagocytic stalling. Using phosphoproteomics, we identified β2 integrins as critical mediators of this mechanically regulated phagocytic switch. Macrophages lacking β2 integrins or their downstream effectors, Talin1 and Vinculin, exhibited specific defects in phagocytic cup architecture and selective suppression of stiff cargo uptake. We conclude that integrin signaling serves as a mechanical checkpoint during phagocytosis to pair cargo rigidity to the appropriate mode of engulfment.


Conflict of interest statement

The authors declare no competing interests.

Figures

Fig. 1
Fig. 1. A hydrogel microparticle system to interrogate cargo mechanosensing.
a Schematic diagram for DAAM particle synthesis (see “Methods” section). Particle rigidity depends on the ratio of cross-linker to monomer. AIBN azobisisobutyronitrile. b Representative images of DAAM particles, prepared using the indicated bis-acrylamide contents and conjugated to LRB and FITC. Scale bars = 10 µm. c Atomic force microscopy measurements of stiffness (Young’s modulus) for particles prepared using the indicated bis-acrylamide contents. n = 36 (for 0.234% and 0.04%) or 34 (for 0.065% and 0.032%) DAAM particles. Error bars denote standard deviation (SD). d, e BMDMs were challenged with DAAM particles coated with different phagocytic ligands and particle uptake quantified by flow cytometry. d Top, schematic diagram for LRB/FITC dependent tracking of phagocytosis. Bottom, representative gating for flow cytometry-based quantification. e Uptake efficiency of DAAM particles coated with the indicated phagocytic ligands is graphed against particle stiffness. Columns and error bars denote mean and standard deviation (SD), respectively. n = 3 biological replicates. fh BMDMs were imaged together with IgG-coated DAAM particles. f Representative brightfield and epifluorescence images of BMDMs phagocytosing DAAM particles of the indicated stiffness. Phagocytosed particles turn red, while unengulfed particles are yellow. Scale bars = 50 µm. g Phagocytosis quantified as the fraction of particles acidified per field of view after 2 h. Each point represents the mean of four fields of view in one technical replicate. Horizontal lines in each column denote the overall mean. P value determined by two-tailed Student’s t-test. h Histogram showing the number of 18 and 0.6 kPa particles phagocytosed per cell after 2 h. Schematics in (a), (d), and (e) created with BioRender.com released under a Creative Commons Attribution-NonCommercial-NoDerivs 4.0 International license https://creativecommons.org/licenses/by-nc-nd/4.0/deed.en.
Fig. 2
Fig. 2. High cargo rigidity promotes phagocytic uptake.
a Phagocytic efficiency of HoxB8-ER derived macrophages challenged with IgG- and PtdS-coated DAAM particles of the indicated rigidities, quantified by flow cytometry. n = 3 replicate macrophage differentiations. hiPSC-derived macrophages (b) and murine microglia (c) were mixed with IgG- and PtdS-coated DAAM particles of the indicated rigidities, and phagocytosis monitored by video microscopy. Representative images of uptake of IgG-coated particles are shown to the left, with phagocytic index quantified on the right. Phagocytic index = number of particles phagocytosed per macrophage. In (b), n = 4 replicate macrophage differentiations, while in (c), n = 2 biological replicates (summary of 4 technical replicates/biological replicate). Scale bars in (b, c) = 30 µm. df DAAM particles of differential stiffness were injected into the mouse peritoneum to measure the phagocytic activity of elicited macrophages. d Schematic of macrophage elicitation and DAAM particle injection protocol (see “Methods” section). e Phagocytic efficiency (LRB+FITClo/all CD11b+F4/80+ cells) for particles of the indicated rigidities. n = 5 mice/condition. f Macrophage recruitment to the peritoneum, quantified as total F480+CD11b+ cells over all live cells in the peritoneal lavage. In (ac) and (e, f), horizontal lines in columns denote mean values. All P values determined by two-tailed Student’s t-test. ns not significant. gi BMDMs were challenged with Cypher5e-labeled E0771 cells expressing different levels of MRTF-A. g MRTF-A is expected to enhance phagocytosis by increasing cell stiffness. h Representative flow cytometry histogram showing Cypher5e signal in BMDMs challenged for 2 h with control E0771 cells or E0771 cells overexpressing MRTF-A. i Phagocytosis is quantified as %Cypher5e+ macrophages. Error bars indicate SD. n = 3 replicate macrophage differentiations. Schematics in (ad), and (g) created with BioRender.com released under a Creative Commons Attribution-NonCommercial-NoDerivs 4.0 International license https://creativecommons.org/licenses/by-nc-nd/4.0/deed.en.
Fig. 3
Fig. 3. Phagocytosis of soft targets is slow and prone to stalling.
ac BMDMs were challenged with 18 or 0.6 kPa IgG-coated DAAM particles and imaged by wide-field videomicroscopy. Above, time-lapse montages showing representative 18 kPa (a) and 0.6 kPa (b) uptake events. Fluorescence (LRB/FITC) and brightfield (BF) channels are shown individually and in merge. Particles undergoing phagocytosis are indicated by white arrows in the merged images. The BMDM of interest is outlined in yellow/black in the first image of each time-lapse. Time is indicated as M:SS in the top right of the fluorescence images, with time of first contact defined as t = 0. Scale bars = 30 µm. c Recognition time, defined as time difference between cup formation and first contact, n = 39 cells. ns not significant, two-tailed Welch’s t-test. d Total acidification time, defined as the difference between particle acidification and cup formation, n = 39 cells. P value determined by two-tailed Welch’s t-test. In (c) and (d), mean values and error bars (denoting SD) are indicated in red. eg HoxB8-ER macrophages expressing F-tractin-mCherry were challenged with stiff (18 kPa) or soft (0.6 kPa) IgG-coated DAAM particles and imaged by spinning disk confocal microscopy. e Time-lapse montages of representative phagocytic events, visualized as side-views of 3D reconstructions. F-tractin is depicted in pseudocolor, with warmer colors indicating higher fluorescence, and the particle is shown in gray. A 40-min time point from the same 0.6 kPa particle conjugate is included for reference. Scale bars = 10 µm. f Mean phagocytic cup velocity (see “Methods” section and Supplementary Fig. 4d, e) on stiff and soft DAAM particles. Blue and red points denote cups that completed or failed to complete within 30 min, respectively. Statistical significance (p < 0.0001) includes all events, p = 0.0002 using only completed events, two-tailed Welch’s t-test. g Fraction of events that completed (blue) or did not complete (red) within 30 min. Completion defined as actin covering >95% of the particle at any time and persisting until the end of capture. hi BMDMs were challenged with IgG-coated DAAM particles of different rigidities for various times, and then fixed and stained with phalloidin to visualize F-actin. h Left, Schematic for quantification of percent F-actin coverage on fixed phagocytic cups. Right, F-actin coverage for various particle rigidities, graphed against time. Values are sorted into five bins, with colors denoting the fraction of events falling within each bin. n = 15 events per time/stiffness condition (180 total events) in one representative experiment. i Quantification of stalling frequency, defined as the fraction of events that are 20–95% complete after 30 min co-incubation with BMDMs. n = 4 biological replicates (one mouse per replicate). P value determined by two-tailed paired t-test. j Representative en face maximum z-projections of F-actin in partial phagocytic cups formed on 18 and 0.6 kPa DAAM particles, taken from live imaging experiments. Color scale represents fluorescence intensity values divided by the maximum fluorescence intensity of each image. F-actin accumulation (k), defined as the mean phalloidin intensity at the particle interface divided by the mean phalloidin intensity over the entire cell, and F-actin clearance index (l), which compares F-actin signal at the periphery and the center of the phagocytic cup (see “Methods” section), determined in phagocytic cups formed with 18 kPa (5 min) and 0.6 kPa (5 or 30 min) DAAM particles. In (k) and (l), error bars denote SD. P values determined by two-tailed Welch’s t-test. n = 37, 48, 40 cells for 18 kPa, 0.6 kPa 5 min, and 0.6 kPa 30 min, respectively. Schematics in (h), (k), and (l) created with BioRender.com released under a Creative Commons Attribution-NonCommercial-NoDerivs 4.0 International license https://creativecommons.org/licenses/by-nc-nd/4.0/deed.en.
Fig. 4
Fig. 4. β2 integrins respond differently to stiff and soft targets.
a, b BMDMs were challenged with 18 and 0.6 kPa IgG-coated DAAM particles and then subjected to phosphoproteomic analysis. a Schematic diagram of phosphoproteomic sample preparation—BMDMs and microparticles were co-incubated for 10 min before transferring to ice, and cells were then lifted and pelleted at −80 °C. b Volcano plot of the resulting phosphopeptides, with negative and positive log fold-change (LogFC) denoting enrichment with 18 and 0.6 kPa particles, respectively. LogFC and significance were calculated using 8 independent replicates for each condition. c Above: sequence of Itgb2758–773, with phosphorylated threonine highlighted in red. Below left, normalized abundance values of the Itgb2758–773 phosphopeptide. Below right, normalized abundance of all Itgb2 peptides without phospho-enrichment. n = 8 replicates (independent macrophage differentiations from three pooled mice). Error bars denote SD. P values determined by two-tailed t-test, with Bonferroni adjustment. ns not significant. df BMDMs were challenged with IgG-coated DAAM particles of different rigidities for various times, fixed and stained for F-actin and CD18, and then imaged by confocal microscopy. d Representative images of DAAM particle–macrophage conjugates after 5 min incubation, stained with anti-CD18 antibody (cyan) and phalloidin (F-actin, magenta). Rows 1 and 3: top–down maximum intensity projections, rows 2 and 4: side-view maximum intensity projections. Scale bars = 10 µm. CD18 accumulation (e) defined as the ratio of CD18 at the particle interface divided by total CD18 in the cell, and CD18 clearance index (f) comparing CD18 signal at the periphery and the center of the phagocytic cup (see “Methods” section) determined in phagocytic cups formed with 18 kPa (5 min) and 0.6 kPa (5 and 30 min) DAAM particles. In (e) and (f), error bars denote SD. P values determined by two-tailed Welch’s t-test. n = 58, 53, and 15 cells for 18 kPa, 0.6 kPa 5 min, and 0.6 kPa 30 min, respectively. Schematics in (a), (e), and (f) created with BioRender.com released under a Creative Commons Attribution-NonCommercial-NoDerivs 4.0 International license https://creativecommons.org/licenses/by-nc-nd/4.0/deed.en.
Fig. 5
Fig. 5. β2 integrin signaling is necessary for phagocytic mechanosensing.
a Cas9+ HoxB8-ER conditionally immortalized progenitors were transduced with either a non-targeting sgRNA or sgRNA targeting exon 2 of CD18, and then differentiated into macrophages. b sgCD18 HoxB8-ER macrophages and sgNT controls were challenged with IgG-coated 18 and 0.6 kPa DAAM particles. Graph shows normalized phagocytic efficiency, defined as the ratio of percent phagocytic cells relative to the sgNT, 0.6 kPa sample. n = 3 biological replicates from independent differentiations. P values determined by two-tailed ratio paired t-test. ns not significant. c Diagram schematizing the preparation of BMDMs from Itgb2−/− mice. Heterozygous (Itgb2+/−) and homozygous knockout mice (Itgb2−/−) mice were bred and littermate F1 offspring of each genotype were compared in each biological replicate. Itgb2−/− BMDMs and Itgb2+/− controls were challenged with 18 and 0.6 kPa DAAM particles coated with 10 pmol/M (d) and 100 pmol/M (e) IgG. Graphs show phagocytic efficiency normalized against the Itgb2+/−, 0.6 kPa sample. n = 3 biological replicates for each genotype. P values determined by two-tailed ratio paired t-test. ns not significant. f Phagocytic efficiency of HoxB8-ER derived macrophages challenged with 100 pmol/M IgG-coated DAAM particles for 1 h, in the presence or absence of 500 µM MnCl2 added at the start of incubation. n = 3 independent macrophage differentiations. P values determined by two-tailed unpaired Student’s t-test. g F-actin coverage after 30 min incubation, determined for Itgb2−/− BMDMs and Itgb2+/− controls. Values are sorted into five bins, with colors denoting the fraction of events falling within each bin. Representative bars from one biological replicate are shown, from 20 events/condition. h Fraction of events that were 20–95% complete after 30 min co-incubation of DAAM particles with BMDMs. n = 3 biological replicates (litter-mate pairs, 20 events per condition/replicate). P values determined by two-tailed paired t-test. All error bars denote SD. Schematics in (a) and (ce) created with BioRender.com released under a Creative Commons Attribution-NonCommercial-NoDerivs 4.0 International license https://creativecommons.org/licenses/by-nc-nd/4.0/deed.en.
Fig. 6
Fig. 6. β2 integrin-mediated adhesion drives actin reinforcement at the phagocytic cup.
Itgb2−/− BMDMs and Itgb2+/− controls were challenged for various times with DAAM particles of differing rigidity coated with 100 pmol/M IgG. They were then fixed, stained for F-actin, and imaged by confocal microscopy. Representative maximum z-projections (top) and y-projections (bottom) of Itgb2+/− (a, b) and Itgb2−/− (c, d) BMDMs in the act of engulfing 18 kPa (a, c) and 0.6 kPa (b, d) DAAM particles (green). F-actin is visualized in magenta. Scale bars = 10 µm. e F-actin accumulation (see “Methods” section) for phagocytic cups, graphed as a function of particle stiffness and Itgb2 genotype. From left to right, n = 63, 57, 59, 58 cell–particle conjugates examined over three independent experiments. P values determined by two-tailed Welch’s t-test. f F-actin clearance index (see “Methods” section) for phagocytic cups graphed as a function of particle stiffness and Itgb2 genotype. From left to right, n = 55, 49, 50, 42 cell–particle conjugates examined over three independent experiments. P values determined by two-tailed Welch’s t-test. Columns and error bars in (e, f) denote mean and SD, respectively. Schematics in (e) and (f) created with BioRender.com released under a Creative Commons Attribution-NonCommercial-NoDerivs 4.0 International license https://creativecommons.org/licenses/by-nc-nd/4.0/deed.en.
Fig. 7
Fig. 7. Talin1 and Vinculin mediated mechanosensing is required for enhanced uptake of stiff cargo.
a, b Cas9+ HoxB8-ER conditionally immortalized progenitors were transduced with either a non-targeting sgRNA or sgRNA targeting Talin1 or Vinculin, and then differentiated into macrophages. These cells were then challenged with 10 pmol/M IgG-coated 18 kPa or 0.6 kPa DAAM particles. Graphs show phagocytic efficiency normalized against the sgNT, 0.6 kPa sample. n = 3 biological replicates for each genotype. P values determined by two-tailed paired ratio t-test. ns not significant. c F-actin coverage after 30 min incubation, determined for Talin1 and Vinculin CRISPR KOs (sgTalin1, sgVinculin) and non-targeting controls (sgNT). Values are sorted into five bins, with colors denoting the fraction of events falling within each bin. Representative bars from one biological replicate are shown, from 18 (sgVinculin) or 20 (sgNT and sgTalin1) events/condition. d Fraction of events that are 20–95% complete after 30 min co-incubation of 100 pmol/M IgG-coated DAAM particles with HoxB8-derived macrophages. n = 3 replicate differentiations (15–20 events/condition). P values determined by two-tailed paired t-test. e Representative images of BMDM-particle interactions showing Vinculin (yellow) and phalloidin (F-actin, magenta) staining, along with DAAM particles in green. Each panel contains top views (right) and side views (left). Scale bars = 5 µm. f Vinculin accumulation (see “Methods” section) at phagocytic cups, graphed as a function of particle stiffness and Itgb2 genotype. From left to right, n = 47, 78, 41, 47 cell–particle conjugates measured over three independent experiments. P values determined by Welch’s two-tailed t-test. ns not significant. All error bars denote SD. Schematics in (a) and (f) created with BioRender.com released under a Creative Commons Attribution-NonCommercial-NoDerivs 4.0 International license https://creativecommons.org/licenses/by-nc-nd/4.0/deed.en.
Fig. 8
Fig. 8. β2 integrins, together with the downstream adaptors Talin1 and Vinculin, mediate a mechanosensitive checkpoint that dictates differential treatment of stiff and soft cargo.
Stiff cargo fully engages β2 integrins and their downstream effectors, leading to rapid “gulping” phagocytosis (left). Conversely, soft cargo induces a distinct type of integrin contact, potentially involving a yet-to-be determined signaling component (denoted by the question mark), leading to the formation of central actin protrusions and a “stalling” response (right).

References

    1. Accarias, S. et al. Genetic engineering of Hoxb8-immortalized hematopoietic progenitors - a potent tool to study macrophage tissue migration. J. Cell Sci.133, jcs236703 (2020). - PubMed
    1. Klichinsky, M. et al. Human chimeric antigen receptor macrophages for cancer immunotherapy. Nat. Biotechnol.38, 947–953 (2020). - PMC - PubMed
    1. Mantovani, A., Allavena, P., Marchesi, F. & Garlanda, C. Macrophages as tools and targets in cancer therapy. Nat. Rev. Drug Discov.21, 799–820 (2022). - PMC - PubMed
    1. Sly, L. M. & McKay, D. M. Macrophage immunotherapy: overcoming impediments to realize promise. Trends Immunol.43, 959–968 (2022). - PubMed
    1. Swanson, J. A. & Baer, S. C. Phagocytosis by zippers and triggers. Trends Cell Biol.5, 89–93 (1995). - PubMed

Publication types

LinkOut - more resources