. 2024 Sep 18;15(1):8214.
doi: 10.1038/s41467-024-52523-y.

Cancer cell stiffening via CoQ10 and UBIAD1 regulates ECM signaling and ferroptosis in breast cancer

Affiliations

Cancer cell stiffening via CoQ10 and UBIAD1 regulates ECM signaling and ferroptosis in breast cancer

Giovanni Tosi et al. Nat Commun. .

Abstract

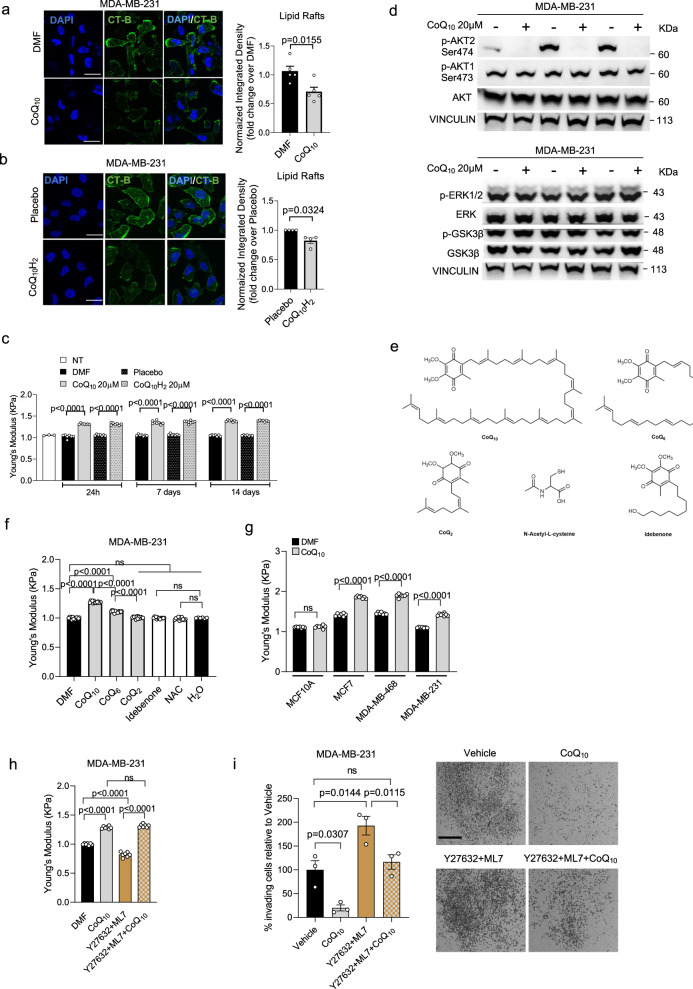
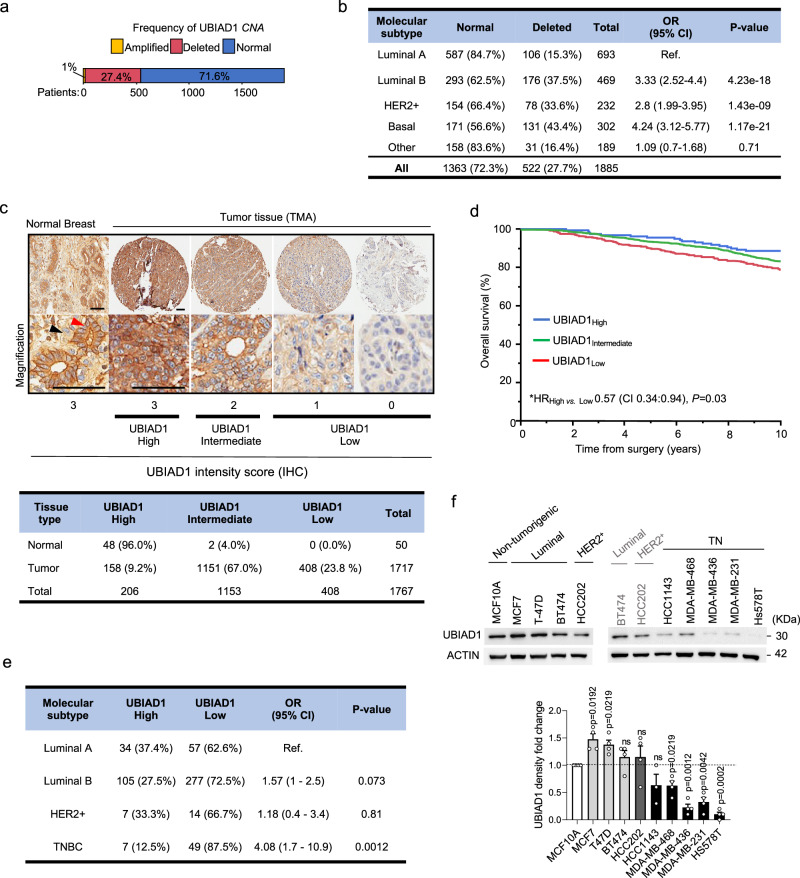
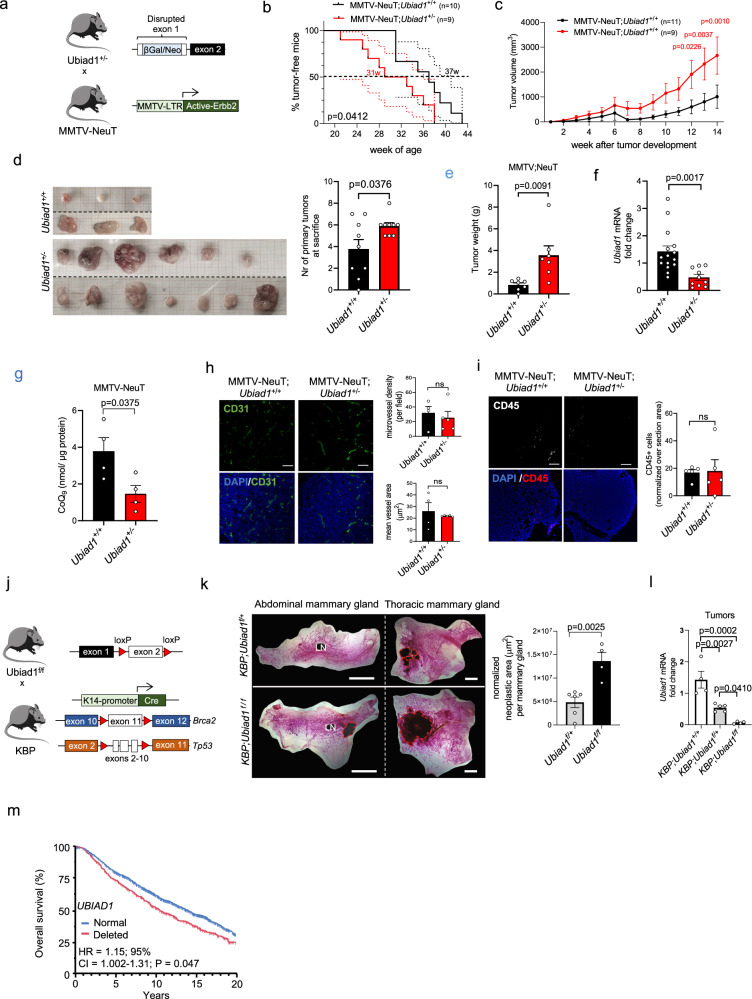
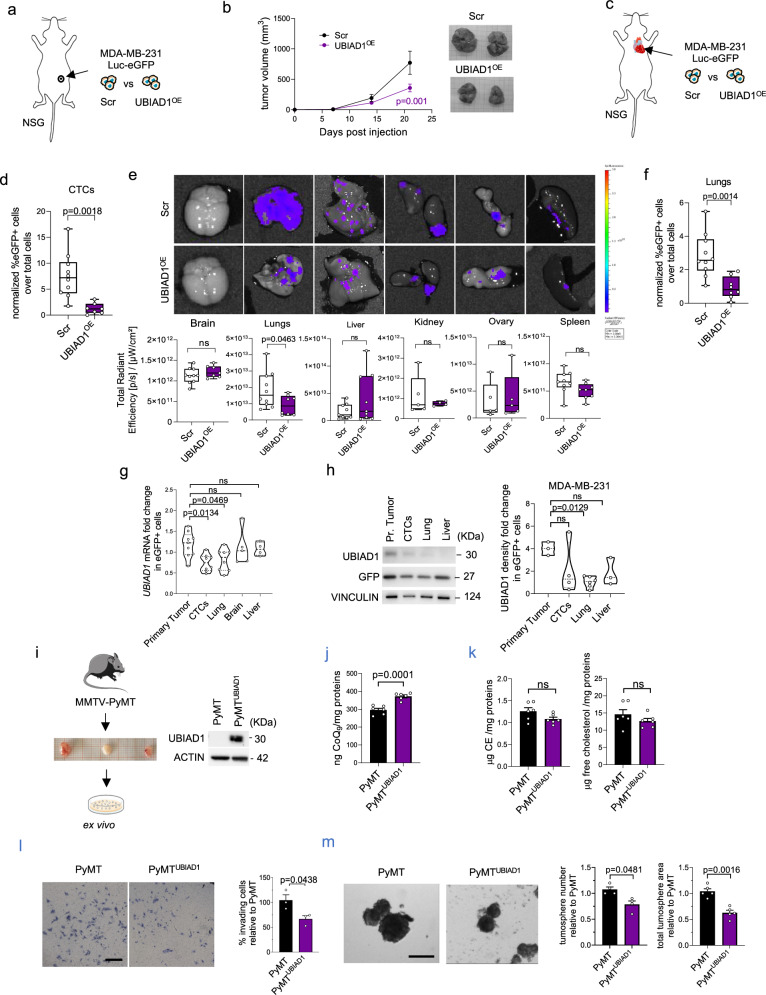
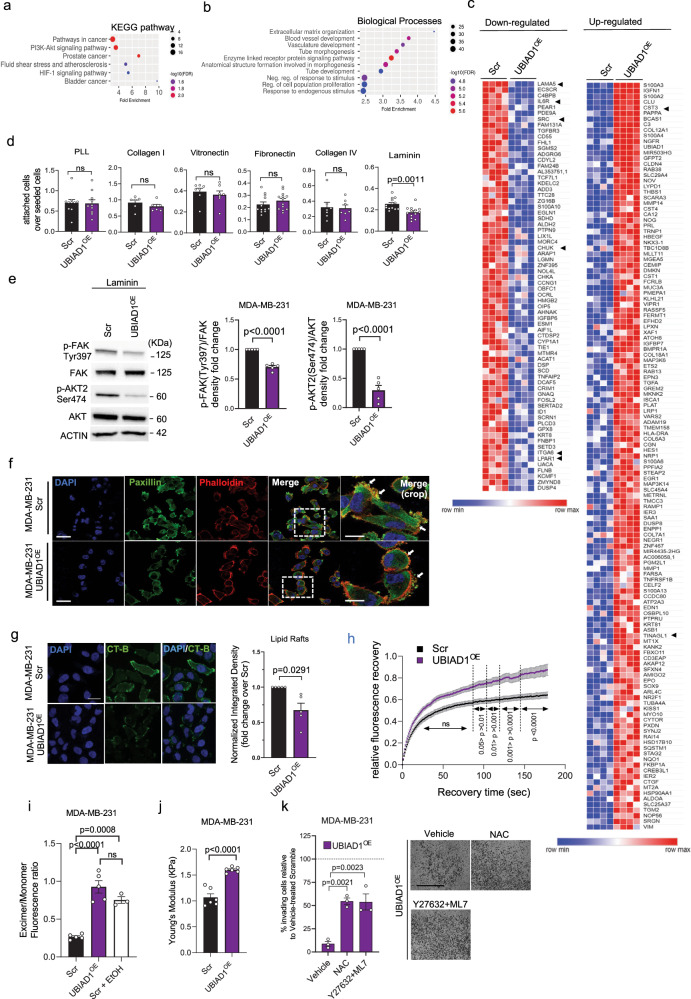
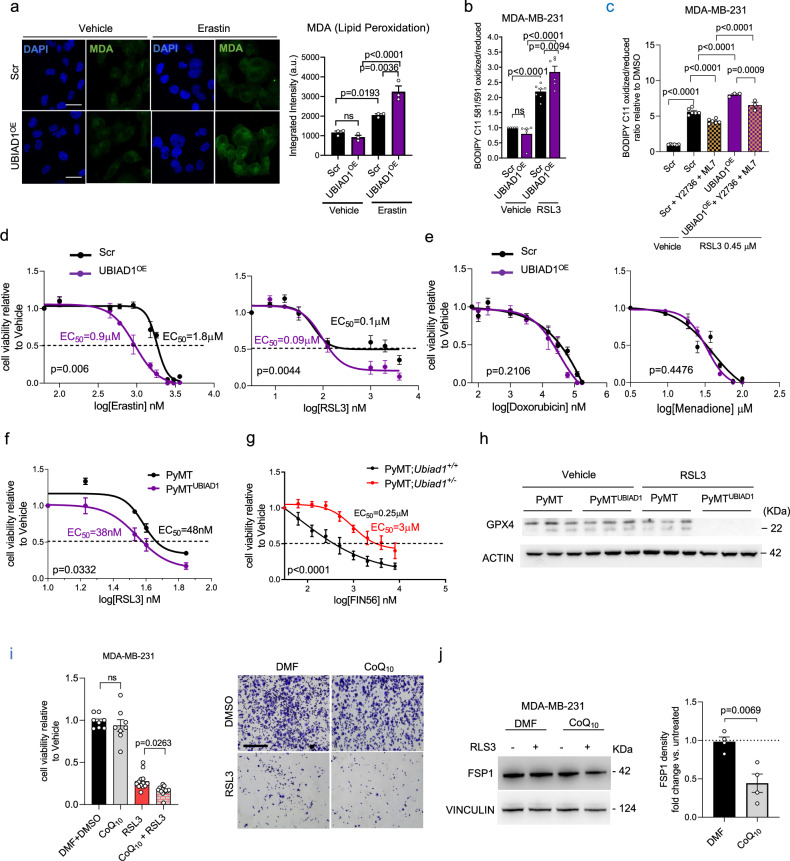
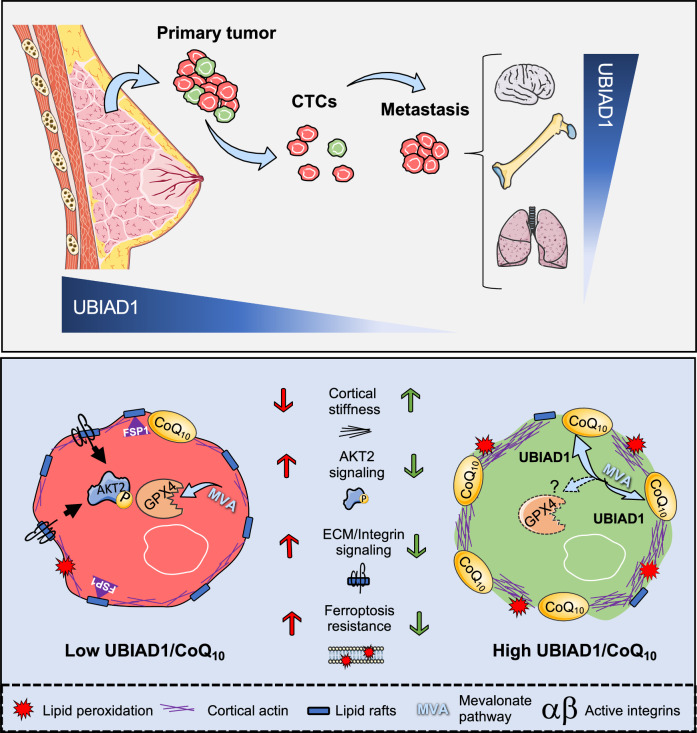
CoQ10 (Coenzyme Q10) is an essential fat-soluble metabolite that plays a key role in cellular metabolism. A less-known function of CoQ10 is whether it may act as a plasma membrane-stabilizing agent and whether this property can affect cancer development and progression. Here, we show that CoQ10 and its biosynthetic enzyme UBIAD1 play a critical role in plasmamembrane mechanical properties that are of interest for breast cancer (BC) progression and treatment. CoQ10 and UBIAD1 increase membrane fluidity leading to increased cell stiffness in BC. Furthermore, CoQ10 and UBIAD1 states impair ECM (extracellular matrix)-mediated oncogenic signaling and reduce ferroptosis resistance in BC settings. Analyses on human patients and mouse models reveal that UBIAD1 loss is associated with BC development and progression and UBIAD1 expression in BC limits CTCs (circulating tumor cells) survival and lung metastasis formation. Overall, this study reveals that CoQ10 and UBIAD1 can be further investigated to develop therapeutic interventions to treat BC patients with poor prognosis.


Conflict of interest statement

The authors declare no competing interests.

Figures

Fig. 1
Fig. 1. CoQ10 alters BC cell stiffness and impairs AKT2 activation.
a, b Representative images of lipid rafts (CT-B) in MDA-MB-231 cells treated with 20 μM CoQ10 (a) or 20 μM CoQ10H2 (b). Scale bar, 25 μm. DAPI and CT-B/lipid rafts. Integrated density normalized to cell number, expressed as fold change over Di-Methyl-Formamide (a) or Placebo (b). Mean ± SEM from n = 5 for (a); n = 4 for b independent experiments, analyzed with a two-tailed t-test. c Stiffness of MDA-MB-231 cell after 20 μM CoQ10 or CoQ10H2 treatment. Each dot is the average of 3 measurements per cell from 2 independent experiments (n = 3 for Not-Treated, n = 8 for CoQ10 and CoQ10H2 at 7 days, n = 7 for others). P-values from two-tailed t-test. d Western blot for AKT1, AKT2, ERK1/2, and GSK3β phosphorylation to assess PI3K-AKT, MEK/ERK, and Wnt pathway activation. VINCULIN as control. Data from independent replicates (n = 3). e Chemical structures of CoQ compounds and antioxidants, including N-Acetyl-L-Cysteine (NAC) and Idebenone. f Stiffness of MDA-MB-231 cell after 24-h treatment with 20 μM CoQ10, CoQ6, CoQ2, Idebenone, or 10 mM NAC. Vehicles: Di-Methyl-Formamide or H2O. Each dot is the average of 3 measurements per cell from 3 independent experiments (n = 6 for H2O, n = 15 for CoQ2, n = 14 for others). Mean ± SEM, adjusted p-values from one-way ANOVA and Tukey’s test. g Stiffness in MCF10A and breast cancer cell lines after 1 week of 20 μM CoQ10 treatment. Each dot is the average of 3 measurements per cell from 2 independent experiments (n = 8 for MDA-MB-231 CoQ10, n = 7 for others). Mean ± SEM, p-values from two-tailed t-test. h Stiffness of MDA-MB-231 cells treated with 20 μM CoQ10, ROCK inhibitor Y27632 (20 μM), MLCK inhibitor ML7 (20 μM), or their combination. Each dot is the average of 3 measurements per cell from 2 independent experiments (n = 7). Mean ± SEM, adjusted p-values from one-way ANOVA and Tukey’s test. i Invasion assay of MDA-MB-231 cells through Matrigel-coated membranes, treated for 24 h with Di-Methyl-Formamide, 20 μM CoQ10, Y27632 (20 μM) + ML7 (20 μM), or their combination. Data are percentage of invading cells relative to Vehicle (100%). Each dot is the average of two wells from 3 independent experiments. Mean ± SEM, adjusted p-values from one-way ANOVA and Tukey’s test. Source data are provided in Source data file.
Fig. 2
Fig. 2. Loss of the CoQ10-biosynthetic enzyme UBIAD1 is associated to a worse prognosis in BC patients.
a Distribution of UBIAD1 copy number alterations (CNA) in the METABRIC cohort of breast cancer patients (see Methods). Percentages of patients with no CNA (Normal), amplifications (Amplified), or deep and shallow deletions (Deleted) are indicated. b Association between UBIAD1 status (Normal vs. Deleted) and PAM50 BC subtypes in the METABRIC cohort. HER2 +, HER2-positive. OR, odds ratio; CI, confidence intervals. P-value from two-sided Fisher’s exact test, with Luminal A subtype as the reference (ref.). The number and percentage of patients in each group are shown. c Representative images showing heterogeneous UBIAD1 expression in a cohort 1767 breast samples available as TMA (1717 tumor plus 50 normal mammary gland samples) by IHC. Red and black arrowheads: luminal and basal cells, respectively. Tumors are classified as High, Intermediate, or Low based on UBIAD1 intensity scores. Scale bars, 100 µm. Quantitative analysis of UBIAD1 expression by IHC in normal and tumor tissues, with the number and percentage of samples in each UBIAD1 category (High, Intermediate, Low) shown. d Kaplan-Meier analysis of overall survival in the TMA cohort, stratified by UBIAD1 status as in (c). *HR, multivariate hazard ratio for UBIAD1High vs. UBIAD1Low groups. HR is calculated with 95% CI using multivariate Cox proportional hazards regression, adjusted for ER/PGR, pT, pN, Ki-67, HER2, age, and grade. CI and P (p-value) are indicated. P-value from two-sided Wald test. e Association between UBIAD1 status (High, Low) and BC molecular subtypes. HER2 +, HER2-positive; TNBC, triple-negative. OR, odds ratio; CI, confidence intervals. P-value from Fisher’s exact test with Luminal A subtype as reference (ref.). The number and percentage of patients in each group are shown. P-value from two-sided Fisher’s exact test. f Western blot analysis of UBIAD1 protein expression in human BC cell lines, grouped by molecular subtype. HER2+, HER2-positive; TN, triple-negative. Densitometric analysis of UBIAD1 protein expression with each dot representing n = 4 independent seedings and treatments. Data normalized over ACTIN and expressed relative to the non-tumorigenic breast line MCF10A. Mean ± SEM. P-value calculated using one-sample (two-tailed) t-test to compare the mean of each sample with 1.0. ns, not significant. Source data are provided as a Source data file.
Fig. 3
Fig. 3. Deletion of Ubiad1 gene accelerates BC development in mouse models.
a Generation of MMTV-NeuT BC model with exon 1 disruption of the Ubiad1 gene. b Tumor-free survival from birth to tumor detection. Dashed lines show 95% Confidence Interval (CI). Group mean survival is reported. Analysis used the Gehan-Breslow-Wilcoxon test (1 degree-of-freedom). c Tumor growth from first palpable tumor (week 0). Data for n = 11 MMTV-NeuT;Ubiad1+/+ and n = 9 MMTV-NeuT;Ubiad1+/− mice shown as mean ± SEM. Adjusted p-value from two-way ANOVA and Sidak’s test. d Tumors from two MMTV-NeuT;Ubiad1+/+ and two MMTV-NeuT;Ubiad1+/− mice. Number of primary tumors per mouse (n = 9 mice) shown as mean ± SEM. P-value from a two-tailed t-test. e Total tumor weight per n = 7 mice/group shown as mean ± SEM. P-value from a two-tailed t-test. f Ubiad1 mRNA levels in n = 15 MMTV-NeuT;Ubiad1+/+ and n = 10 MMTV-NeuT;Ubiad1+/− tumors. Mean ± SEM. P-value from a two-tailed t-test. g CoQ9 levels in tumor lysates from n = 4 mice/group. Data shown as mean ± SEM. P-value from a two-tailed t-test. h CD31 staining in tumors. Each dot represents a tumor from n = 4 MMTV-NeuT;Ubiad1+/+ and n = 5 MMTV-NeuT;Ubiad1+/− mice. Scale bar, 100 µm. Micro-vessel density and area shown as mean ± SEM. P-value from a two-tailed t-test. i CD45 staining in tumors. Each dot represents a tumor from n = 5 mice/group. Scale bar, 100 µm. CD45+ cells shown as mean ± SEM. P-value from a two-tailed t-test. j Generation strategy for the KBP BC model with exon 2 deletion of Ubiad1 in basal mammary gland cells. k Whole mount mammary gland staining to visualize lesions in heterozygous (Ubiad1f/+) or homozygous (Ubiad1f/f) Ubiad1 knockout KBP females. Red dashed lines highlight lesions. Each dot represents a mouse (n = 6 KBP;Ubiad1f/+ and n = 4 KBP;Ubiad1f/f). Data shown as mean ± SEM. P-value from a two-tailed t-test. LN, Lymph node. l Ubiad1 mRNA levels in n = 4 KBP, n = 5 KBP;Ubiad1f/+, and n = 4 KBP;Ubiad1f/f tumors. Mean ± SEM. Adjusted p-value from one-way ANOVA and Tukey’s test. m Kaplan-Meier analysis of survival in METABRIC BC patients by UBIAD1 status (522 for UBIAD1 deleted and 1363 for UBIAD1 normal. *HR, multivariate hazard ratio adjusted for clinicopathological parameters. HR and 95% Confidence Interval from Cox regression after adjustment. CI and P-value indicated. P-value from two-sided Wald test without adjustments for multiple comparisons. Source data are provided in Source data file.
Fig. 4
Fig. 4. UBIAD1 expression increases CoQ10 level and reduces BC dissemination.
a, b Tumor growth in NSG tumor-bearing mice engrafted in the mammary fat pad with Scramble and UBIAD1-overexpressing MDA-MB-231 cells. Data are mean ± SEM, with n = 8 mice per group from two independent experiments. Adjusted p-value from two-way ANOVA and Sidak’s test. cf Scramble and UBIAD1-overexpressing MDA-MB-231 cells injected intracardially into NSG mice. df Data shown as box plots with median, 25th, and 75th percentiles and with whiskers at minimum and maximum values. P-value from two-tailed unpaired t-test. d Percentage of Circulating Tumor Cells (CTCs) in whole blood. Each dot represents a mouse (n = 10 MDA-MB-231 Scr and n = 7 MDA-MB-231 UBIAD1OE). Gating: eGFP+ cells from Single_cell_2 population. e eGFP signal of MDA-MB-231-derived metastasis in different organs. Each dot represents a mouse. f Percentage of eGFP+ cells in dissociated lungs. Each dot represents a mouse (n = 10 MDA-MB-231 Scr and n = 8 MDA-MB-231 UBIAD1OE). g, h UBIAD1 mRNA and protein expression in eGFP+ cells from whole blood, organs, or primary tumors of MDA-MB-231 Scr-injected mice. Each dot represents a single organ pooled from 3 independent experiments. Data are mean ± SEM. Adjusted p-value from one-way ANOVA and Sidak’s test. im Generation and characterization of Scramble (PyMT) and UBIAD1-overexpressing (PyMTUBIAD1) ex vivo cultures from MMTV-PyMT-derived tumors. i UBIAD1 protein expression. j Total CoQ9 in mouse ex vivo cultures. Each dot represents an independent seeding (n = 6). Data shown as mean ± SEM. P-value from two-tailed unpaired t-test. k Cholesterol esters (CE) and free cholesterol levels in mouse ex vivo cultures. Each dot represents an independent seeding (n = 6). Data shown as mean ± SEM. P-value from two-tailed unpaired t-test. l Invading mouse ex vivo PyMT and PyMTUBIAD1 cells. Data expressed as percentage of invading cells compared to PyMT (set at 100%). Each dot represents an independent seeding (n = 3). Data shown as mean ± SEM. P-value from two-tailed unpaired t-test. m PyMT tumorspheres. Quantification of total tumorspheres and total area relative to PyMT cells. Each dot represents an independent seeding (n = 4 for number, n = 5 for area). Data shown as mean ± SEM. P-value from two-tailed unpaired t-test. Source data are provided in Source data file.
Fig. 5
Fig. 5. UBIAD1 expression impairs AKT oncogenic pathway and alter cytoskeletal stiffness of BC cells.
ac RNA-seq analysis of MDA-MB-231 Scramble (Scr) and UBIAD1-overexpressing (UBIAD1OE) cells. a KEGG pathway and b Gene Ontology (GO) enrichment analysis on differentially expressed genes. c Downregulated and upregulated genes in UBIAD1OE cells. Arrowheads: main genes listed in the GO analysis’ top rank. d Cell adhesion assay in MDA-MB-231. Data shown as ratio of attached cells over total seeded cells. Mean ± SEM of n = 10 for PLL, n = 6 for Collagen I, n = 7 for Vitronectin, n = 12 for Collagen IV, and n = 13 for Laminin independent seedings. P-value from two-tailed unpaired t-test. ns, not significant. e Phospho-FAK and phospho-AKT2 in laminin-attached cells. Densitometric analysis of phosphorylated protein over total protein. Each dot represents an independent seeding (n = 5). Data are mean ± SEM. P-value from two-tailed one-sample t-test comparing the mean of UBIAD1OE with 1.0. f Paxillin, DAPI, and Phalloidin staining. Arrows: cell adhesions or blebbing structures. Scale bar, 60 μm; crop, 30 μm. Results of three independent cell seedings, stainings, and analyses. g Lipid rafts (CT-B). Scale bar, 25 μm. Integrated density normalized over number of cells. Data as fold change over Scr. Each dot represents the average of five pictures for n = 5 independent seedings. P-value from two-tailed one-sample t-test comparing the mean of UBIAD1OE with 1.0. h FRAP analysis on MDA-MB-231 cells. Data shown as relative fluorescence intensity over recovery time. Each dot represents a single cell (n = 25 Scr and n = 27 UBIAD1OE) analyzed across three independent seedings, stainings, and analyses. Adjusted p-value from two-way ANOVA and Sidak’s test. ns, not-significant. i Membrane fluidity analysis. EtOH as a positive control. Each dot represents an independent seeding (n = 5 for Scr and UBIAD1OE, and n = 3 for Scr+EtOH). Data are mean ± SEM. Adjusted p-value from one-way ANOVA and Tukey’s test. j Cellular stiffness. Each dot represents the average of 3 repeated measurements for a single cell (n = 6 cells/group). P-value from two-tailed unpaired t-test. k Percentage of invading cells compared to Vehicle-treated Scr (set at 100%). Scale bar, 100 µm. N-Acetyl-L-Cysteine (NAC). Each dot represents an independent seeding (n = 3). Data are mean ± SEM. Adjusted p-value from one-way ANOVA and Dunnett’s test. Source data are provided in Source Data file.
Fig. 6
Fig. 6. UBIAD1 affects ferroptosis resistance in BC cells.
a Malondialdehyde (MDA) staining in MDA-MB-231 cells treated with Vehicle (DMSO) or 2 μM Erastin for 24 h. Scale bar, 100 μm. MDA signal intensity normalized over cell number. Mean ± SEM of three independent experiments. Adjusted p-value from one-way ANOVA and Sidak’s test. b Lipid peroxidation in cells treated with vehicle (DMSO) or 0.45 μM RSL3 for 24 h. Data expressed as fold change over vehicle-treated cells. Each dot represents an independent experiment (n = 6 for Vehicle-treated Scramble (Scr), n = 6 for RSL3-treated Scr and Scr+Y2736 + ML7, and n = 3 for RSL3-treated UBIAD1OE and UBIAD1OE + Y2736 + ML7). Mean ± SEM. Adjusted p-value from one-way ANOVA followed by Sidak’s test. c Lipid peroxidation in cells treated with vehicle (DMSO), 0.45 μM RSL3 for 12 h, in combination with 20 μM Y27632 and 20 μM ML7 inhibitors. Gating: P1-Live_Cells-FITC/PE. Data expressed as fold change over vehicle-treated cells. Each dot represents an independent experiment (n = 5 for Vehicle-treated and n = 6 for RSL3-treated). Mean ± SEM. Adjusted p-value from one-way ANOVA and Tukey’s test. d, e Cell viability assay with Erastin and RSL3 (d), Doxorubicin (e), and Menadione (e). Cells treated for 24 h. Mean ± SEM of n = 5 independent replicates. P-value from two-way ANOVA. f Cell viability assay with RSL3 in MMTV-PyMT ex vivo cultures. Mean ± SEM of n = 3 independent replicates. P-value calculated using two-way ANOVA. EC50 reported. g Cell viability assay with FIN56 in PyMT;Ubiad1+/+ and PyMT;Ubiad1+/− cells. Mean ± SEM of n = 5 independent replicates. P-value from two-way ANOVA. EC50 reported. h GPX4 protein in ex vivo cells treated with vehicle (DMSO) or 50 nM RSL3 for 24 h. ACTIN used as loading control. Each column represents an independent replicate (n = 3). i Cell viability assay in cells were treated for 24 h with 0.45 μM RSL3 alone, 20 μM CoQ10 alone or in combination. Each dot represents an independent seeding, treatment and analysis (n = 8 for DMF + DMSO (Vehicle) and CoQ10 only, and n = 13 for RSL3 only and CoQ10 + RSL3). Mean ± SEM. Adjusted p-value from one-way ANOVA and Sidak’s test. j FSP1 protein with DMF (Vehicle) or RSL3 0.45 μM for 24 h with or without CoQ10 20 μM. VINCULIN used as loading control. Each dot represents an independent experiment (n = 4). Mean ± SEM. P-value from two-tailed unpaired t-test. Source data are provided in Source data file.
Fig. 7
Fig. 7. CoQ10 and UBIAD1 expression impair BC spreading and survival via modification of plasma membrane-dependent signaling.
Expression of the CoQ10-biosynthetic enzyme UBIAD1 is reduced in highly aggressive BC, especially during the metastatic cascade. Moreover, the ability of colonize specific distant sites is associated to specific UBIAD1 expression levels. High levels of CoQ10 or expression of UBIAD1 in BC alters lipid raft plasma membrane fluidity that leads to increase cellular stiffness, reduced integrin activity and associated oncogenic AKT2 signaling. Furthermore, BC cells with high UBIAD1/CoQ10 levels show increased sensitivity to ferroptosis and lipid peroxidation possibly by decreasing GPX4 synthesis and FSP1 levels contributing to the impaired blood circulating cancer cell survival and reduced lung colonization. The images were generated using Smart Servier Medical Art under license CC BY4.0.

References

    1. Morton, R. A. Ubiquinone. Nature182, 1764–1767 (1958). - PubMed
    1. Crane, F. L. Discovery of ubiquinone (coenzyme Q) and an overview of function. Mitochondrion7, S2–S7 (2007). - PubMed
    1. Navas, P., Villalba, J. M. & de Cabo, R. The importance of plasma membrane coenzyme Q in aging and stress responses. Mitochondrion7, S34–S40 (2007). - PubMed
    1. Agmo Hernández, V., Eriksson, E. K. & Edwards, K. Ubiquinone-10 alters mechanical properties and increases stability of phospholipid membranes. Biochim. Biophys. Acta (BBA) - Biomembr.1848, 2233–2243 (2015). - PubMed
    1. Sévin, D. C. & Sauer, U. Ubiquinone accumulation improves osmotic-stress tolerance in Escherichia coli. Nat. Chem. Biol.10, 266–272 (2014). - PubMed

Publication types

Associated data