. 2024 Sep 18;15(1):8179.
doi: 10.1038/s41467-024-52543-8.

Activation of osmo-sensitive LRRC8 anion channels in macrophages is important for micro-crystallin joint inflammation

Affiliations

Activation of osmo-sensitive LRRC8 anion channels in macrophages is important for micro-crystallin joint inflammation

Twinu Wilson Chirayath et al. Nat Commun. .

Abstract

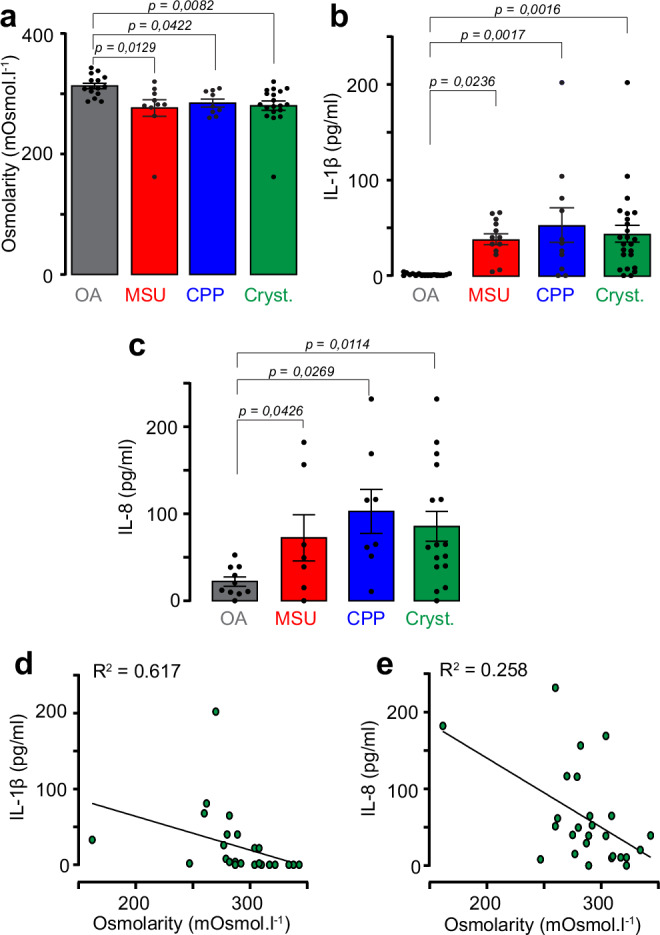
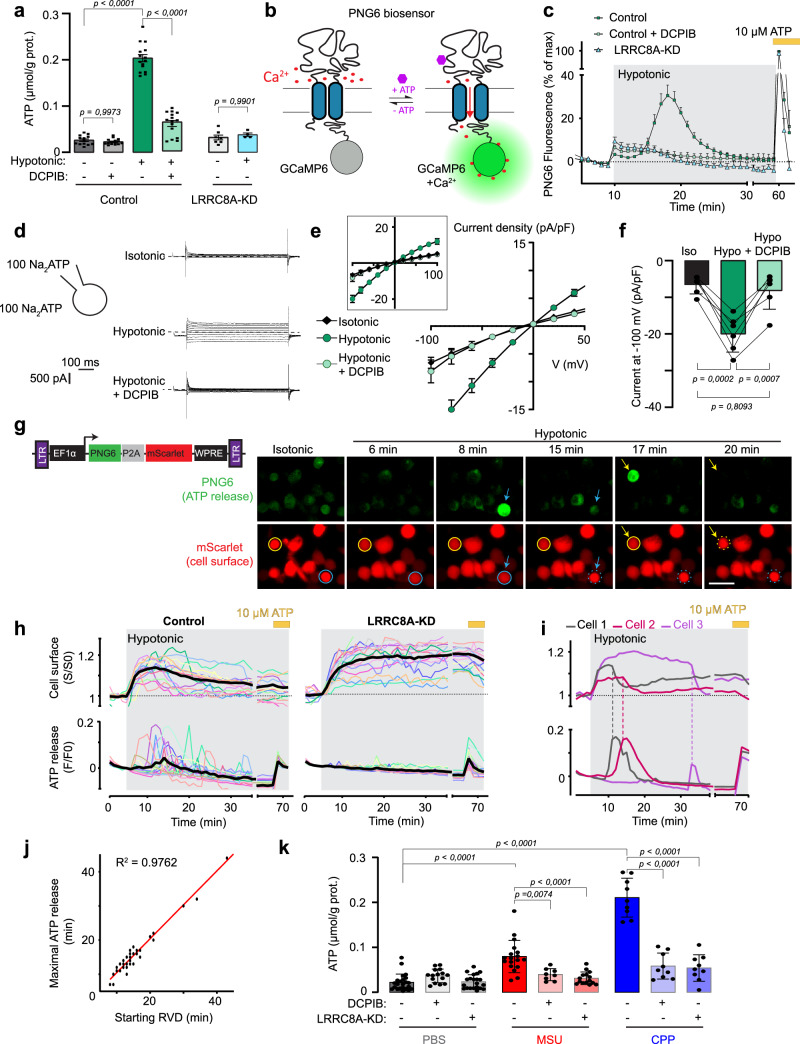
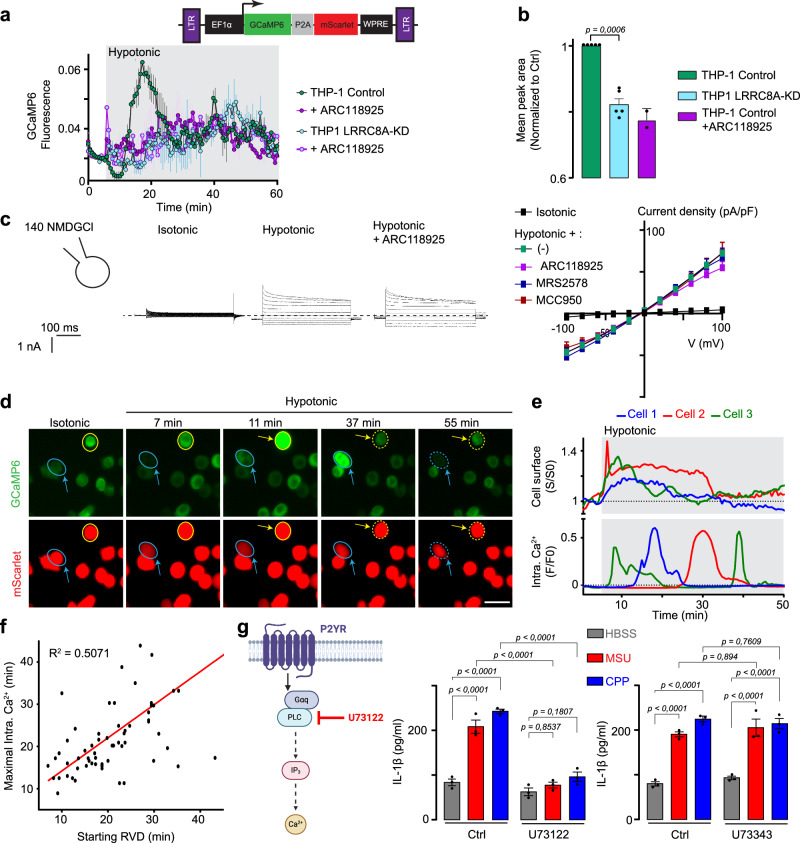
Deposition of monosodium urate and calcium pyrophosphate (MSU and CPP) micro-crystals is responsible for painful and recurrent inflammation flares in gout and chondrocalcinosis. In these pathologies, the inflammatory reactions are due to the activation of macrophages responsible for releasing various cytokines including IL-1β. The maturation of IL-1β is mediated by the multiprotein NLRP3 inflammasome. Here, we find that activation of the NLRP3 inflammasome by crystals and concomitant production of IL-1β depend on cell volume regulation via activation of the osmo-sensitive LRRC8 anion channels. Both pharmacological inhibition and genetic silencing of LRRC8 abolish NLRP3 inflammasome activation by crystals in vitro and in mouse models of crystal-induced inflammation. Activation of LRRC8 upon MSU/CPP crystal exposure induces ATP release, P2Y receptor activation and intracellular calcium increase necessary for NLRP3 inflammasome activation and IL-1β maturation. We identify a function of the LRRC8 osmo-sensitive anion channels with pathophysiological relevance in the context of joint crystal-induced inflammation.


Conflict of interest statement

The authors declare no competing interests.

Figures

Fig. 1
Fig. 1. Presence of MSU or CPP crystals in human synovial fluids is associated with low osmolarity and IL-1β release.
ac osmolarity (a, n = 15 OA, 10 MSU, 9 CPP) IL-1β level (b, n = 17 OA, 13 MSU, 11 CPP) and IL-8 (c, n = 10 OA, 6 MSU, 8 CPP) level measured in the SF of osteoarthritis (OA), MSU and CPP disease. d, e Correlation between IL-1β (d), IL-8 (e) level and SF osmolarity (n = 25 paired samples). Crystal (Cryst.) refers to all values obtained for gout and CPP- diseases. Values are mean ± SEM. Multiple comparisons by one-way ANOVA (ac). R2 coefficients were calculated with the Spearman test (d, e).
Fig. 2
Fig. 2. Level of inflammation in in vivo microcrystal-induced mouse air pouch model depends on osmolarity and cell water flux.
a Air pouch was created by injection of 3 ml sterile air in subcutaneous dorsal area on days 0 and 3. On day 6, sterile MSU or CPP crystals (1 mg in 1 ml PBS) or PBS were injected into the air pouch and inflammation was assessed 6 h later by quantifying cytokine levels and cell infiltration in the lavage solution. b Plasma osmolarity (in mOsm.l−1) measured in mice receiving intraperitoneal injection of PBS (isotonic, 300 mOsm.l−1, n = 11 mice) or 1 ml mannitol 20 % (hypertonic 1050 mOsm.l−1, n = 10 mice) every day from day 4 to 6. c, d Representative micrographs (c, HE staining) and semi-quantitative inflammation score (d) of air pouch membranes obtained from control (n = 4) and mannitol-treated mice receiving PBS, or MSU or CPP crystal injection (n = 8 mice/group). Scale bar, 40 μm. e, f cell infiltration numbers (e) (n = 8 mice PBS, 6 mannitol, 7 MSU and MSU+mannitol, 8 CPP and CPP+mannitol) and IL-1β concentrations (f, ELISA quantification) (n = 8 mice in PBS, MSU, CPP and CPP+mannitol, 6 in mannitol, 7 MSU+mannitol) measured in the air pouch lavage. g, h Representative micrographs (g) and semi-quantitative inflammation score (h) of the air pouch membranes obtained from control and intraperitoneal mercury (HgCl2)-treated mice receiving PBS, or MSU or CPP crystal injection (n = 4 mice in HgCl2, 9 PBS, 10 in MSU and CPP crystal groups). Scale bar, 20 μm. i, j Cell infiltration numbers (i) and IL-1β level (j) measured in air-pouch lavage collected from the mouse groups treated or not with mercury (n = 10 mice/per group). Values are mean ± SEM. Two-tailed unpaired t-test (b), two-way ANOVA with Sidak’s multiple comparisons test (cj).
Fig. 3
Fig. 3. LRRC8 channels mediate NLRP3 inflammasome activation and IL-1β secretion during crystal exposure in THP−1 macrophages.
a, b IL−1β release in supernatants of primed THP−1 cells stimulated with crystals in isotonic (PBS) or hypertonic solutions (mannitol) (a, n = 4 independent experiments) and in isotonic with/without DCPIB (b, n = 6 independent experiments). c, d Cellular volume change measured in THP−1 cells induced by PBS alone or PBS containing MSU (c) or CPP (d) with/without DCPIB, n = 4 independent experiments. e, f LRRC8A protein expression level in control and LRRC8A-KD THP-1 cells (n = 5 independent preparations). g Chloride whole-cell currents in control (upper panel) and LRRC8A-KD (lower panel) THP-1 cells recorded successively with isotonic and hypotonic solution (5 min) and in the presence of DCPIB. Pipette and bath solutions contained NMDG-Cl. The corresponding I/V curves calculated with isotonic solution (black), hypotonic solution (green) and with DCPIB (light green) are depicted on the right. (n = 22 and 9 independent recordings for control and LRRC8A-KD THP-1 cells, respectively). h, i Micrographs illustrating the ASC speck formation (h) and percentage of cells containing ASC speck (i, n = 4 independent experiments) detected in control and LRRC8A-KD cells maintained in isotonic or hypotonic solutions. Red arrows indicate the ASC specks. Scale bar 30 µm. j Western blot analysis of NLRP3 inflammasome components and supernatant IL-1β release in control and LRRC8A-KD THP-1 cells after exposure to a hypotonic solution or a Poly(dA:dT) stimulation. k Quantification of IL-1β release in supernatant of control and LRRC8A-KD cells after hypotonic exposure (n = 3 independent experiments). l, m IL-1β release (l) and percentage of cells containing ASC speck (m) measured in control and LRRC8A-KD cells after MSU and CPP exposure (n = 6 and 3 independent experiments). n Cellular volume change measured in control and LRRC8A-KD cells after MSU crystal exposure. (n = 9 independent experiments). All values are mean ± SEM. Two-tailed unpaired t-test (e, f, k), two-way ANOVA, Sidak’s multiple comparisons test (a, b, i, l, m).
Fig. 4
Fig. 4. Deletion of Lrrc8A in monocyte/macrophage lineage abolishes microcrystal-induced inflammation in in vivo experiments.
a Percentage of macrophages expressing LRRC8A assessed by FACs (left, representative expression of each group; middle and right, mean ± SEM). Cells collected from air pouch lavage from Lrrc8cont and Lrrc8Mo mice were stained with antibody against F4/80 and LRRC8A (n = 10 Lrrc8cont, and n = 14 Lrrc8Mo mice). be Lrrc8A deletion in macrophage linage reduced inflammation in air pouch model: IL-1β level quantified by ELISA (b, n = 7/9/10 WT mice PBS/MSU/CPP, 8/10/11 Lrrc8Mo PBS/MSU/CPP); cell infiltration number (c, n = 7/10/14 WT mice PBS/MSU/CPP, 8/20/16 Lrrc8Mo PBS/MSU/CPP); percentage of macrophages (d) and neutrophils (e) assessed by FACs measured in air pouch lavage (n = 7/9/6 WT mice PBS/MSU/CPP, 7/9/9 Lrrc8Mo PBS/MSU/CPP). f Representative air pouch membrane histology after HE staining and (g) air pouch membrane semi-quantitative inflammation score (n = 8/9/8 WT mice PBS/MSU/CPP, 7/9/14 Lrrc8Mo PBS/MSU/CPP). Scale bar, 20 μm. h, i Lrrc8A deletion in BMDMs reduced LRRC8 expression (h) and IL-1β production (i), quantified by FACs and ELISA, respectively, in supernatant of BMDM isolated from Cx3Cr1CreERT2 or Cx3Cr1CreERT2/Lrrc8Afl/fl mice, treated by tamoxifen from day 1 to 21, then stimulated with MSU or CPP (200 µg/ml, 6 h, n = 5 and 6 independent experiments). Values are mean ± SEM. Two-tailed unpaired t-test (a, h), two-way ANOVA, Sidak’s multiple comparisons test (bg, i).
Fig. 5
Fig. 5. Activation of LRRC8 mediates ATP release by THP-1 macrophages.
a ATP levels in supernatants of control and LRRC8A-KD THP-1 cells under isotonic or hypotonic solutions ± DCPIB (n = 6–15 from 6 independent experiments). b Illustration of the PNG6 biosensor fluorescence change upon extracellular ATP binding. c Kinetics of ATP release evoked by hypotonic solution in control and LRRC8A-KD THP-1 cells expressing the PNG6 biosensor with/without DCPIB. Maximum fluorescence was evoked by ATP application at the end of the recordings (n = 5 recordings from 3 independent experiments). df ATP whole-cell currents in control THP-1 cells in isotonic and hypotonic ATP bath solutions with/without DCPIB (d). I/V curves (e) and mean currents at -100 mV (f) in isotonic (black) and hypotonic solution (green, 5 min) and with DCPIB (light green). n = 6 independent recordings. g Lentiviral construction expressing PNG6-P2A-Scarlet and images showing ATP release (green PNG6) and surface/volume decrease (red mScarlet) in control THP-1 cells under hypotonic solution. Yellow and blue arrows identified cells with different time responses. Scale bar 20 μm. n = 3 independent experiments. h Single-cell video recording of surface change and ATP release in control and LRRC8A-KD THP-1 cells expressing PNG6. Colored lines represent individual cells; black lines show mean surface change and ATP-evoked fluorescence. i Surface change (upper) and ATP release (lower) in 3 cells during a hypotonic challenge. j Time correlation between ATP release event and RVD induction (n = 32 cells from 2 independent experiments). k ATP levels in supernatants of control and LRRC8A-KD THP-1 cells exposed to MSU or CPP crystals with/without DCPIB. n = 8–23 from 8 independent experiments (control THP-1) and n = 9–21 from 7 independent experiments (LRRC8A-KD cells). Values are mean ± SEM. One-way ANOVA (f), 2-way ANOVA, Sidak’s multiple comparisons test (a, k). Spearman correlation test (j).
Fig. 6
Fig. 6. LRRC8-evoked ATP release governs regulatory volume change and NLRP3 inflammasome activation via P2YR signaling.
a Monitored surface changes (mScarlet fluorescence) in control THP-1 cells under hypotonic conditions (100 mOsm.l−1) with and without apyrase (A6535, 20U/ml). n = 3 independent experiments with 30-66 cells per experiment. b, c Western blot analysis and quantification of IL-1β release in control THP-1 cells under hypotonic conditions with varying apyrase levels and grades. Values normalized to the hypotonic condition without apyrase, mean ± SEM from 3-5 experiments. d Surface changes in control and LRRC8A-KD THP-1 cells during hypotonic challenge with various P2Y receptor antagonists (10 µM). n = 3 independent experiments with 30-66 cells per experiment. e Western blot analysis of mature IL−1β in supernatants and pro-IL-1β and LRRC8A expression in cell extracts from control and LRRC8A-KD cells under hypotonic conditions with/without P2Y2 antagonist ARC118925 (10 µM). f Quantification of IL-1β release in control THP-1 cells under hypotonic stimulation with/without 10 µM of each antagonist ARC118925 (P2Y2), MRS2500 (P2Y1), MRS2578 (P2Y6), or NF340 (P2Y11). Results normalized to conditions without antagonists, n = 4–5 independent experiments. g ELISA measurement of IL-1β levels in the supernatant of control THP−1 cells exposed to MSU or CPP crystals (200 µg/ml, 3 h) with/without antagonists ARC118925 (10 µM) or MRS2578 (10 µM). n = 4 independent experiments. h, i Micrographs and inflammation scores for air pouch membranes from control and MRS2578-treated mice injected with PBS, MSU, or CPP crystal (n = 8 mice/group). Scale bar, 40 μm. j, k Cell infiltration (j, n = 9 PBS and MSU, 8 CPP, 7 MRS, 8 MRS + MSU/CPP) and IL-1β (k, n = 9 PBS and MSU, 8 CPP, 7 MRS, 9/8 MRS + MSU/CPP) levels in air pouch lavage from mice treated with/without MRS2578. Values are mean ± SEM. Two-tailed unpaired t-test (c, f), two-way ANOVA, Sidak’s multiple comparisons test (g, ik).
Fig. 7
Fig. 7. Intracellular calcium signaling through P2YR is required for NLRP3 inflammasome activation.
a Video-microscopy recording of intracellular calcium during hypotonic challenge in control and LRRC8A-KD THP-1 cells expressing GCaMP6-P2A-mScarlet, with or without P2Y2 antagonist ARC118925 (10 µM). b Quantification from (a) showing area under the peaks averaged and normalized to control. Data are mean ± SEM from n = 5 experiments for control and LRRC8A-KD, n = 2 experiments for ARC118925. 30–60 cells per experiment. c Chloride currents in control THP-1 cells in isotonic (300 mOsm.l−1) and hypotonic (220 mOsm.l-1) NMDGCl solutions, with/without ARC118925 (10 µM). I/V curves show mean current density under hypotonic conditions with ARC118925, MRS2578, or MCC950 (10 µM). Pipette solution contained NMDGCl. Data are mean ± SEM from 4 to 15 cells, n = 4–15 experiments. df Simultaneous intracellular calcium signals and cell surface analysis during hypotonic challenge at single-cell level. d Combined recording of cell surface variation (mScarlet) and intracellular calcium (GCaMP6). Scale bar 20 µm. e Single-cell analysis shows RVD initiation coincides with a burst of intracellular calcium release. f Time correlation between RVD initiation and peak of intracellular calcium signal. df: n = 2 experiments, analysis of 70 cells. g Left panel: cartoon of PLC pathway activation by Gq-coupled P2YR leading to intracellular calcium mobilization. Middle and right panels: ELISA results of IL-1β levels in supernatants of control THP-1 cells exposed to MSU or CPP crystals (200 μg/ml, 4 h) with/without PLC inhibitor (U73122, 5 μM) or its inactive analog (U73343, 5 μM). n = 3 independent experiments. Values are mean ± SEM. Two Way ANOVA with Tukey’s multiple comparison post hoc test. Panel g Created with BioRender.com released under a Creative Commons Attribution-NonCommercial-NoDerivs 4.0 International license https://creativecommons.org/licenses/by-nc-nd/4.0/deed.en.
Fig. 8
Fig. 8. Signaling pathways involved in micro-crystallin joint inflammation.
Scheme illustrating that microcrystal-induced production of proinflammatory cytokine IL-1β relies on cell volume regulation. During microcrystal-induced inflammation, both the decrease of synovial fluid osmolarity and the presence of microcrystals induce resident macrophage swelling, which activates the volume regulatory anion channels LRRC8 leading to ATP outflow. ATP in an autocrine and/or paracrine way activates purinergic P2Y2 and P2Y6 receptors that, through a PLC and intracellular calcium-dependent pathways contribute to NLRP3 activation and subsequent pro-IL-1β maturation and release. Created with BioRender.com released under a Creative Commons Attribution-NonCommercial-NoDerivs 4.0 International license https://creativecommons.org/licenses/by-nc-nd/4.0/deed.en.

References

    1. Dalbeth, N., Gosling, A. L., Gaffo, A. & Abhishek, A. Gout. Lancet397, 1843–1855 (2021). - PubMed
    1. Doherty, M. et al. Efficacy and cost-effectiveness of nurse-led care involving education and engagement of patients and a treat-to-target urate-lowering strategy versus usual care for gout: a randomised controlled trial. Lancet392, 1403–1412 (2018). - PMC - PubMed
    1. Latourte, A. et al. Tocilizumab in symptomatic calcium pyrophosphate deposition disease: a pilot study. Ann. Rheum. Dis.79, 1126–1128 (2020). - PubMed
    1. Martin, W. J., Walton, M. & Harper, J. Resident macrophages initiating and driving inflammation in a monosodium urate monohydrate crystal–induced murine peritoneal model of acute gout. Arthritis Rheumatism60, 281–289 (2009). - PubMed
    1. Martinon, F., Pétrilli, V., Mayor, A., Tardivel, A. & Tschopp, J. Gout-associated uric acid crystals activate the NALP3 inflammasome. Nature440, 237–241 (2006). - PubMed

Publication types

LinkOut - more resources