. 2024 Sep 18;14(1):21793.
doi: 10.1038/s41598-024-67769-1.

Targeted proteomics of cerebrospinal fluid in treatment naïve multiple sclerosis patients identifies immune biomarkers of clinical phenotypes

Affiliations

Targeted proteomics of cerebrospinal fluid in treatment naïve multiple sclerosis patients identifies immune biomarkers of clinical phenotypes

Alexandra Rabin et al. Sci Rep. .

Abstract

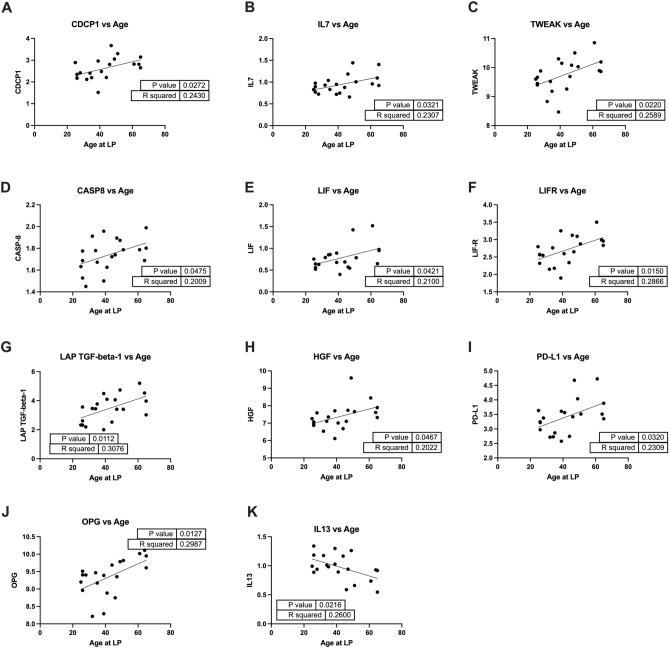
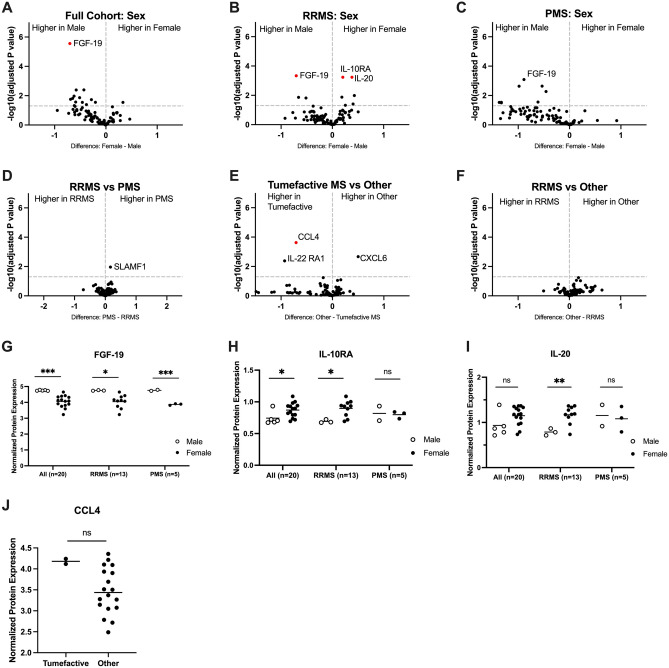
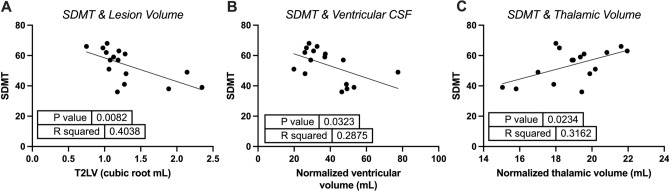
Multiple sclerosis (MS) is an inflammatory demyelinating disease with heterogeneous clinical presentations and variable long-term disability accumulation. There are currently no standard criteria to accurately predict disease outcomes. In this study we investigated the cross-sectional relationship between disease phenotype and immune-modulating cytokines and chemokines in cerebrospinal fluid (CSF). We analyzed CSF from 20 DMT-naïve MS patients using Olink Proteomics' Target 96 Inflammation panel and correlated the resulting analytes with respect to (1) disease subtype, (2) patient age and sex, (3) extent of clinical disability, and (4) MRI segmental brain volumes. We found that intrathecal IL-4 correlated with higher Expanded Disability Status Scale (EDSS) scores and longer 25-foot walk times, and CD8A correlated with decreased thalamic volumes and longer 9-hole peg test times. Male sex was associated with higher FGF-19 expression, and Tumefactive MS with elevated CCL4. Several inflammatory markers were correlated with older age at the time of LP. Finally, higher intrathecal IL-33 correlated with increased MS lesion burden and multi-compartment brain atrophy. This study confirms immune heterogeneity underlying CSF profiles in MS, but also identifies several inflammatory protein biomarkers that may be of use for predicting clinical outcomes in future algorithms.

Keywords: Age; Cerebrospinal fluid (CSF); Expanded Disability Status Scale (EDSS); Multiple sclerosis (MS); Targeted proteomics.


Conflict of interest statement

JMR is an inventor on patent application #15/851,651, “Anti111-human CXCR3 antibodies for the Treatment of Vitiligo” which covers targeting CXCR3 for the treatment of vitiligo; and on patent #62489191, “Diagnosis and Treatment of Vitiligo” which covers targeting IL-15 and Trm for the treatment of vitiligo. The remaining authors declare that the research was conducted in the absence of any competing interests that could be construed as a potential conflict of interest.

Figures

Figure 1
Figure 1
CSF protein correlates of clinical status in MS patients. (A) Study overview. This image was created with BioRender.com (B) Pearson correlation matrix of clinical disability scores and normalized protein expression values from Olink Target 96 Inflammation panel. (C) IL4 correlates with EDSS (note: EDSS within 8 months of lumbar puncture available for n = 14 patients). (D) IL4 correlates with 25-foot walk. (E) CD8A correlates with 9-hole peg test. (F) CD244, (G) OPG, (H) SCF, (I) Flt3L and (J) 4E-BP1 correlate with poorer SDMT performance (n = 20 DMT-naïve MS patients).
Figure 2
Figure 2
Intrathecal cytokines associated with age of MS patients at time of Lumbar Puncture. (A) CDCP1, (B) IL7, (C) TWEAK, (D) CASP8, (E) LIF, (F) LIFR, (G) LAP TGF-beta-1, (H) HGF, (I) PD-L1, and (J) OPG increased in greater age. (K) IL-13 was lower in older patients. (n = 20 MS patients).
Figure 3
Figure 3
Intrathecal cytokines differ by clinical subtype and male/female sex. (A–C) Volcano plots comparing male versus female sex across disease subtypes for (A) all patients, (B) only amongst patients with RRMS, and (C) only patients with PMS. Adjusted p values are as follows: (A) Full cohort: FGF-19 p = 0.0003 (B) RRMS: FGF-19 p = 0.02; IL-10RA p = 0.02; IL-20 p = 0.02 (C) PMS: FGF-19 p = 0.07. (DF) Volcano plots comparing cytokines across disease subtype. Adjusted p values are as follows: (D) RRMS vs PMS: SLAMF1 p = 0.97 (E) Tumefactive MS vs Other: CCL4 p = 0.02. (F) RRMS vs Other was ns. Panels A–F were calculated using Olink’s volcano plot software. A red data point reflects significance (p < 0.05) after adjusting for multiple testing via Benjamini-Hochberg method. Dotted line indicates significance (p < 0.05) prior to adjusting for multiple testing. (G–J) Analysis of protein biomarkers identified in volcano plots by sex and disease subtypes. (G) FGF-19, (H) IL-10RA and (I) IL-20 expression in males versus females grouped as all patients, RRMS or PMS as indicated. (J) CCL4 expression in tumefactive versus other subtypes. Panels G–J were calculated using unpaired 2-tailed t tests as indicated (*p < 0.05, **p < 0.01, ***p < 0.001). Full cohort: n = 20; RRMS: n = 13; PMS: n = 5; Tumefactive: n = 2. Please refer to Supplemental Tables 1 and 2 for a comprehensive list of analytes and p values.
Figure 4
Figure 4
MRI features correlate with Inflammatory biomarkers. (A–F) Intrathecal IL-33 versus segmental brain volume measurements as follows: (A) cortical gray matter, (B) total gray matter, (C) ventricular CSF volume, (D) thalamic volume, (E) caudate volume, and (F) lesion volume (T2LV). (G) Intrathecal CD8A versus thalamic (blue) and caudate (purple) volumes. X-axis values are normalized protein concentrations (NPX values) per Olink analysis. (n = 17 MS patients for whom MRI data was available).
Figure 5
Figure 5
MRI features correlate with Clinical Metrics of Disability. (A–C) SDMT versus segmental brain volume measurements as follows: (A) T2 FLAIR lesion volume, (B) ventricular volume, and (C) thalamic volume. (n = 17 MS patients for whom MRI data was available).

References

    1. Dobson, R. & Giovannoni, G. Multiple sclerosis—A review. Eur. J. Neurol.26, 27–40. 10.1111/ene.13819 (2019). - PubMed
    1. Cotsapas, C. & Mitrovic, M. Erratum: Genome-wide association studies of multiple sclerosis. Clin. Transl. Immunol.7, e1038. 10.1002/cti2.1038 (2018). - PMC - PubMed
    1. Lublin, F. D. et al. Defining the clinical course of multiple sclerosis: The 2013 revisions. Neurology83, 278–286. 10.1212/WNL.0000000000000560 (2014). - PMC - PubMed
    1. Solomon, A. J. et al. The contemporary spectrum of multiple sclerosis misdiagnosis: A multicenter study. Neurology87, 1393–1399. 10.1212/WNL.0000000000003152 (2016). - PMC - PubMed
    1. Solomon, A. J., Naismith, R. T. & Cross, A. H. Misdiagnosis of multiple sclerosis: Impact of the 2017 McDonald criteria on clinical practice. Neurology92, 26–33. 10.1212/WNL.0000000000006583 (2019). - PMC - PubMed