. 2024 Sep 18;14(1):21837.
doi: 10.1038/s41598-024-70822-8.

Location and function of TDP-43 in platelets, alterations in neurodegenerative diseases and arising considerations for current plasma biobank protocols

Affiliations

Location and function of TDP-43 in platelets, alterations in neurodegenerative diseases and arising considerations for current plasma biobank protocols

Ruth Luthi-Carter et al. Sci Rep. .

Erratum in

Abstract

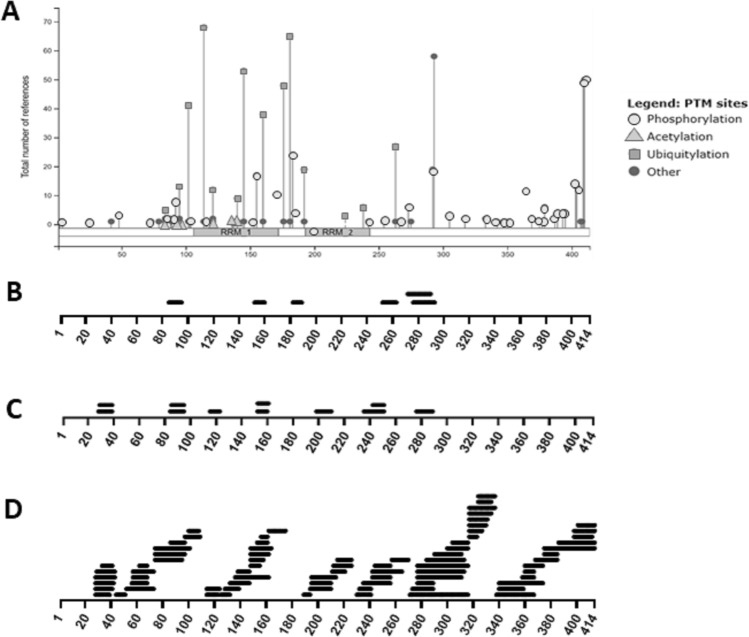
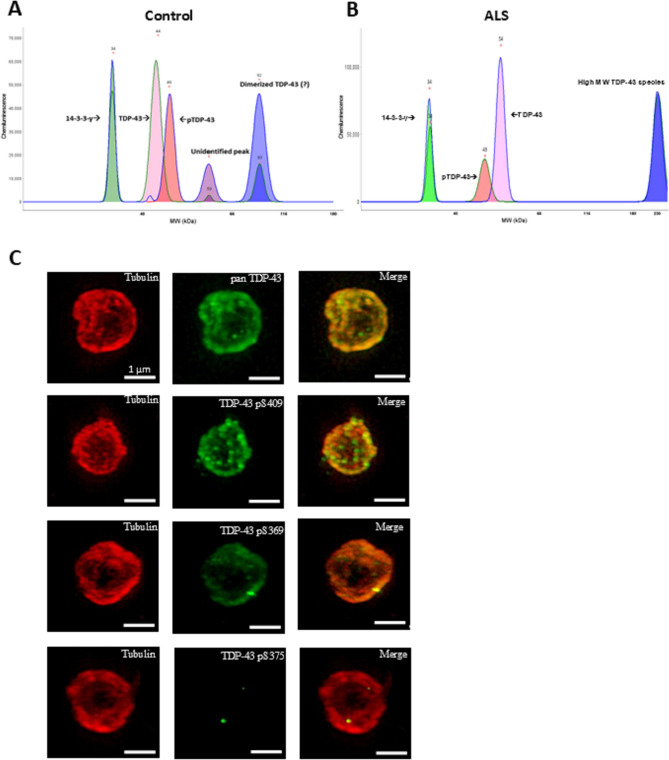
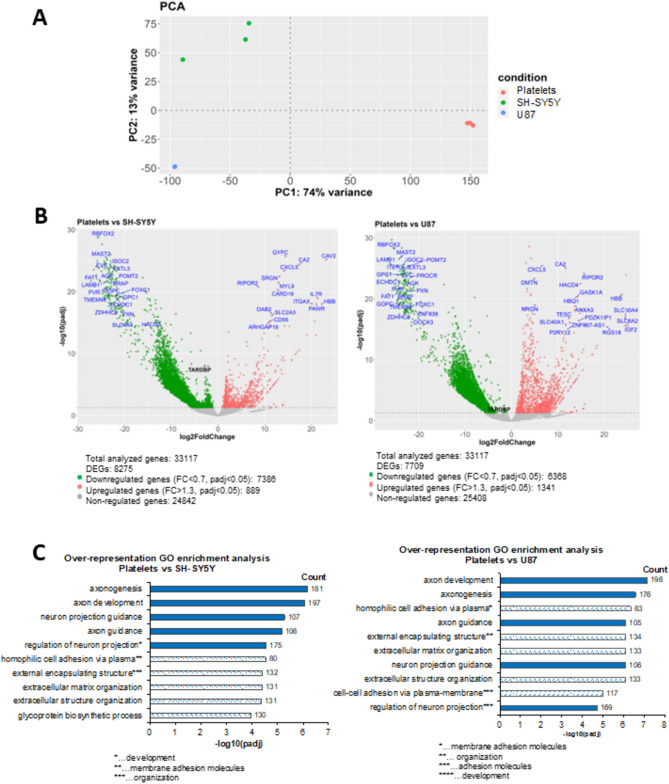
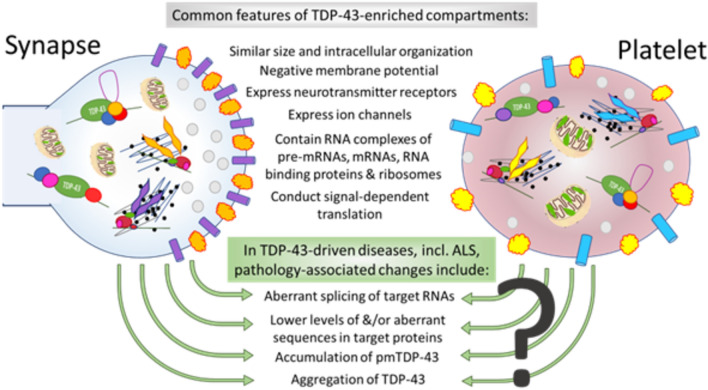
The TAR DNA Binding Protein 43 (TDP-43) has been implicated in the pathogenesis of human neurodegenerative diseases and exhibits hallmark neuropathology in amyotrophic lateral sclerosis (ALS). Here, we explore its tractability as a plasma biomarker of disease and describe its localization and possible functions in the cytosol of platelets. Novel TDP-43 immunoassays were developed on three different technical platforms and qualified for specificity, signal-to-noise ratio, detection range, variation, spike recovery and dilution linearity in human plasma samples. Surprisingly, implementation of these assays demonstrated that biobank-archived plasma samples yielded considerable heterogeneity in TDP-43 levels. Importantly, subsequent investigation attributed these differences to variable platelet recovery. Fractionations of fresh blood revealed that ≥ 95% of the TDP-43 in platelet-containing plasma was compartmentalized within the platelet cytosol. We reasoned that this highly concentrated source of TDP-43 comprised an interesting substrate for biochemical analyses. Additional characterization of platelets revealed the presence of the disease-associated phosphoserine 409/410 TDP-43 proteoform and many neuron- and astrocyte-expressed TDP-43 mRNA targets. Considering these striking similarities, we propose that TDP-43 may serve analogous functional roles in platelets and synapses, and that the study of platelet TDP-43 might provide a window into disease-related TDP-43 dyshomeostasis in the central nervous system.


Conflict of interest statement

RLC, MLRB, LF, GB, OA, TS, TA, MKV and AP are employees of AC Immune and are entitled to stock options. NT and EG are former employees of AC Immune. RB and JA have stock options in nVector, Inc., a company developing biomarker assays for neurologic diseases. EB is a member of the Scientific Advisory Board of VectorY. SEA has served on scientific advisory panels or consulted with Allyx Therapeutics, BioVie, Daewoong Pharmaceutical, EIP Pharma, Quince Therapeutics, Jocasta, NeuroSense, Risen Pharmaceutical, Sage Therapeutics, and Vandria. All other authors declare that they have no competing interests.

Figures

Fig. 1
Fig. 1
Assessment of the performance of novel TDP-43 assays in plasma. (A) A schematic diagram of TDP-43 showing epitopes targeted in the C-terminal (BD, and Fig. 2C), N-terminal (E and Fig. 2C) and p409/p410 (Fig. 2C) immunoassays; see further details in “Methods” section and Suppl. Fig. 6. (B,E) The calibration curves of the novel SIMOA and MSD assays. (C,D) Assay dilution linearity and parallelism for the C-terminal SIMOA assay. For SIMOA, each data point is the mean ± SD of two technical replicates in a single experiment. For MSD, each data point represents the mean ± SD of technical triplicates in a single experiment. In both cases, the error bars are either shown or fall within the limits of the data symbols.
Fig. 2
Fig. 2
Fractionation of fresh blood samples demonstrates that TDP-43 is compartmentalized in the platelet cytosol. (A) Diagram at left illustrates a typical biobank protocol for plasma collection, followed by the removal of serial samples from the top surface of the plasma. Diagram at right depicts serial collection of 50 µl samples from the top surface of a fresh plasma was followed by TDP-43 quantitation of the fourfold diluted samples using an N-terminally directed TDP-43 MSD assay (as in Fig. 1E). The graph shows the relative amounts of TDP-43 in each fraction, demonstrating that TDP-43 is unevenly distributed, with increasing concentrations in deeper fractions. (B) Schematic diagram of blood processing by differential centrifugation to achieve separation of platelets and PC. (For additional details, see “Methods” section and Suppl. Fig. 1). (C) Results from C-terminally targeted SIMOA assay (as in Fig. 1B-D). Each point represents the mean of technical duplicate samples; bar plot represents group mean ± SD. (D) Results of N-terminally directed TDP-43 MSD assay (as in Fig. 1E). (E) Results from p(409/410) TDP-43 CEI assay (see also Fig. 4). PRP and PC fractions demonstrate significantly higher TDP-43 levels than PPP and PM fractions as indicated (*); data in (C,D) were analyzed by one-way ANOVA followed by the Tukey multiple comparison test; data in E were analyzed by a two-way Student t-test. Data in (CE) are presented as mean ± SD. Points represent measures from individual healthy control blood donors; n = 5 (C), n = 8 (D), n = 6 (E).
Fig. 3
Fig. 3
LC–MS/MS analysis of TDP-43 proteoforms in ALS plasma. (A) Schematic diagram of TDP-43 illustrating known sites of post-translational modification according to previous literature (see text). (B) Illustration of peptide mapping results from an LC–MS/MS study of a TDP-43-positive fraction of human plasma obtained by immunoprecipitation. The immunoprecipitated material was separated by SDS-PAGE and a Coomassie-stained gel band of 43–48 kDa was digested with Trypsin prior to LC–MS/MS analysis. (C) Illustration of mapped peptides from a second IP LC–MS/MS experiment from human ALS plasma in which the Coomassie-stained band was digested with trypsin and chymotrypsin before undergoing LC–MS/MS. (D) Results from a parallel LC–MS/MS experiment in which the starting material comprised Coomassie-stained SDS-PAGE bands from SH-SY5Y cell lysates digested with trypsin and chymotrypsin, which resulted in 97% peptide coverage. All peptides mapped to the Uniprot Q13148 reference sequence, with no post-translational modifications detected except from an oxidized methionine at position 85.
Fig. 4
Fig. 4
Further characterization of platelet TDP-43 species. (A,B) Differences in relative abundance and electrophoretic migration of various TDP-43 proteoforms in ALS and control platelet cytosol observed in the CEI assay. The figure shows representative results from (A) control samples and (B) ALS samples. The electropherograms depict an overlapping view of the CEI signals from 14–3-3 γ (loading control, green-filled), TDP-43 (pink-filled), and pSer(409/410)TDP-43 (labeled as pTDP-43, orange-filled). Additional higher apparent molecular weight TDP-43-positive species are indicated by blue and purple shading. The two line traces (blue or green) indicate separate CEI runs to detect total TDP-43 or pTDP-43 (together with the 14–3-3 γ loading control). In (A), the control sample shows a TDP-43 peak at ~ 44 kDa (pink shading), a pTDP-43 peak at ~ 48–49 kDa (orange shading), and TDP-43 and pTDP-43 peaks at ~ 92 kDa (blue, potentially representing TDP-43 dimerization). An additional TDP-43-positive peak is observed at ~ 59 kDa. In (B), the ALS sample shows a signal equivalent to control for 14–3-3 γ (green) and a pTDP-43-positive band at ~ 48–49 kDa (orange). The first total TDP-43 peak, however, runs more slowly in ALS samples than in control samples, with an apparent MW of ~ 54 kDa (pink). In addition, unique TDP-43-positive and pTDP-43-positive species were detected at ~ 228–249 kDa in the ALS sample, whereas the species at ~ 44, ~ 59 and ~ 92 kDa observed in controls were not detected. These phenomena were repeatedly observed in ALS and control samples (n = 10,10). (C) Super-resolution microscopy images of TDP-43 in platelets. Immunofluorescence to visualize total TDP-43 (pan-TDP-43), TDP-43 pS409/410, pS369, and pS375 in platelets is shown in green. The intensities and distributions of TDP-43 immunoreactivity were compared to that of Tubulin (shown in red). Bar = 1 µm.
Fig. 5
Fig. 5
mRNA sequencing and differential expression analysis of platelets versus neural cell lines. (A) A principal component analysis was performed on normalized “rlog” gene counts obtained from three biological replicates of U87 (red), SH-SY5Y (green) and platelet (light blue) samples. The first (PC1) and second (PC2) dimension are plotted on the x-axis and y-axis, respectively. (B) Volcano plot representations of RNAseq data obtained from platelets versus SH-SY5Y (on the left) and platelets versus U87 (on the right). Each mRNA is represented by a single dot, with statistically differentially expressed mRNAs being color-coded with respect to platelet expression (lower expression indicated in green and higher expression indicated in red, respectively, with non-differentially expressed mRNAs represented in grey. The threshold for statistical significance is indicated by the horizontal dashed grey line (FDR adj. p = 0.05). The top 10 down- and upregulated mRNAs (by adj. p value) are indicated in blue text. TARDBP (encoding TDP-43) is indicated in black. (C) Over-representation of differentially expressed genes among Gene Ontology (GO) categories for Platelets versus SH-SY5Y (on the left) and Platelets versus U87 (on the right). Top 10 GO categories (BP: biological process) are presented as horizontal bars with the relative number of identified mRNAs labeled as its Count). Categories related to brain disorders are designated with filled blue bars; these show significant enrichment in both neuron-like and astrocyte-like cells.
Fig. 6
Fig. 6
Comparison of Platelet mRNA expression and mRNAs regulated by TDP-43 depletion in neural cell lines. (A) RNA-sequencing-based differential expression analysis was conducted for SH-SY5Y cells with and without TDP-43 depletion. The pie chart displays the number of non-differentially expressed genes (in grey) and significantly differentially expressed genes (DEGs, in blue). Expanded bars report the number of upregulated (in red) and downregulated (in green) RNAs (DEGs) in TDP-43-depleted samples. For DEGs, the number of genes detected as expressed in platelets (using the criterion of DESeq2 normalized counts (normCount_Platelets) greater than 0) are also reported. For each analysis, the percentage (%) is calculated relative to the total number of genes interrogated (33,117). The level of expression (normalized counts) of genes detected in platelets and differentially expressed in TDP-43-depleted SH-SY5Y versus SH-SY5Y cells is reported in the bar chart at the right. (B) RNA-sequencing-based differential expression analysis was conducted for U87 cells with and without TDP-43 depletion. The pie chart displays the number of non-differentially expressed genes (in grey) and DEGs (in blue). Expanded bars report the number of upregulated (in red) and downregulated (in green) DEGs in TDP-43-depleted samples. For DEGs, the number of genes detected as expressed in platelets (using the criterion of DESeq2 normalized counts (normCount_Platelets) greater than 0) are also reported. For each analysis, the percentage (%) is calculated relative to the total number of genes interrogated (33,117). The level of expression (normalized counts) of genes detected in platelets and differentially expressed in TDP-43-depleted U87 versus U87 cells is reported in the bar chart at the right. (C) Cross-comparison of TDP-43-responsive RNAs in neural cells with RNA expression levels in platelets. The pie chart displays the number of DEGs in common to TDP-43-depleted SH-SY5Y and U87 cells (orange) compared to all genes analyzed (red). Expanded bars to the right of the pie chart report the number of platelet-expressed genes (normCount_Platelets > 0, in acid green) and non-platelet-expressed genes (normCount_Platelets = 0, in light green). The bar chart at the right reports representative TDP-43-responsive genes detected at levels of normCount_Platelets > 10. TARDBP (encoding TDP-43) is highlighted as a red bar. Statistical analyses of top up- and down-regulated genes are shown in Suppl. Fig. 6.
Fig. 7
Fig. 7
Potentially similar roles of TDP-43 in synapses and platelets. Upper text highlights features shared by platelets and synapses. Drawings depict the roles that TDP-43 may fulfil in both synapses and platelets, including regulating pre-mRNA splicing, RNA transport, RNA translation, and mitochondrial homeostasis. Line and lariat structures depict RNA; black points represent translation-capable ribosomes attached to the rough endoplasmic reticulum; beige ovoids depict mitochondria; grey circles represent secretory vesicles; features at the perimeter represent receptors and ion channels at the plasma membrane. Green arrows point to descriptions of how TDP-43 dysfunction might hypothetically manifest in both synapses and platelets, based on its known pathological effects in neurons. The question mark indicates the speculative nature of these features with respect to platelets.

References

    1. Elman, L. B., McCluskey, L. & Grossman, M. Motor neuron disease and frontotemporal lobar degeneration: A tale of two disorders linked to TDP-43. Neurosignals16, 85–90. 10.1159/000109762 (2008). - PubMed
    1. Tamaki, Y. & Urushitani, M. Molecular dissection of TDP-43 as a leading cause of ALS/FTLD. Int. J. Mol. Sci.23, 12508. 10.3390/ijms232012508 (2022). - PMC - PubMed
    1. Buratti, E. TDP-43 post-translational modifications in health and disease. Expert Opin. Ther. Targets22, 279–293. 10.1080/14728222.2018.1439923 (2018). - PubMed
    1. Nelson, P. T., Schneider, J. A., Jicha, G. A., Duong, M. T. & Wolk, D. A. When Alzheimer’s is LATE: Why does it matter?. Ann. Neurol.94, 211–222. 10.1002/ana.26711 (2023). - PMC - PubMed
    1. Nilaver, B. I. & Urbanski, H. F. Mechanisms underlying TDP-43 pathology and neurodegeneration: An updated mini-review. Front. Aging Neurosci.15, 1142617. 10.3389/fnagi.2023.1142617 (2023). - PMC - PubMed

MeSH terms