. 2024 Sep 19;8(1):208.
doi: 10.1038/s41698-024-00705-8.

Frequent CHD1 deletions in prostate cancers of African American men is associated with rapid disease progression

Affiliations

Frequent CHD1 deletions in prostate cancers of African American men is associated with rapid disease progression

Miklos Diossy et al. NPJ Precis Oncol. .

Abstract

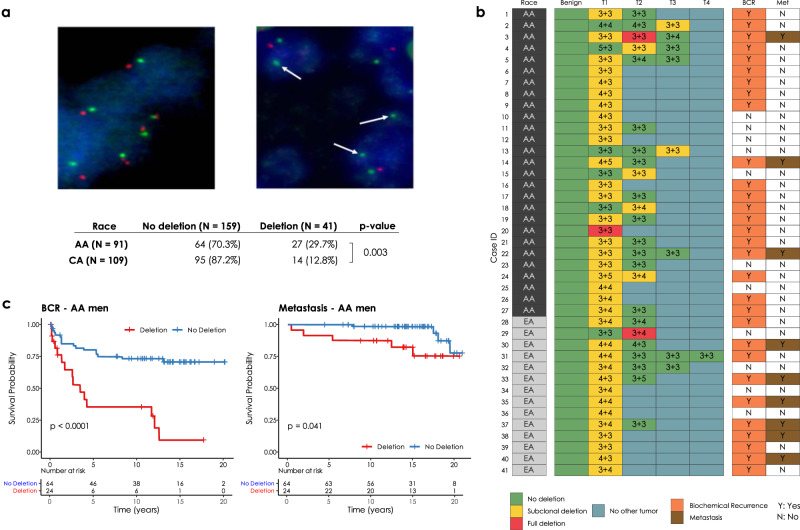
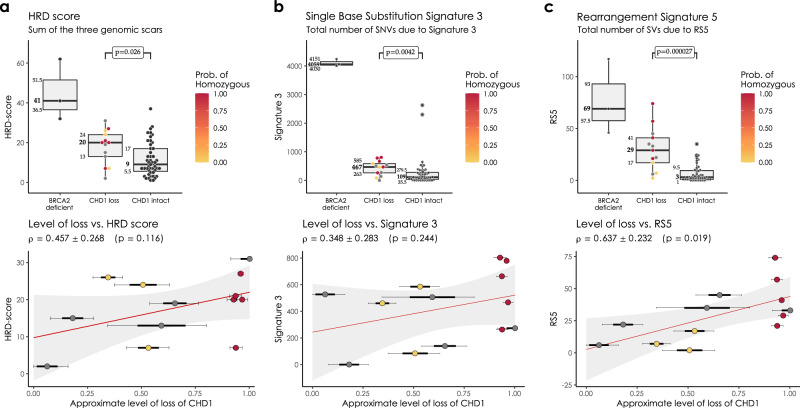
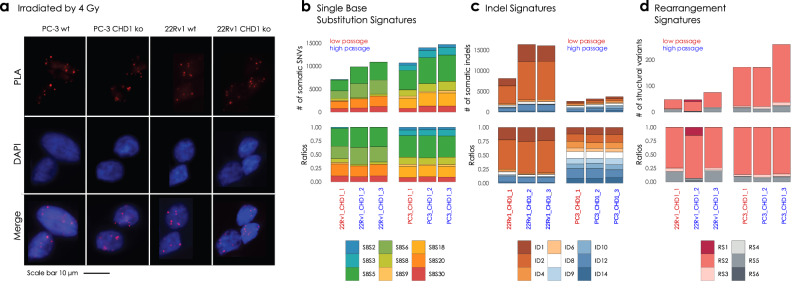
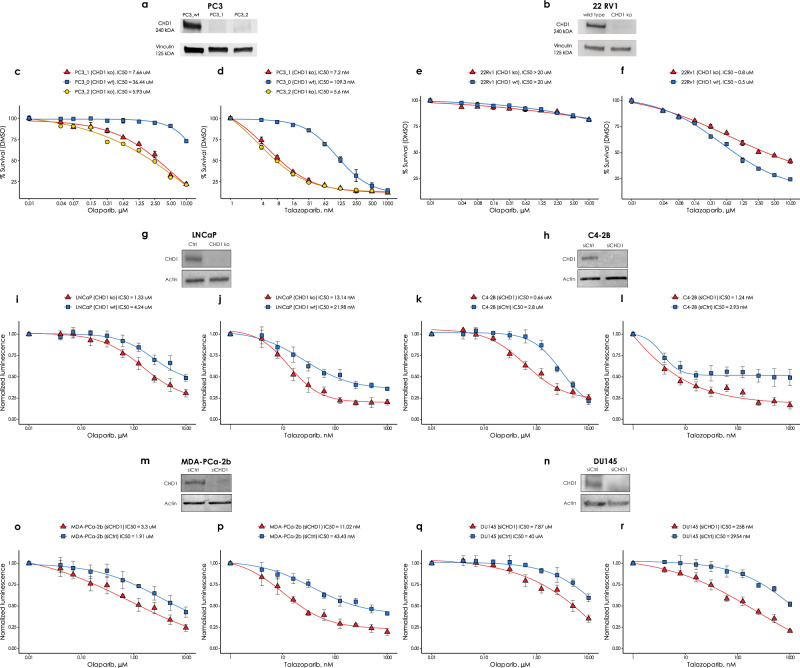
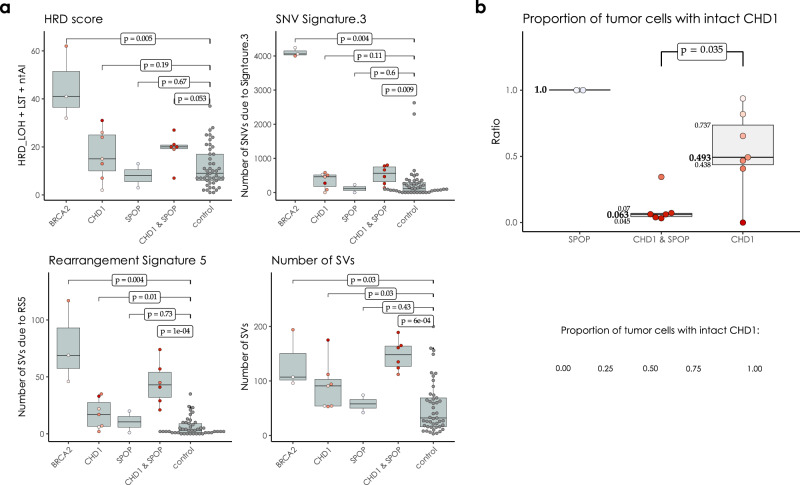
We analyzed genomic data from the prostate cancer of African- and European American men to identify differences contributing to racial disparity of outcome. We also performed FISH-based studies of Chromodomain helicase DNA-binding protein 1 (CHD1) loss on prostate cancer tissue microarrays. We created CHD1-deficient prostate cancer cell lines for genomic, drug sensitivity and functional homologous recombination (HR) activity analysis. Subclonal deletion of CHD1 was nearly three times as frequent in prostate tumors of African American than in European American men and it associates with rapid disease progression. CHD1 deletion was not associated with HR deficiency associated mutational signatures or HR deficiency as detected by RAD51 foci formation. This was consistent with the moderate increase of olaparib and talazoparib sensitivity with several CHD1 deficient cell lines showing talazoparib sensitivity in the clinically relevant concentration range. CHD1 loss may contribute to worse disease outcome in African American men.


Conflict of interest statement

Z. Szallasi is listed as a co-inventor on a patent to quantify homologous recombination deficiency, which is owned by Children’s Hospital Boston and licensed to Myriad Genetics. No potential conflicts of interest were disclosed by the other authors.

Figures

Fig. 1
Fig. 1. CHD1 copy number by FISH in tissue microarrays.
a Prostate cancer cells with wild type (diploid) CHD1 (upper left) vs. prostate cancer cells harboring mono-allelic deletion for CHD1 (upper right) are visualized by FISH assay. Orange signal: CHD1 probe; green signal: human chromosome 5 short arm probe; blue color: DAPI nuclear stain. Arrows are representing the lack of CHD1. Representative view fields capture 3-3 cell nuclei at ×60 magnification. Inset table summarizes the higher frequency of CHD1 deletion in prostatic carcinoma of AA vs. EA patients (The p value is from a one-sided Fisher exact test). b CHD1 deletion is a subclonal event in prostate cancer. Multiple tumor samples from 200 patients were assessed by FISH assay that identified 41 patients with CHD1 deletion (left panel). The heatmap depicts the sampled largest tumor 1 (T1), second largest tumor (T2), and so on. Numbers denote pathological Gleason grade for each tumor. BCR biochemical recurrence (orange), Met metastasis (brown). c Deletion of CHD1 (clonal or subclonal in any of the nodes) is strongly associated with disease progression in AA prostate cancer patients (N = 91). BCR univariable Kaplan–Meier curve, Metastasis univariable Kaplan–Meier curve.
Fig. 2
Fig. 2. HRD markers in the PRAD WGS cohorts.
a HRD-score, the sum of the three genomic scars, HRD-LOH, LST, and ntAI, b number of somatic mutations due to single-base substitution signature 3, c number of structural variants due to rearrangement signature 5. The significance of the difference between the means of the “CHD1 loss” and “control” groups were assessed with Wilcoxon ranked sum tests. Below the box plots are the correlations between the approximate levels of loss in CHD1 and the HRD measures are visualized. The standard errors and the corresponding p values of the correlation coefficients (Pearson) are also indicated. Horizontal lines indicate the uncertainty in the level of loss in each sample. Thick black lines correspond to the 66%, thin black error-bars to the 95% percentile intervals.
Fig. 3
Fig. 3. PC-3 and 22Rv1 CHD1 ko cell line experiment and somatic signature extraction.
a RAD51 foci formation. Examples of the most common staining patterns in WT and CHD1 ko 22Rv1 and PC-3 cell lines. Cells were fixed by 4% PFA 3 h after irradiation (IR = 4 Gy) PLA was carried out using antibodies against γH2Ax and RAD51 proteins. b Single Nucleotide Substitution (SBS) signatures, c Indel signatures, d Rearrangement signatures. The number of mutations indicated originate from the reconstructed mutational spectra.
Fig. 4
Fig. 4. The effect of CHD1 loss on olaparib and talazoparib sensitivity in six prostate cancer cell lines.
CHD1 was either knocked out CRISPR-Cas9-mediated editing in the PC-3, 22Rv1 and LNCaP cell lines or suppressed by shRNA in the C4-2b, Du145 and MDA-PCa-2b cell lines. Western immunoblots show the successful elimination CHD1 in a PC-3, b 22Rv1, g LNCaP, h C4-2b, m MDA-PCa-2b and n Du145 cell lines. Sensitivity assays of parental wt and CHD1 eliminated clones to PARP inhibitor Olaparib and talazoparib in PC-3 cells (c, d), in 22Rv1 cells (e, f), in LNCaP cells (i, j), in C4-2b cells (k, l), in MDA-PCa-2b cells (o, p), and in Du145 cells (q, r). Cells viability was measured the PrestoBlueTM reagent. SD of triplicates are shown.
Fig. 5
Fig. 5. CHD1 loss and SPOP mutation in the WGS cohorts.
a HRD-related markers and total number of structural variants in samples with mutations in SPOP, BRCA2 and loss in CHD1 versus the controls. Samples that simultaneously harbor mutations in SPOP and a loss in CHD1 tend to have higher markers. p values were estimated using non-parametric Wilcoxon signed-rank tests. b Proportion of cells with intact CHD1 in SPOP mutants and samples identified with CHD1 loss. While the deletion in CHD1 in SPOP mutants is mostly clonal, in samples with wild type SPOP background it is mostly subclonal. The color-code for points in both (a, b) is illustrated in the bottom right corner of the figure.

Update of

References

    1. DeSantis, C. E., Miller, K. D., Goding Sauer, A., Jemal, A. & Siegel, R. L. Cancer statistics for African Americans, 2019. CA Cancer J. Clin.69, 211–233 (2019). - PubMed
    1. Gaines, A. R. et al. The association between race and prostate cancer risk on initial biopsy in an equal access, multiethnic cohort. Cancer Causes Control25, 1029–1035 (2014). - PMC - PubMed
    1. Chu, D. I. et al. Effect of race and socioeconomic status on surgical margins and biochemical outcomes in an equal-access health care setting: results from the Shared Equal Access Regional Cancer Hospital (SEARCH) database. Cancer118, 4999–5007 (2012). - PMC - PubMed
    1. Khani, F. et al. Evidence for molecular differences in prostate cancer between African American and Caucasian men. Clin. Cancer Res.20, 4925–4934 (2014). - PMC - PubMed
    1. Rosen, P. et al. Differences in frequency of ERG oncoprotein expression between index tumors of Caucasian and African American patients with prostate cancer. Urology80, 749–753 (2012). - PMC - PubMed

LinkOut - more resources