. 2024 Sep 18;7(1):1168.
doi: 10.1038/s42003-024-06684-7.

Transcriptional profiling in microglia across physiological and pathological states identifies a transcriptional module associated with neurodegeneration

Affiliations

Transcriptional profiling in microglia across physiological and pathological states identifies a transcriptional module associated with neurodegeneration

Aysegul Guvenek et al. Commun Biol. .

Abstract

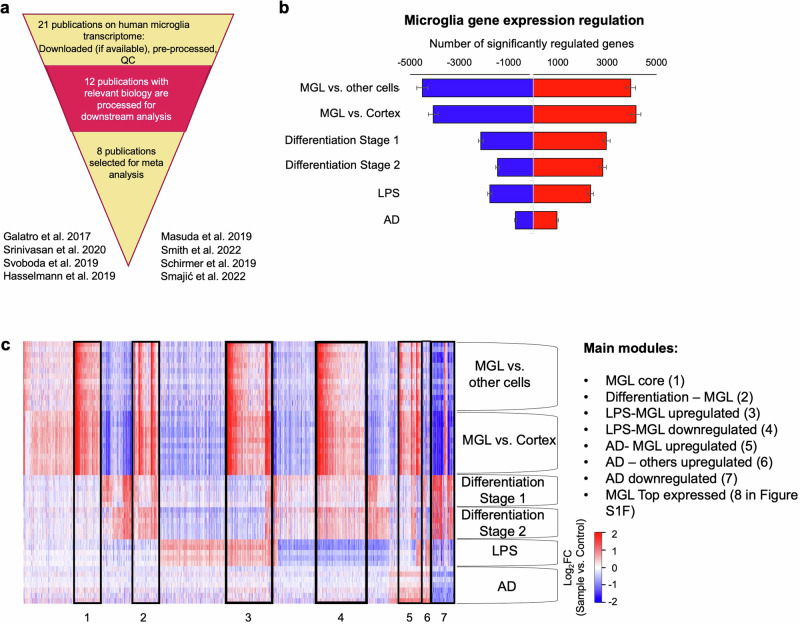
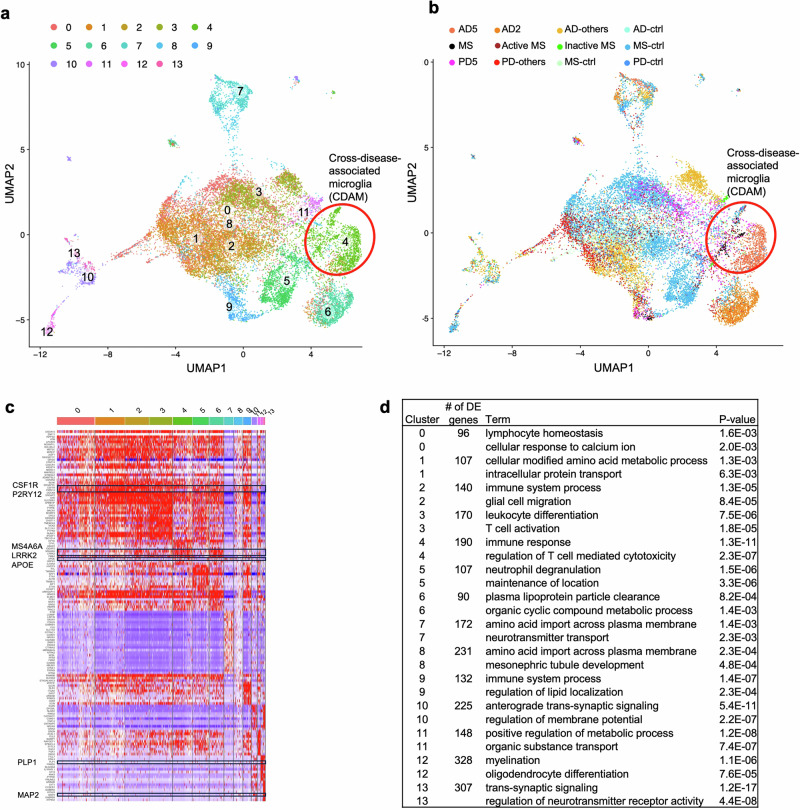
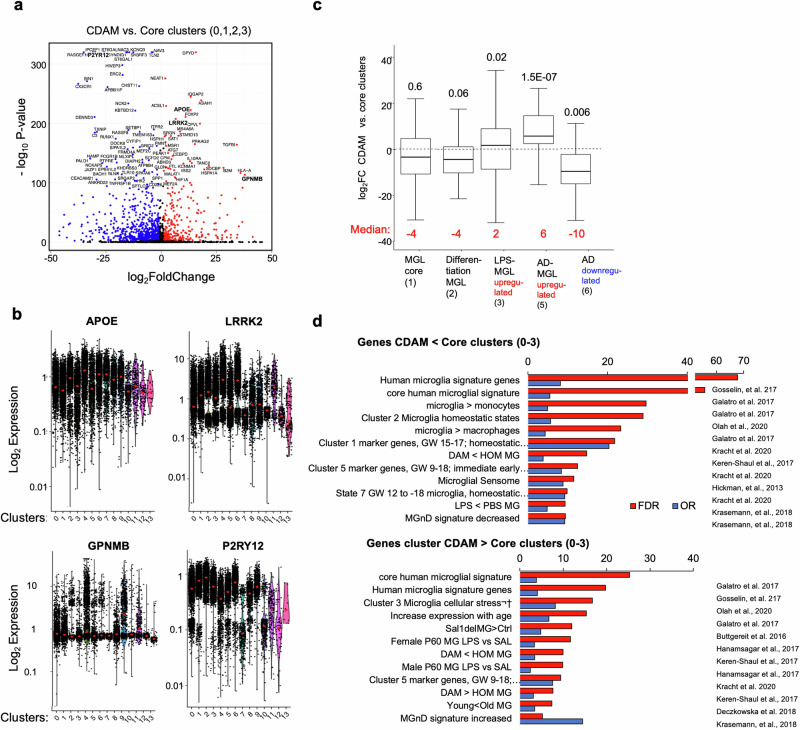
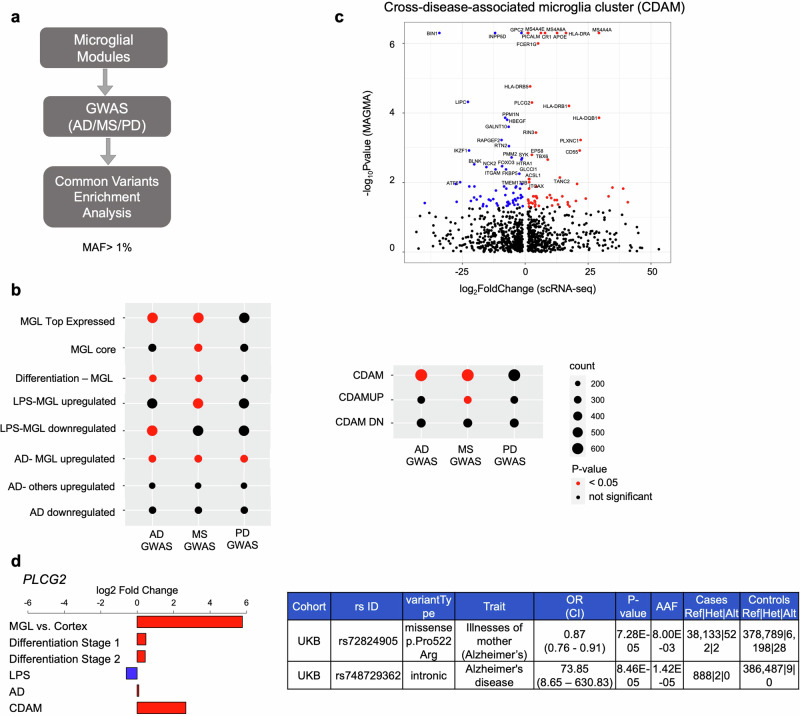
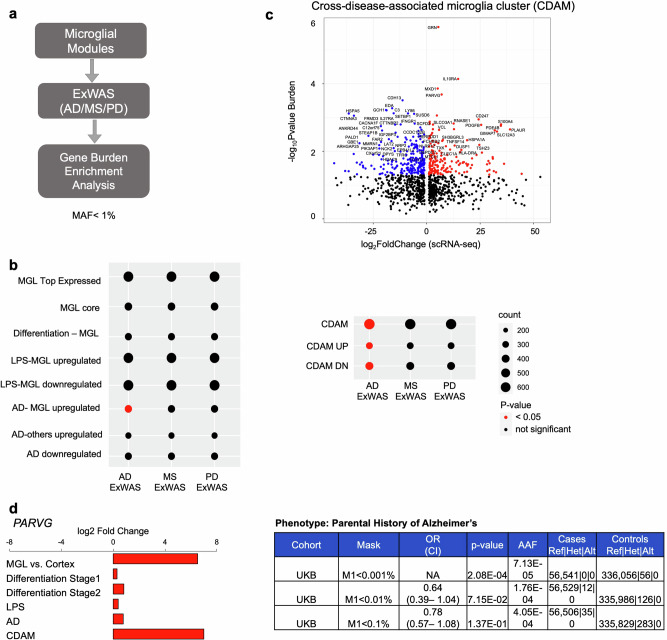
Microglia are the resident immune cells of the central nervous system and are involved in brain development, homeostasis, and disease. New imaging and genomics technologies are revealing microglial complexity across developmental and functional states, brain regions, and diseases. We curated a set of publicly available gene expression datasets from human microglia spanning disease and health to identify sets of genes reflecting physiological and pathological microglial states. We also integrated multiple human microglial single-cell RNA-seq datasets in Alzheimer's disease (AD), multiple sclerosis (MS), and Parkinson's disease, and identified a distinct microglial transcriptional signature shared across diseases. Analysis of germ-line DNA identified genes with variants associated with AD and MS that are overrepresented in microglial gene sets, including the disease-associated transcriptional signature. This work points to genes that are dysregulated in disease states and provides a resource for the analysis of diseases in which microglia are implicated by genetic evidence.


Conflict of interest statement

A.G., A.M., L.D., D.Z., N.P., S.H., E.S., A.S., and G.C. are current employees and/or stockholders of Regeneron Genetics Center or Regeneron Pharmaceuticals. All other authors declare no conflict of interest.

Figures

Fig. 1
Fig. 1. Microglial gene expression.
a Summary of datasets reviewed, processed, and used in this study. A total of 21 datasets were identified focusing on the human microglia transcriptome. After pre-processing and QC steps, 12 were selected and analyzed further. Subsequently, 8 of 12 were selected due to biological importance and relevancy. b Bar plot showing differentially upregulated (red) and downregulated (blue) genes in each dataset. Differential expression is determined by DESeq2 (false discovery rate (FDR) < 0.05 and fold change difference > 2). Error bars are standard errors of the mean. c Heatmap showing gene expression patterns of differentially expressed genes across datasets. Each row is a sample, each column is a gene. Black boxes mark sets of genes differentially expressed across multiple datasets.
Fig. 2
Fig. 2. Integrated sc RNA-seq analysis for microglia.
a Uniform manifold approximation and projection (UMAP) plot showing microglia clusters for integrated microglia analysis of 18,713 cells from four datasets. Non-microglial cells were excluded from this analysis. Each dot represents a single cell. Colors correspond to different clusters. b As in (a), but, colors correspond to different conditions. c Heatmap of top differentially expressed genes in each cluster compared to all other clusters. d Top gene ontology terms for differentially expressed genes in each cluster compared to all other clusters.
Fig. 3
Fig. 3. CDAM cluster.
a Differential expression analysis comparing genes from CDAM and healthy-microglia-associated clusters. The top significant genes are highlighted on the volcano plot. b Log-2 expression levels of representative genes up-regulated (APOE, LRRK2, and GPNMB) and down-regulated (P2RY12) in CDAM (cluster 4). c Boxplot showing gene expression in CDAM for microglia modules identified in bulk-RNA-seq analysis in Fig. 1. Red dots mark median values for each comparison. P-values between the groups were determined by the Wilcoxon test. UP stands for upregulation and DN stands for downregulation. Error bars on each box represent the highest and lowest values excluding outliers. d Overlap between CDAM and publicly annotated microglial gene sets. All gene sets are defined in the MGEnrichment database. Bar plot showing odds ratio (OR) and -log10 FDR for the most significant overlapping gene sets for CDAM upregulated and downregulated genes compared to core clusters.
Fig. 4
Fig. 4. Common-variant enrichment analysis for microglial modules.
a Schematic of common variant analysis. Microglial module enrichment for common variants (minor allele frequency (MAF) > 1%) was tested by MAGMA analysis using AD, MS, and PD GWAS summary statistics. b Summary of common variant enrichment analysis. Bubble plot showing enrichment P-values obtained from MAGMA analysis of each module for AD, MS, and PD GWAS studies. The size of the dot represents the number of genes in each module. P-values < 0.05 are shown in red. c Volcano plot showing genes in CDAM module that are significantly associated with the AD GWAS. d Bar plot showing PLCG2 gene expression changes in our datasets (left). Breakdown of PLCG2 variants associated with AD or related traits (right).
Fig. 5
Fig. 5. Rare-variant enrichment analysis for microglial modules.
a Schematic of rare variant analysis. Gene burden test was done for microglial genes for rare variants (MAF < 1%). Microglial module enrichment for rare variants was tested by Fisher’s Exact Test using AD, MS, and PD ExWAS summary statistics. b Summary of rare variant enrichment analysis. Bubble plot showing enrichment P-values obtained from MAGMA analysis of each module for AD, MS, and PD ExWAS studies. The size of the dot represents the number of genes in each module. P-values < 0.05 are shown in red. c Volcano plot showing genes in CDAM module that are significantly associated with AD ExWAS (rare variants). d Bar plot showing gene expression of PARVG in our datasets (left). Breakdown of gene burdens in PARVG associated with an AD-related trait (parental history of AD, right).

References

    1. Saijo, K. & Glass, C. K. Microglial cell origin and phenotypes in health and disease. Nat. Rev. Immunol.11, 775–787 (2011). - PubMed
    1. Utz, S. G. et al. Early fate defines microglia and non-parenchymal brain macrophage development. Cell181, 557–573.e518 (2020). - PubMed
    1. De Schepper, S., Crowley, G. & Hong, S. Understanding microglial diversity and implications for neuronal function in health and disease. Dev. Neurobiol.81, 507–523 (2021). - PMC - PubMed
    1. Frost, J. L. & Schafer, D. P. Microglia: architects of the developing nervous system. Trends Cell Biol.26, 587–597 (2016). - PMC - PubMed
    1. Paolicelli, R. C. et al. Synaptic pruning by microglia is necessary for normal brain development. Science333, 1456–1458 (2011). - PubMed

MeSH terms

LinkOut - more resources