. 2024 Sep 18;7(1):1108.
doi: 10.1038/s42003-024-06787-1.

Dual role of the S5 segment in type 1 ryanodine receptor channel gating

Affiliations

Dual role of the S5 segment in type 1 ryanodine receptor channel gating

Takashi Murayama et al. Commun Biol. .

Abstract

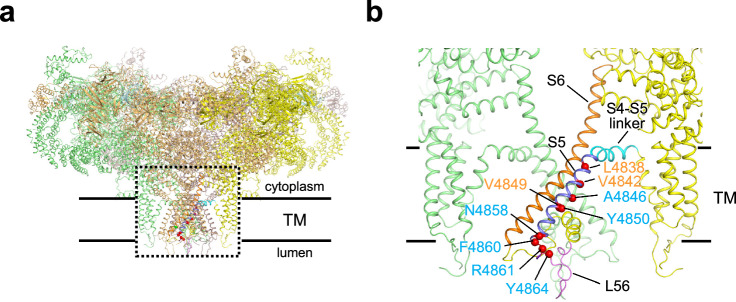
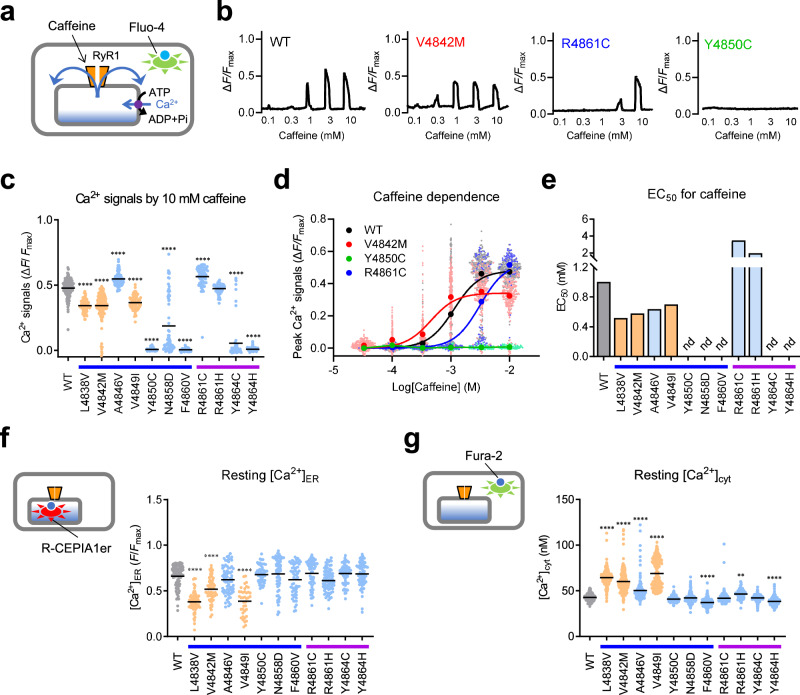
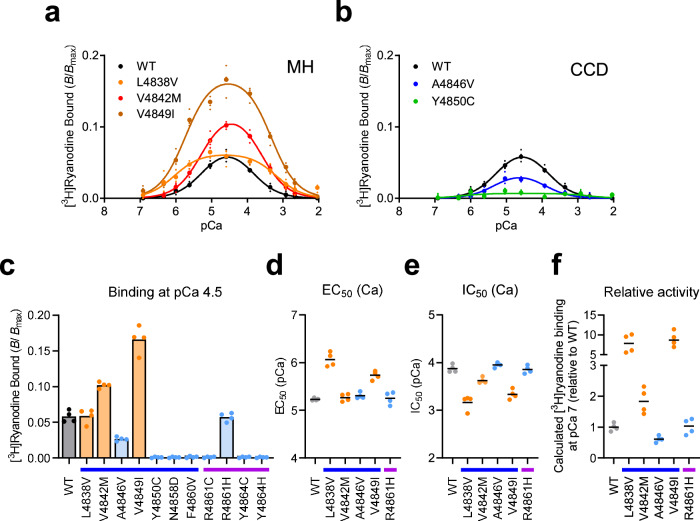
The type 1 ryanodine receptor (RyR1) is a Ca2+ release channel in the sarcoplasmic reticulum that is essential for skeletal muscle contraction. RyR1 forms a channel with six transmembrane segments, in which S5 is the fifth segment and is thought to contribute to pore formation. However, its role in channel gating remains unclear. Here, we performed a functional analysis of several disease-associated mutations in S5 and interpreted the results with respect to the published RyR1 structures to identify potential interactions associated with the mutant phenotypes. We demonstrate that S5 plays a dual role in channel gating: the cytoplasmic side interacts with S6 to reduce the channel activity, whereas the luminal side forms a rigid structural base necessary for S6 displacement in channel opening. These results deepen our understanding of the molecular mechanisms of RyR1 channel gating and provide insight into the divergent disease phenotypes caused by mutations in S5.


Conflict of interest statement

The authors declare no competing interests.

Figures

Fig. 1
Fig. 1. Location of disease-associated mutations on the RyR1 structure.
a Structure of RyR1 in the closed state (PDB accession code, 5TB0) viewed from the direction parallel to the lipid bilayer. b Magnified view of the dotted box in (a). Mutated residues for MH (orange) and CCD (light blue) are depicted in red spheres.
Fig. 2
Fig. 2. Intracellular Ca2+ measurements in cells expressing mutant RyR1 channels.
a Schematic drawing of caffeine-induced Ca2+ release. HEK293 cells expressing the WT and mutant RyR1 channels were loaded with fluo-4 AM, and the Ca2+ release via RyR1 was elicited by different concentrations (0.1–10 mM) of caffeine. b Representative traces of fluo-4 signals for WT and three mutants (V4842M, R4861C and Y4850C). The numbers under the trace indicate the concentrations of caffeine. c The peak Ca2+ signals by 10 mM caffeine for WT (grey), MH (orange: L4838V, V4842M and V4849I) and CCD (light blue: A4846V, Y4850C, N4858D, F4860V, R4861C, R4861H, Y4864C and Y4864H) mutant RyR1 cells. d Caffeine-dependent Ca2+ response in WT and three mutants cells (V4842M, Y4850C and R4861C). The averaged peak Ca2+ signals were plotted against the caffeine concentrations and fitted to the dose-response curve. e EC50s for caffeine in WT and mutant RyR1 cells. nd, not determined due to virtually no Ca2+ signals by caffeine. f Resting [Ca2+]ER measurement using R-CEPIA1er. MH mutants showed lower [Ca2+]ER than WT. g Resting [Ca2+]cyt measurement using fura-2. MH mutants showed higher [Ca2+]cyt than WT. For panels (c, f, g), data are shown as the means with individual points and were analyzed by one-way ANOVA with Dunnett’s multiple comparisons test. **p < 0.01, ****p < 0.0001 compared with WT. The number of cells (n), the number of independent dishes (N) and exact p-values in each experiment are summarized in Supplementary Table 2. For panel (d), data are shown as means and individual points (WT: n = 230, N = 4; V4842A: n = 210, N = 4; Y4850C: n = 70, N = 3; R4861C: n = 70, N = 3). For panel (e), EC50s were calculated using individual averaged values for each caffeine concentration from all pooled data as shown in d. Blue and purple lines below the horizontal axis in (c, eg) represent S5 and the S5-S6 luminal loop, respectively.
Fig. 3
Fig. 3. Ca2+-dependent [3H]ryanodine binding of mutant RyR1 channels.
a, b Microsomes from HEK293 cells expressing WT and mutant RyR1 (L4838V, V4842M and V4849I in a and A4846V and Y4850C in b) were incubated with 5 nM [3H]ryanodine for 5 h at 25 °C in the reaction medium at various concentrations of free Ca2+. c The [3H]ryanodine binding of microsomes from HEK293 cells expressing WT (black), MH (orange: L4838V, V4842M and V4849I) and CCD (light blue: A4846V, Y4850C, N4858D, F4860V, R4861C, R4861H, Y4864C and Y4864H) mutant RyR1 at pCa 4.5. Note that the MH mutants show greater [3H]ryanodine binding than WT, whereas CCD mutants exhibited no or reduced binding. d, e EC50 and IC50 values for Ca2+. f Calculated [3H]ryanodine binding at resting [Ca2+]cyt (pCa 7) of mutant RyR1s representing relative activity to WT. Data are shown as the means and individual points (n = 4, N = 2). “n” is the number of assays, and “N” is the number of independent experiments. Blue and purple lines below the horizontal axis in (cf) represent S5 and the S5-S6 luminal loop, respectively.
Fig. 4
Fig. 4. DICR activity of the mutant RyR1 channels.
a Schematic drawing of the reconstitution and measurement of DICR. HEK293 cells expressing WT and mutant RyR1s were infected with baculovirus carrying essential components (Cav1.1, β1a, Stac3 and JP2) to reconstitute DICR machinery. R-CEPIA1er and Kir2.1 were also transduced to measure [Ca2+]ER and hyperpolarize the membrane potential, respectively. DICR was triggered by depolarization of the membrane potential with a high [K+] solution. b Typical results of time-lapse R-CEPIA1er fluorescence measurement for WT (left), V4849I (center) and Y4850C (right) RyR1 cells. High [K+] solutions ranging from 5 to 61 mM (symbols shown in WT) were applied 30 s after starting (blue arrowheads). c, d [K+] dependence of R-CEPIA1er fluorescence corrected by [Ca2+]ER in WT and MH (V4842M and V4849I) (c) and CCD (Y4850C and R4861C) (d) mutant RyR1 cells. e EC50 values for [K+] of WT (black), MH (orange) and CCD (light blue) mutant RyR1s. nd, not determined due to virtually no reduction in [Ca2+]ER by [K+]. Data are shown as the means and individual points (n = 6, N = 2). “n” is the number of wells, and “N” is the number of independent experiments. Blue and purple lines below the horizontal axis represent S5 and the S5-S6 luminal loop, respectively.
Fig. 5
Fig. 5. Possible interactions between S5 and the adjacent TM helices based on cryo-EM structures of RyR1.
a Comparison of the closed (PDB accession code, 5TB0) and open (PDB accession code, 5T15) states in the TM region showing two molecules of the tetramer facing each other. The molecule on the left is shown in green for the closed state and brown for the open state. In the molecule on the right, the S4-S5 linker, S5, L56 and S6 in the closed state are shown in light blue, blue, magenta and orange, respectively. Arrows indicate movement during the conformational change from the closed to the open state. b Enlarged view from the S4-S5 linker to S6 in the TM region. The color scheme is the same as in (a). The kink of S6 occurs after F4917. Blue circles indicate residues with severe loss of function, light blue residues with mild loss of function, and red residues with gain of function. c Enlarged view of the region in the closed state enclosed by the square dotted line c in (b). Hydrogen bonds are indicated by red dotted lines. d Enlarged view of the region in the closed state enclosed by the square dotted line d in (b). Hydrogen bonds are indicated by red dotted lines. S1’*, L12*, S4* and S6* in gray are the main and side chains from neighboring molecules.
Fig. 6
Fig. 6. DICR activity of the RyR1 channels carrying mutations in the interacting partners.
a [Ca2+]ER of the reconstituted cells expressing WT (black) and mutant RyR1s at the interacting partners for MH (orange: V4892A, I4928A and I4933A) and CCD (light blue; Y4630A, F4808L, H4887Y and F4917L) mutations. b Typical results of a time-lapse R-CEPIA1er fluorescence measurement for WT (left), I4933A (center) and H4887Y (right) RyR1 cells. A high [K+] solution ranging from 5 to 61 mM (symbols shown in WT) was applied at 30 s after starting (blue arrowheads). c and d [K+] dependence of R-CEPIA1er fluorescence corrected by [Ca2+]ER in WT and mutant RyR1s (V4892I and I4933A in c and H4887Y and F4917L in d). e EC50 values for [K+]. nd, not determined due to virtually no reduction in [Ca2+]ER by [K+]. Data are shown as the means and individual points (n = 12, N = 2 for (a) and n = 6, N = 2 for (ce)). “n” is the number of wells, and “N” is the number of independent experiments.
Fig. 7
Fig. 7. Schematic diagram of the interactions between S5 and the other transmembrane segments.
a All interactions between the amino acid residues studied in this work are shown. The concave and convex rectangles represent amino acid side chains; red and blue represent the gain-of-function (GOF) and loss-of-function (LOF) mutations, respectively. Side chains belonging to neighboring chains (I4928, F4808 and Y4630) are shown in a lighter color. Residues for GOF and LOF mutations in S5 are numbered in red and blue, respectively. Black numbers indicate interacting partners of residues for disease-associated mutations. Each α-helix is shown as a cylinder and loops as lines. b, c Schematic diagram in the closed (b) and open (c) states. Four of the two chains facing each other were shown. Amino acid interactions are represented as straight lines. The meaning of the color of each line is the same as shown in (a). d Mechanism by which the mutation exhibits GOF; the interaction between the cytoplasmic side in S5 and S6 is altered, resulting in an increased frequency to the open state. e Mechanism by which the mutation exhibits LOF; the interaction between the luminal side in S5 and S6 is lost, making the opening of the channel difficult.

References

    1. Meissner, G. The structural basis of ryanodine receptor ion channel function. J. Gen. Physiol.149, 1065–1089 (2017). - PMC - PubMed
    1. Woll, K. A. & Van Petegem, F. Calcium-release channels: structure and function of IP(3) receptors and ryanodine receptors. Physiol. Rev.102, 209–268 (2022). - PubMed
    1. Rios, E. & Pizarro, G. Voltage sensor of excitation-contraction coupling in skeletal muscle. Physiol. Rev.71, 849–908 (1991). - PubMed
    1. Schneider, M. F. Control of calcium release in functioning skeletal muscle fibers. Annu Rev. Physiol.56, 463–484 (1994). - PubMed
    1. Endo, M. Calcium-Induced Calcium Release in Skeletal Muscle. Physiol. Rev.89, 1153–1176 (2009). - PubMed

Publication types

Substances