

Three-dimensional wave breaking
- PMID: 39294351
- PMCID: PMC11410657
- DOI: 10.1038/s41586-024-07886-z
Three-dimensional wave breaking
Erratum in
-
Author Correction: Three-dimensional wave breaking.Nature. 2024 Nov;635(8040):E10. doi: 10.1038/s41586-024-08302-2. Nature. 2024. PMID: 39511327 Free PMC article. No abstract available.
Abstract
Although a ubiquitous natural phenomenon, the onset and subsequent process of surface wave breaking are not fully understood. Breaking affects how steep waves become and drives air-sea exchanges1. Most seminal and state-of-the-art research on breaking is underpinned by the assumption of two-dimensionality, although ocean waves are three dimensional. We present experimental results that assess how three-dimensionality affects breaking, without putting limits on the direction of travel of the waves. We show that the breaking-onset steepness of the most directionally spread case is double that of its unidirectional counterpart. We identify three breaking regimes. As directional spreading increases, horizontally overturning 'travelling-wave breaking' (I), which forms the basis of two-dimensional breaking, is replaced by vertically jetting 'standing-wave breaking' (II). In between, 'travelling-standing-wave breaking' (III) is characterized by the formation of vertical jets along a fast-moving crest. The mechanisms in each regime determine how breaking limits steepness and affects subsequent air-sea exchanges. Unlike in two dimensions, three-dimensional wave-breaking onset does not limit how steep waves may become, and we produce directionally spread waves 80% steeper than at breaking onset and four times steeper than equivalent two-dimensional waves at their breaking onset. Our observations challenge the validity of state-of-the-art methods used to calculate energy dissipation and to design offshore structures in highly directionally spread seas.
© 2024. The Author(s).
Conflict of interest statement
The authors declare no competing interests.
Figures

 Δθ = 0°;
  σθ = 0°,
  10° or
  20°; Extended Data Table 1). Markers with black outlines correspond to the experiments shown in a–c and g–i. In a–c and g–i, the waves travel from left to right.
 Δθ = 0°) (a) and bimodal (b) directionally spread focused wave groups. In b, σθ = 0° (circles with a saltire), 10° (circles with a cross) or 20° (open circles). c, 3D surfaces of the breaking-onset steepness of all the wave groups as a function of spreading width σθ and crossing angle Δθ. The markers denote measured values of global steepness . Annotations denote the regimes of the different breaking phenomena observed during the experiments (‘Wave-breaking mechanisms’). The grey shaded area represents the transition between regimes.
 Δθ = 0°;
  σθ = 0°,
  10° or
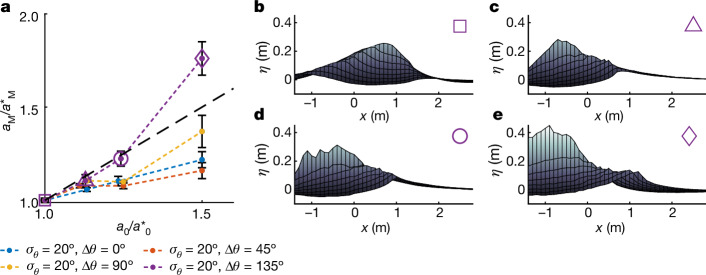
  20°; Extended Data Table 1). a,d, Contour maps of how the measures of directional spreading Ω0 (a) and Ω1 (d) vary as functions of σθ and Δθ, with markers to demonstrate where our experiments are located within this parameter space. b,e, Maximum values of measured local slope ∣∇η∣⋆ at breaking onset plotted as a function of Ω0 (b) and Ω1 (e). The horizontal grey dashed, dotted-dashed and dotted lines correspond to the maximum slopes for a progressive wave (), a periodic axisymmetric standing wave () and a 2D periodic standing wave (), respectively. c,f, Measured global steepness at breaking onset plotted as a function of Ω0 (c) and Ω1 (f). The horizontal grey dashed lines correspond to S = 0.34 obtained for 2D waves in ref. . Blue markers are approximate values of the breaking steepness for an axisymmetric standing wave taken from ref. . See Extended Data Table 2 for the coefficients of the parametric fits shown by the black dotted lines in b, c and f. The black dashed line in b is the parametric fit to the data but shifted vertically so that it is equal to at Ω0 = 0. Error bars correspond to the truncation error associated with the first-order central differencing used to the calculate slope of ∣∇η∣⋆ from gauges spaced at 0.1 m intervals (Methods). The errors of the global steepness are negligibly small and not shown (Methods).
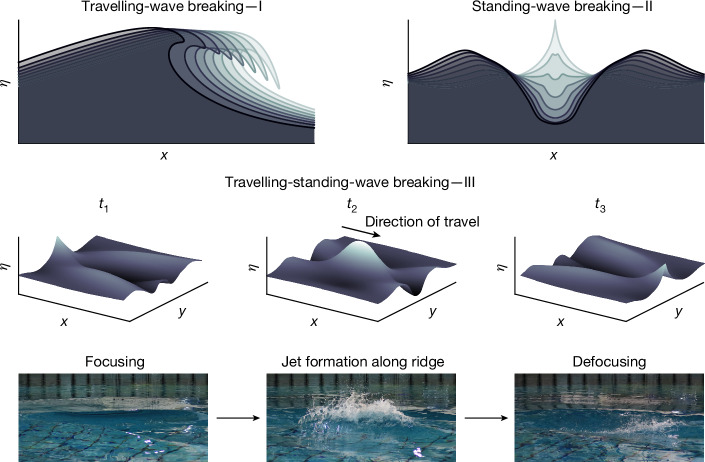


References
-
- Deike, L. Mass transfer at the ocean–atmosphere interface: the role of wave breaking, droplets, and bubbles. Annu. Rev. Fluid Mech.54, 191–224 (2022).
-
- Cokelet, E. D. Breaking waves. Nature267, 769–774 (1977).
-
- Thorpe, S. A. & Humphries, P. N. Bubbles and breaking waves. Nature283, 463–465 (1980).
-
- Melville, W. K. & Rapp, R. J. Momentum flux in breaking waves. Nature317, 514–516 (1985).
-
- Lamarre, E. & Melville, W. K. Air entrainment and dissipation in breaking waves. Nature351, 469–472 (1991).
LinkOut - more resources
Full Text Sources
Research Materials
