. 2024 Sep;633(8030):542-547.
doi: 10.1038/s41586-024-07824-z. Epub 2024 Sep 18.

Observation of quantum entanglement with top quarks at the ATLAS detector

Collaborators

Observation of quantum entanglement with top quarks at the ATLAS detector

ATLAS Collaboration. Nature. 2024 Sep.

Abstract

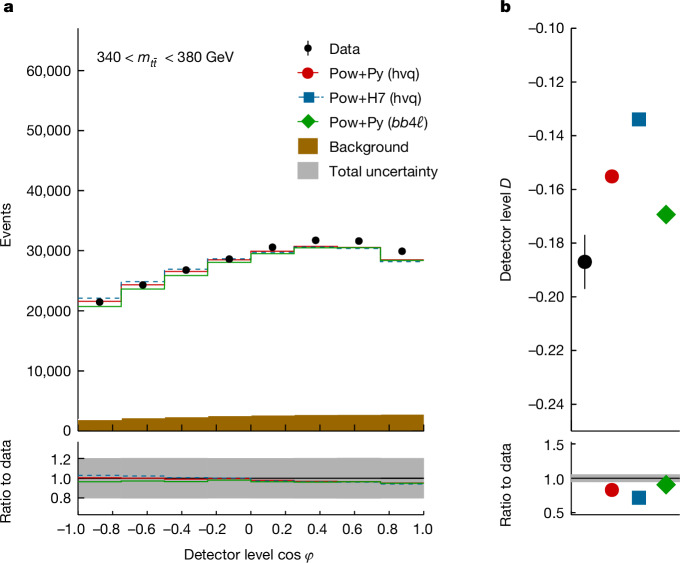
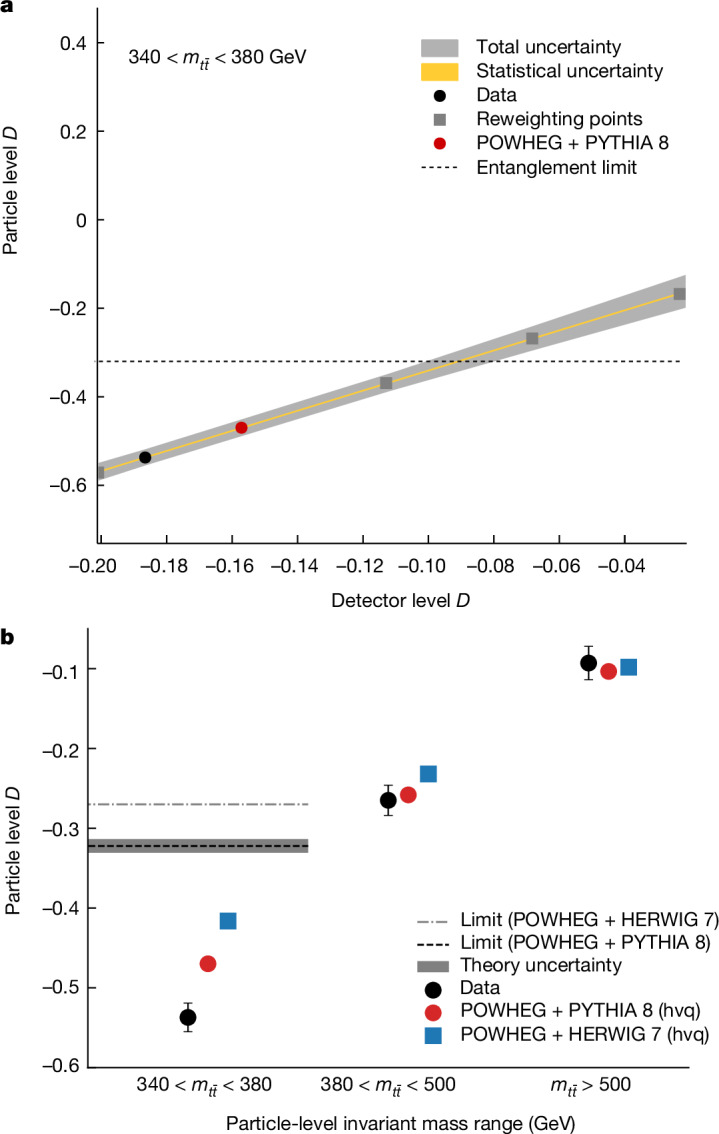
Entanglement is a key feature of quantum mechanics1-3, with applications in fields such as metrology, cryptography, quantum information and quantum computation4-8. It has been observed in a wide variety of systems and length scales, ranging from the microscopic9-13 to the macroscopic14-16. However, entanglement remains largely unexplored at the highest accessible energy scales. Here we report the highest-energy observation of entanglement, in top-antitop quark events produced at the Large Hadron Collider, using a proton-proton collision dataset with a centre-of-mass energy of √s = 13 TeV and an integrated luminosity of 140 inverse femtobarns (fb)-1 recorded with the ATLAS experiment. Spin entanglement is detected from the measurement of a single observable D, inferred from the angle between the charged leptons in their parent top- and antitop-quark rest frames. The observable is measured in a narrow interval around the top-antitop quark production threshold, at which the entanglement detection is expected to be significant. It is reported in a fiducial phase space defined with stable particles to minimize the uncertainties that stem from the limitations of the Monte Carlo event generators and the parton shower model in modelling top-quark pair production. The entanglement marker is measured to be D = -0.537 ± 0.002 (stat.) ± 0.019 (syst.) for 340 GeV < m t t ¯ < 380 GeV . The observed result is more than five standard deviations from a scenario without entanglement and hence constitutes the first observation of entanglement in a pair of quarks and the highest-energy observation of entanglement so far.


Conflict of interest statement

The authors declare no competing interests.

Figures

Fig. 1
Fig. 1. Detector-level results.
a, The cos φ observable in the signal region at the detector level. b, The entanglement marker D, calculated from the detector-level distributions, from three different Monte Carlo generators; the POWHEG + PYTHIA and POWHEG + HERWIG heavy-quark models, labelled Pow+Py (hvq) and Pow+H7 (hvq), respectively, and the POWHEG + PYTHIA bb4 model, labelled Pow + Py (bb4), are shown after background processes are subtracted. The uncertainty band shows the uncertainties from all sources added in quadrature. The ratios of the predictions to the data are shown at the bottom of a and b. The quoted value for D for the bb4 model also includes subtraction of the single-top-quark background.
Fig. 2
Fig. 2. Summary of results.
a, Calibration curve for the dependence between the particle-level value of D and the detector-level value of D in the signal region. The yellow band represents the statistical uncertainty, and the grey band represents the total uncertainty obtained by adding the statistical and systematic uncertainties in quadrature. The measured values and expected values from POWHEG + PYTHIA 8 (hvq) are marked with black and red circles, respectively, and the entanglement limit is shown as a dashed line. b, The particle-level D results in the signal and validation regions compared with various Monte Carlo models. The entanglement limit shown is a conversion from its parton-level value of D = −1/3 to the corresponding value at the particle level, and the uncertainties that are considered for the band are described in the text.
Extended Data Fig. 1
Extended Data Fig. 1. Example of reweighting technique.
Example of the nominal cosφ distribution and the results of applying the reweighting technique with X=0.4,0.6,0.8,1.2 in the signal region at parton level. The lower panel shows the ratio of each D value after reweighting (‘Pred.’) to the nominal D value (‘Nom.’).
Extended Data Fig. 2
Extended Data Fig. 2. Parton shower generator studies.
Comparison between cosφ distributions in the signal region with mtt¯<380 GeV for different Monte Carlo event generator setups at stable-particle level. Figure (a) compares events simulated with POWHEG BOX which are interfaced with either PYTHIA (red line, pT-ordered dipole shower) or HERWIG (blue line, angular-ordered shower) while figure (b) compares events simulated with HERWIG using either a dipole-ordered shower (red line) or an angular-ordered shower (blue line).

References

    1. Einstein, A., Podolsky, B. & Rosen, N. Can quantum-mechanical description of physical reality be considered complete? Phys. Rev.47, 777–780 (1935).
    1. Schrödinger, E. Discussion of probability relations between separated systems. Math. Proc. Camb. Philos. Soc.31, 555–563 (1935).
    1. Bell, J. S. On the Einstein Podolsky Rosen paradox. Phys. Phys. Fizika1, 195–200 (1964).
    1. Bennett, C. H. & DiVincenzo, D. P. Quantum information and computation. Nature404, 247–255 (2000). - PubMed
    1. Nielsen, M. & Chuang, I. L. Quantum Computation and Quantum Information (Cambridge Univ. Press, 2000).