. 2024 Oct;21(10):1947-1957.
doi: 10.1038/s41592-024-02409-0. Epub 2024 Sep 18.

Genomics 2 Proteins portal: a resource and discovery tool for linking genetic screening outputs to protein sequences and structures

Affiliations

Genomics 2 Proteins portal: a resource and discovery tool for linking genetic screening outputs to protein sequences and structures

Seulki Kwon et al. Nat Methods. 2024 Oct.

Abstract

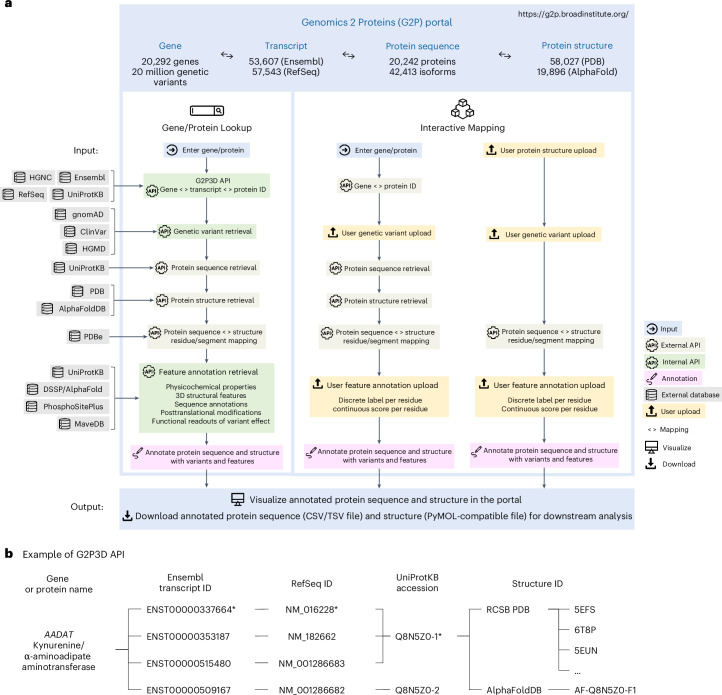
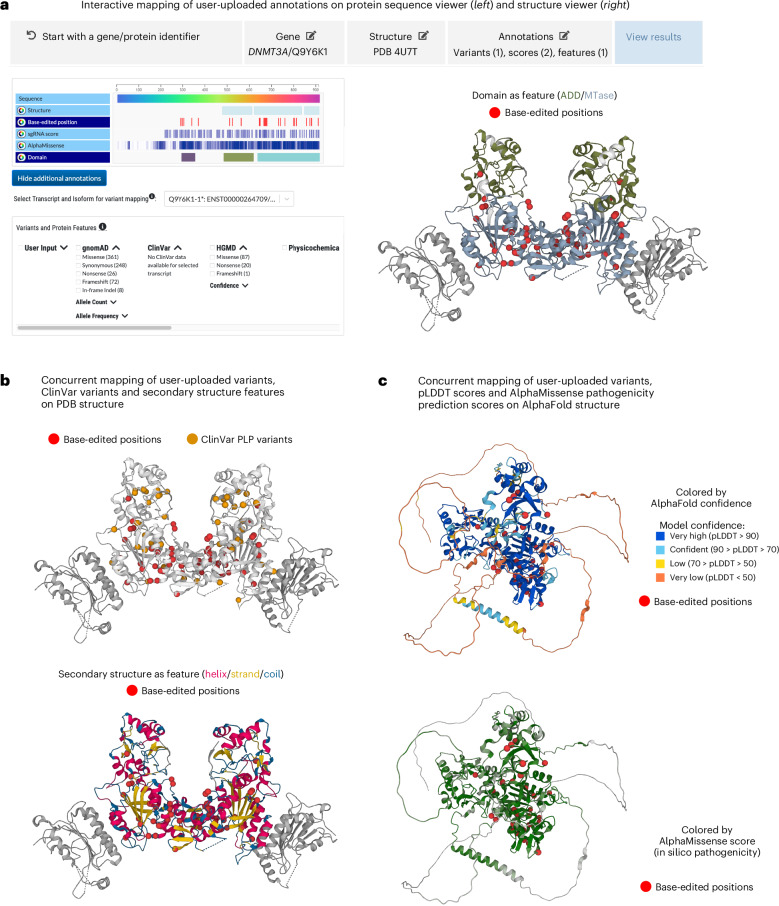
Recent advances in AI-based methods have revolutionized the field of structural biology. Concomitantly, high-throughput sequencing and functional genomics have generated genetic variants at an unprecedented scale. However, efficient tools and resources are needed to link disparate data types-to 'map' variants onto protein structures, to better understand how the variation causes disease, and thereby design therapeutics. Here we present the Genomics 2 Proteins portal ( https://g2p.broadinstitute.org/ ): a human proteome-wide resource that maps 20,076,998 genetic variants onto 42,413 protein sequences and 77,923 structures, with a comprehensive set of structural and functional features. Additionally, the Genomics 2 Proteins portal allows users to interactively upload protein residue-wise annotations (for example, variants and scores) as well as the protein structure beyond databases to establish the connection between genomics to proteins. The portal serves as an easy-to-use discovery tool for researchers and scientists to hypothesize the structure-function relationship between natural or synthetic variations and their molecular phenotypes.


Conflict of interest statement

The authors declare no competing interests.

Figures

Fig. 1
Fig. 1. The bioinformatic framework of the G2P portal.
a, Schematic of data and method integration in the G2P portal and its two main modules: ‘Gene/Protein Lookup’ and ‘Interactive Mapping’. In the Gene/Protein Lookup module, the connections across identifiers of human genes, transcripts, protein sequences and structures were established using an in-house API: G2P3D, for the entire human proteome (see ‘Construction of G2P3D API’ in Methods for details). Variants from databases, such as gnomAD, ClinVar and HGMD, were subsequently mapped onto protein sequences and structures upon dynamically querying UniProtKB and structure databases (PDB and AlphaFoldDB), respectively. Additionally, protein feature annotations were fetched and calculated from various databases and tools (UniProtKB, DSSP and PhosphoSitePlus). All annotated protein sequences and structures with variants and features are viewable on the portal and downloadable in interoperable formats for further analyses. In the Interactive Mapping module of the portal, users can upload protein residue-wise annotations of variants and additional features and perform linking genetic data to protein structural data. Users can access this module by starting from a gene and by uploading an in-house protein structure. b, An example of G2P3D API output; the API links human genes (HGNC) to transcripts (Ensembl and RefSeq) to protein sequences (UniProtKB) and structures (PDB and AlphaFoldDB). In this example, AADAT has four Ensembl transcripts and four RefSeq transcripts; three pairs of Ensembl-RefSeq transcripts encode the canonical protein isoform (Q8N5Z0-1*) and the remaining one transcript (ENST00000509167/NM_001286682) corresponds to the noncanonical protein isoform, Q8N5Z0-2. The canonical protein isoform is further dynamically linked to multiple available PDB structures and the AlphaFold structure. In the portal, variants are mapped onto both canonical and noncanonical protein isoforms. Only canonical protein isoform variants are mapped to available protein structures.
Fig. 2
Fig. 2. Statistics of variants from gnomAD, ClinVar and HGMD databases aggregated in the G2P portal.
ac, Distribution of variant types (single nucleotide variation (SNV) versus non-SNV; insertion, deletion and inversion) and associated protein consequences (missense, synonymous, nonsense, frameshift, in-frame indel and others for all other protein consequences) among 20 million protein-coding variants in gnomAD (a), ClinVar (b) and HGMD (c) databases. Among all databases, a majority of human protein-coding variants are SNV occurring missense mutations. d, Distribution of gnomAD variants categorized by AFs: very rare; AF < 0.1%, rare; 0.1% ≤ AF < 0.5%, low frequency; 0.5% ≤ AF < 5%, and common; AF ≥ 5%. The distributions of each AF group are illustrated across different protein consequences (missense, synonymous, nonsense, frameshift and in-frame indel). e, Distribution of the clinical significance of ClinVar variants (PLP, BLB, VUS/CI and others) displayed across different protein consequences. f, Distribution of confidence levels (high or low) for HGMD variants across different protein consequences. Source data
Fig. 3
Fig. 3. Statistics of variants mapped on 3D structures in the G2P portal.
Variants annotated on transcripts corresponding to the canonical protein isoforms were mapped on 3D structures. The total number of canonical protein isoform variants from each database is shown in the middle of the donut chart. a, The proportion of 9.4 million gnomAD variants mapped on PDB, AlphaFoldDB or both. b, The proportion of 1.5 million ClinVar variants mapped on PDB, AlphaFold or both. c, The proportion of 280 thousand HGMD variants mapped on PDB, AlphaFold or both. d, The distribution of protein consequences (upper) and AF group (lower) among gnomAD variants mapped on AlphaFold (8.8 million variants) and PDB (2.2 million variants). e, The distribution of protein consequences (upper) and clinical significance (lower) among ClinVar variants mapped on AlphaFold (1.3 million variants) and PDB (542 thousand variants). f, The distribution of protein consequences (upper) and confidence (lower) among HGMD variants mapped on AlphaFold (244 thousand variants) and PDB (134 thousand variants). Source data
Fig. 4
Fig. 4. Abundance of protein features across nine missense variant datasets.
These variant datasets include gnomAD variants binned by AF: very rare; AF < 0.1%, rare; 0.1% AF < 0.5%, low frequency; 0.5% AF < 5%, and common; AF 5%, ClinVar variants grouped by clinical significance: PLP, BLB, VUS and HGMD disease mutations grouped by confidence levels: high and low. For details about each protein feature, see Protein features in the G2P portal’ in Methods. a, The abundance of each sequence annotation from UniProt and PTM site within a given dataset. The calculated abundance of a feature (for example, active site) is denoted as the numerical value at each data point (see Supplementary Fig. 6 for the details of feature abundance calculation). Each point is color coded based on its normalized abundance, wherein the abundance is divided by the maximum value among the nine datasets (denoted as bold and circled) to facilitate comparison of relative abundances across different features. For example, the abundance of the active site is the highest for the ClinVar PLP dataset, represented as 0.23, resulting in the darkest color where normalized abundance equals 1, while the gnomAD common dataset has 0/23 = 0 having the brightest color. b, The proportion of three-class (left) and nine-class (right) secondary structures within variant datasets. Nine secondary structure classes are grouped into three larger classes: helix (H; 310-helix/G, α-helix/H, π-helix/I and polyproline helix/P), strand (B; β-sheet/E and β-bridge/B) and loop (C; bend/S, turn/T and coil/C). Structured regions (helix and strand) have a higher prevalence of harboring pathogenic variants (~56% of ClinVar PLP variants and HGMD high-confidence disease mutations). c, Violin plots showing the distributions of 3D structural features (accessible surface area and backbone phi/psi angles) across different variant datasets. The plots are divided into high (pLDDT 70, n = 4,134,666) and low (pLDDT < 70, n = 2,544,814) confidence as predicted by AlphaFold. The violins illustrate the probability density of the data at different values, with the white dot representing the median, the thick black bar in the center representing the interquartile range (IQR), and the thin black line representing the 95% confidence interval. Features of variants summarized in b and c are computed using AlphaFold structures. Source data
Fig. 5
Fig. 5. A use case of the Gene/Protein Lookup module for reported variants and protein features of MORC2.
a, The landing page of the Gene/Protein Lookup module shows an overview of the input gene (MORC2) information, followed by the protein sequence viewer displaying the aggregated protein features and variants on a selected transcript. b, To map variants on a structure, users can navigate to ‘variant to protein structure’ from the landing page of the Gene/Protein Lookup module, select a structure, and ‘click to view’, which launches the protein structure viewer. The viewer illustrates a structure of PDB 5OF9 with concurrent mapping of ClinVar PLP variants track (yellow) and protein feature; Binding site (black).
Fig. 6
Fig. 6. A use case of the Interactive Mapping module using DNMT3A base-editing screens.
a, The user interface of the Interactive Mapping. From ‘start with a gene/protein identifier’, users are asked to select a gene (DNMT3A), structure (PDB 4U7T) and upload annotations (variants, to be shown as spheres; continuous data or scores, to be shown as a heat map; and discrete data or features, to be shown in discrete colors). The selected gene, structure and entered annotations can be edited by going back through the workflow. Finally, in ‘view results’, annotations are visible on sequence (left) and structure (right). The annotation tracks are selectable from the sequence viewer to map specific tracks on the structure. For example, the mapping on the structure viewer (right) is the result of clicking the ‘base-edited position’ and ‘domain’ tracks, where variation data are shown as red spheres and domain annotations are displayed as features in different colors. Colors are editable by the users. b, Illustration of the concurrent mapping of user-uploaded variant annotations and data from additional G2P-provided resources on the structure (‘Resources in the G2P portal’ in Results). Top, the Base-edited positions (red spheres) and the ClinVar PLP variants (orange spheres) are simultaneously mapped on the structure (MORC2, PDB 7PFP). Bottom, the base-edited positions (red spheres) are displayed in the context of secondary structure annotations (as discrete features) available in the portal. c, Illustration of the concurrent mapping of user-uploaded variants, features and scores on the structure. Top, base-edited positions (red spheres) in the context of pLDDT values (four discrete features: very high, confident, low and very low); bottom, user-provided base-edited positions (red spheres) in the context AlphaMissense pathogenicity scores (green spectrum) where darker green indicates higher pathogenicity scores. After performing a workflow in the Interactive Mapping, users can download the current mappings as a TSV file (protein residue-wise annotation) and a PyMOL-compatible structure file.
Extended Data Fig. 1
Extended Data Fig. 1. The Google Cloud infrastructure of the G2P portal.
This figure illustrates the web implementation of the portal. The frontend is implemented in React.js and includes a customized version of RCSB Saguaro 1D Feature Viewer and Mol* as protein sequence and structure viewer, respectively. The backend is implemented in Node.js and uses the Google app engine. Users can query, upload, and retrieve data from the portal, and the flow of user-uploaded, static, and dynamic data is shown with arrows in different colors (user-uploaded data in orange, static data in cyan, and dynamic data in pink). All static data are stored in Google cloud storage. All user-uploaded data remain on the users’ browser, securing the confidentiality of users’ data.
Extended Data Fig. 2
Extended Data Fig. 2. The sitemap of the Genomics 2 Proteins (G2P) portal.
From the home page, users can access the About, Documentation, Release Logs, APIs in the portal, and Feedback pages, available on the navigation bar at the top of the portal. There are two main modules in the portal: (1) Gene/Protein Lookup, accessible via searching by a human gene or protein name; (2) Interactive Mapping, accessible via secure Google sign-in upon clicking on the button displayed on the home page. The Gene/Protein lookup module has five submodules for protein sequence annotation, variant mapping to protein sequence, variant mapping to protein structure, gene to transcript to protein isoform mapping, and links to additional resources. The Interactive Mapping module has two submodules, for allowing users to start with any human gene or a protein structure to map user-uploaded data onto the target protein’s sequence and structure. The user input, data sources, visualization methods, and downloadable data formats within each submodule are listed in the figure.
Extended Data Fig. 3
Extended Data Fig. 3. Data visualization tools in the G2P portal.
(a) Protein sequence viewer. This viewer displays protein residue-wise variants and protein features for the selected gene and transcript. Variants can be filtered based on protein consequences and database-specific filters. Data displayed within the viewer can be exported in tabular format (View as table button) and downloaded as CSV or PDF formats (Download button). The figure shows gnomAD missense (singletons; blue) and ClinVar missense (pathogenic/likely-pathogenic; orange) for gene CBS and transcript NM_000071 along with residue-wise physicochemical properties and UniProt sequence annotations in the protein sequence viewer. (b) Protein structure viewer. In the G2P portal, the structure viewer is coupled with the sequence viewer to interactively map variants and protein features on the sequence viewer onto the structure. Users can click a track to select variants or features from the sequence viewer to visualize on the structure viewer. Users can download the customized mapping results in a PyMOL-compatible file. The figure displays the concurrent mapping of gnomAD synonymous singleton variants (green spheres), ClinVar missense pathogenic/likely pathogenic variants (orange spheres), and the Domain annotation from UniProtKB (light blue) mapped on the structure (PDB: 7QGT) (c) Variant information and protein feature cards. These cards provide a per-variant summary of variant details and protein features for the variant position (see Methods: Data visualization tools in the G2P portal, for details). The example in this figure shows the details of CBS variant Gly116Arg from ClinVar and the physicochemical, structural, and functional features for the variant position, Gly116. The variant and features are linked to their sources, whenever available. (d) Mutagenesis output viewer. This viewer shows the mutagenesis readouts, when available in MaveDB, for a gene as a heatmap. By hovering over the heatmap, users can view the readouts from the assay and can download the entire score set by clicking the download icon. The figure highlights the residues 90-390 with a differentiating mutagenesis readouts compared to the rest of the protein.

Update of

Similar articles

Cited by

References

    1. Jumper, J. et al. Highly accurate protein structure prediction with AlphaFold. Nature596, 583–589 (2021). - PMC - PubMed
    1. Baek, M. et al. Accurate prediction of protein structures and interactions using a three-track neural network. Science373, 871–876 (2021). - PMC - PubMed
    1. Krishna, R. et al. Generalized biomolecular modeling and design with RoseTTAFold All-Atom. Science384, eadl2528 (2024). - PubMed
    1. Lin, Z. M. et al. Evolutionary-scale prediction of atomic-level protein structure with a language model. Science379, 1123–1130 (2023). - PubMed
    1. Hekkelman, M. L., Vries, I. D., Joosten, R. P. & Perrakis, A. AlphaFill: enriching AlphaFold models with ligands and cofactors. Nat. Methods20, 205–213 (2023). - PMC - PubMed

LinkOut - more resources