. 2024 Sep;633(8031):914-922.
doi: 10.1038/s41586-024-07922-y. Epub 2024 Sep 18.

Pathogenic hypothalamic extracellular matrix promotes metabolic disease

Affiliations

Pathogenic hypothalamic extracellular matrix promotes metabolic disease

Cait A Beddows et al. Nature. 2024 Sep.

Abstract

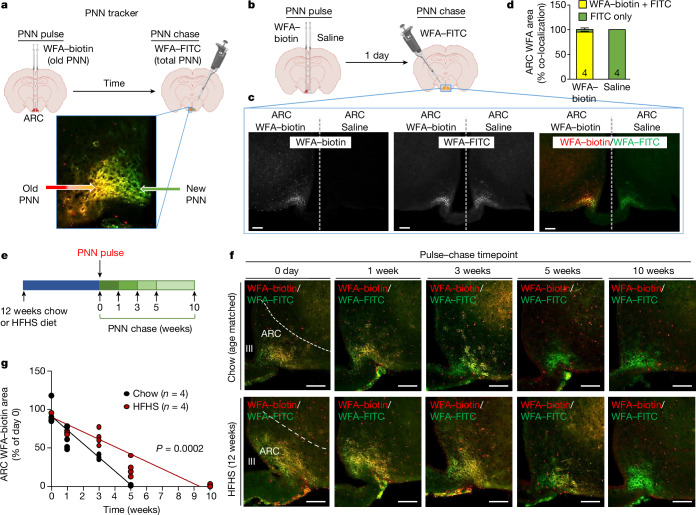
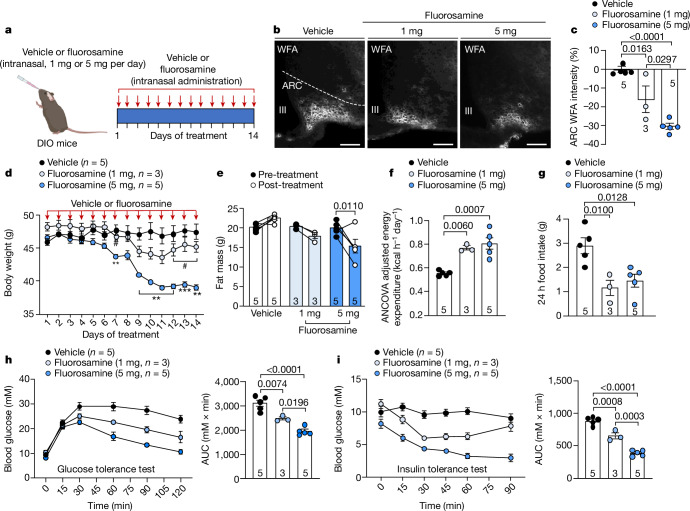
Metabolic diseases such as obesity and type 2 diabetes are marked by insulin resistance1,2. Cells within the arcuate nucleus of the hypothalamus (ARC), which are crucial for regulating metabolism, become insulin resistant during the progression of metabolic disease3-8, but these mechanisms are not fully understood. Here we investigated the role of a specialized chondroitin sulfate proteoglycan extracellular matrix, termed a perineuronal net, which surrounds ARC neurons. In metabolic disease, the perineuronal net of the ARC becomes augmented and remodelled, driving insulin resistance and metabolic dysfunction. Disruption of the perineuronal net in obese mice, either enzymatically or with small molecules, improves insulin access to the brain, reversing neuronal insulin resistance and enhancing metabolic health. Our findings identify ARC extracellular matrix remodelling as a fundamental mechanism driving metabolic diseases.


Conflict of interest statement

G.T.D, C.A.B. and F.S. hold method-of-use patents for treating insulin resistance and associated disorders (patent numbers WO2024086895 and WO2024113004).

Figures

Fig. 1
Fig. 1. Obesity drives neurofibrosis within the ARC.
ae, Aged-matched C57BL/6J mice were fed either a chow or an HFHS diet for 0 days, 3 days or 1, 4, 8 or 12 weeks and brains were processed for WFA staining. a, Whole-brain coronal section, showing WFA staining in the ARC. b,c, Quantification of WFA-stained area (b) and intensity (c) in the ARC of 12-week HFHS-fed mice. d,e, WFA staining (d) and quantification of WFA-stained area (e) in mice fed chow or HFHS diet for 0 days, 3 days (d) or 1, 4, 8 or 12 weeks (wk). f, ARC homogenates from 12-week HFHS-fed or chow-fed C57BL/6J mice were analysed using zwitterionic hydrophilic interaction liquid chromatography to quantify the abundance of CS-GAG and hyaluronic acid (β1-3-linked disaccharides with various sulfate positions: 0S, non-sulfated; 2S, sulfated unsaturated hexuronic acid; 4S, 6S, sulfated N-acetyl-galactosamine) with 2-aminobenzamide fluorescently labelled disaccharides from enzymatically depolymerized GAG chains. Data are mean ± s.e.m. n value represent independent mice and are shown on or above each bar plot; representative of at least three independent experiments. Two-tailed t-test (b,c,f) and one-way ANOVA with Dunnett’s multiple comparisons (e). Scale bars, 100 µm. a.u., arbitrary units; 2-AB, 2-aminobenzamide; III, third ventricle; CS, chondroitin sulfate; GAG, glycosaminoglycan, HA, hyaluronic acid. Source Data
Fig. 2
Fig. 2. Attenuated PNN turnover in the ARC drives neurofibrosis.
a, Schematic overview of the PNN tracker method. b,c, Unilateral administration of WFA–biotin or saline into the ARC of 8-week-old C57BL6J mice (b); one day after injection, brains were processed for immunohistochemistry to monitor for WFA–biotin and WFA–FITC. d, Quantification of WFA-stained area within the ARC. e, Twelve-week DIO or age-matched 12-week chow-fed C57BL6/J male mice received bilateral WFA–biotin injections into the ARC. Brains were extracted at 0 days or 1, 3, 5 or 10 weeks after injection and analysed for the presence of WFA–biotin and WFA–FITC presence. f,g, PNN turnover within the ARC was imaged (f) and quantified (g; simple linear regression) over time. Data are mean ± s.e.m. n represents biologically independent samples; representative of at least two independent experiments. Scale bars, 100 µm. Source Data
Fig. 3
Fig. 3. Disassembly of neurofibrosis within the ARC promotes the remission of metabolic disease.
a, C57BL/6J mice on a HFHS diet received bilateral intra-ARC injections of vehicle or chABC. Vehicle-treated mice were pair-fed (PF) to the food intake of chABC-treated mice. bk, Body weight (b), adiposity (c), food intake (d), energy expenditure (e), gross morphology of ingWAT (f), ingWAT histology and UCP1 immunohistochemistry (g), inguinal dermal thermography (h) with quantification (i), glucose tolerance (j) and HOMA-IR (k) for mice treated as described in a. AUC, area under the curve. l, Hyperinsulinaemic–euglycaemic clamps were performed in HFHS-fed mice following bilateral injections of vehicle or chABC into the ARC and glucose infusion rate (GIR) was determined. Data are mean ± s.e.m. Two-way ANOVA with multiple comparisons or repeated-measures (b,c,l) and two-tailed t-test (d,e,ik). n represents biologically independent samples; representative of at least two independent experiments. Scale bars, 100 µm. P values compare vehicle to chABC (*), or vehicle to vehicle or pair-fed to chABC (#). #,*P < 0.05, **P < 0.01, ***P < 0.001, ****P < 0.0001. Source Data
Fig. 4
Fig. 4. Neurofibrosis in obesity promotes ARC insulin resistance.
a, C57BL/6J mice fed a HFHS diet received bilateral intra-ARC injections of vehicle or chABC. bd, Insulin–FITC area (b), intensity (c) and insulin–FITC induced AKT phosphorylation (d) within the ARC were quantified four days post-injection. e,f, Insulin–FITC binding to CSPG components—CSPG mix, aggrecan or C4S (e) and in the presence of chABC or polyarginine (f)—was assessed in vitro. g, Twelve-week HFHS-fed AgRP-Cas9 mice injected with AAV expressing scrambled (AAV-gScrambled) or insulin receptor (AAV-gIR) sgRNA into the ARC. ARC targeting was confirmed by Agrp-GFP and mCherry immunofluorescence. IR, insulin receptor. h,i, One week later, mice received bilateral injections of vehicle or chABC, and body weight (h) and glucose tolerance (i) were measured. Results are mean ± s.e.m. Two-way ANOVA with Tukey’s multiple comparisons test (h) and one-way ANOVA with Tukey’s multiple comparisons (bf,i). n represents biologically independent samples; representative of at least two independent experiments. Scale bars, 100 µm. Source Data
Fig. 5
Fig. 5. Intranasal delivery of neurofibrosis inhibitors promotes remission of metabolic disease.
a, Twelve-week HFHS-fed male mice received daily intranasally delivered vehicle or fluorosamine (1 or 5 mg) for 14 days. bi, WFA staining (b) and quantification (c), body weight (d), adiposity (e), energy expenditure (f), food intake (g), glucose tolerance (h) and insulin sensitivity (i) of mice treated as in a. Data are mean ± s.e.m. Two-way ANOVA with multiple comparisons test (d,e) and one-way ANOVA with Tukey’s multiple comparisons (c,fi). P values compare vehicle to 5 mg fluorosamine (*) or vehicle to 1 mg fluorosamine (#). n represents biologically independent samples; representative of at least two independent experiments. Scale bars, 100 µm. Source Data
Extended Data Fig. 1
Extended Data Fig. 1. The development of neurofibrosis within the ARC across dietary and genetic models of obesity.
Aged-matched C57BL/6 J mice were fed a chow or HFHS diet for 12 weeks and brains were processed for immunohistochemistry monitoring for WFA. Staining area and intensity was quantified in the a-c) rostral ARC, d-f) caudal ARC, g,h) RSG and i-k) VMH. C57BL/6 J mice were fed HFHS diet for 0, 3 days, 1, 4, 8 or 12 weeks and l) the PNN intensity in the ARC, m) body weight, n) fat mass and o) glucose tolerance were assessed. p-r) Sprague Dawley rats were fed a chow or HFHS or s-u) C57BL6/J mice fed a chow or HFHC diet for 12 weeks or 30 weeks, respectively, and brains were processed for WFA immunostaining and q,t) area and r,u) intensity within the ARC quantified. Brains from chow fed v-x) obese db/db or non-obese wt/db controls and y,z) obese NZO or non-obese B6 controls were processed for WFA immunostaining. Results are mean ± SEM; significance was determined using b, c, e, f, k, q, r, t, u, w, x, z) two-tailed t-test, or l-o) one way ANOVA with multiple comparisons. n = biologically independent samples and significance is representative of at least three independent experiments. Scale bar, 100 µm. Abbreviations: III, 3rd ventricle; ARC, arcuate nucleus of the hypothalamus; HFHC, high-fat high-cholesterol; HFHS, high-fat high-sugar diet; NZO, New Zealand Obese mouse; RSG, Retrosplenial cortex; VMH, ventromedial hypothalamus; WFA, Wisteria Floribunda Lectin; AUC, area under the curve. Source Data
Extended Data Fig. 2
Extended Data Fig. 2. Obesity driven ARC neurofibrosis is underscored by compositional changes in the PNN.
a) Aged-matched C57BL/6 J mice were fed a chow or HFHS diet for 12 weeks and brains were processed for aggrecan immunostaining; b) area, c) intensity and d,e) co-expression within the ARC was quantified. f) C57BL/6 J mice were fed HFHS diet for 0, 3 days, 1, 4, 8 or 12 weeks and brains were processed for aggrecan immunohistochemistry and g) staining area was quantified. h-k, p-r) Npy-GFP and l-o) Pomc-EGP mice were HFHS fed for 0, 4 and 12 weeks and brains processed for h-o) WFA or p-r) aggrecan immunostaining. k,o) Cell number, i,m,q) staining encased cell number, and j,n,r) surrounding staining intensity was quantified. Results are mean ± SEM; significance determined using b, c,) two-tailed t-test, and g, i-r) one-way ANOVA with Tukey’s multiple comparisons. n = biologically independent samples and significance represents at least two independent experiments. Scale bar, 100 µm. Abbreviations: III, 3rd ventricle; ARC, arcuate nucleus of the hypothalamus; GFP, green fluorescent protein; HFHS, high-fat high-sugar diet; NPY, neuropeptide-Y; PNN, perineuronal net; POMC, pro-opiomelanocortin; WFA, Wisteria Floribunda Lectin. Source Data
Extended Data Fig. 3
Extended Data Fig. 3. Validation of PNN Tracker.
a-b) 8-week-old C57BL/6 J mice received bilateral administration of WFA-biotin into the ARC. 3-days post injection mice received further unilateral administration of vehicle or chABC into the ARC. 1- day later brains were extracted and processed for WFA immunohistochemistry and staining c) area and d) intensity was quantified. 8-week old C57BL/6 J mice received e-h) bilateral administration of WFA-biotin into the RSG or i-l) unilateral administration of WFA-biotin into the cc. 0- and 5-weeks post injection brains were extracted and subjected to WFA immunohistochemistry and staining g,k) area and h, l) intensity was quantified. 12-week HFHS-fed or aged-matched chow C57BL/6 J male mice received bilateral administration of WFA-biotin into the ARC. Brains were extracted 0 days, 1-, 3-, 5- or 10-weeks post-injection, processed for WFA immunohistochemistry and m, n) PNN turnover, o) WFA-biotin area, p) WFA-FITC was quantified within the ARC. q) Extracellular matrix regulation enzymes gene expression was determined in the mediobasal hypothalamus from 12-week diet-induced obese or aged-matched chow C57BL/6 J male mice. Results are mean ± SEM; significance determined using c, d, g, o, p, q) two-tailed t-test, m) one-way ANOVA with Dunnett’s multiple comparisons. n = biologically independent samples and significance is representative of at least two independent experiments. Scale bar, 100 µm. Abbreviations: ARC, arcuate nucleus of the hypothalamus; cc, corpus collosum; PNN, perineuronal net; FITC, Fluorescein isothiocyanate; HFHS, high-fat high-sugar diet; RSG, Retrosplenial cortex; WFA, Wisteria Floribunda Lectin. Source Data
Extended Data Fig. 4
Extended Data Fig. 4. Effects of enzymatic attenuation of neurofibrosis on metabolism and glucose homeostasis.
C57BL/6 J mice were fed a HFHS diet for 12 weeks and bilaterally injected with vehicle or chABC into the ARC. a) Representative images of PNN expression from individual mice 10 days post intraARC injection of vehicle or chABC. b) Body weight, c) adiposity, d) cumulative food intake, e,f) energy expenditure, g,h) oxygen consumption, i) RER, j) ambulatory activity, k) BAT dermal thermography, l) fasted blood glucose and m) fasted plasma insulin was measured. Hyperinsulinemic-euglycemic clamps were performed in HFHS fed mice bilaterally intraARC injected with vehicle or chABC. Results are shown for n) blood glucose, o) EGP, p) glucose disposal rate and q) tissue specific insulin-stimulated uptake. 15-week-old db/db mice were bilaterally injected with vehicle or chABC into the ARC. r) Body weights, s) adiposity, t) glucose tolerance and u) HOMA-IR was assessed. Results are mean ± SEM; significance determined using b, c, f, h, o, r, s,) two-way ANOVA with multiple comparisons test and k, l, m, p, t, u) two-tailed t-test. n = biologically independent samples and significance is representative of at least two independent experiments. Scale bar, 100 µm. Abbreviations: 2-DG, [14C] 2-deoxyglucose; BAT, Brown adipose tissue; chABC, chondroitinase ABC; EGP, endogenous glucose production; HFHS, high-fat high-sugar diet; PNN, perineuronal net; RER, Respiratory exchange ratio; WFA, Wisteria Floribunda Lectin. Source Data
Extended Data Fig. 5
Extended Data Fig. 5. Neurofibrosis interacts with insulin in the ARC.
a) C57BL/6 J mice were fed a chow or HFHS diet for 12 weeks and bilaterally injected with vehicle or chABC into the ARC and hypothalami were processed for b-e) insulin-induced p-AKT expression and f) body weights. g) Image demonstrating insulin-FITC and signaling within the ARC. Chow or HFHS C57BL/6 J mice were bilaterally intraARC injected with vehicle or chABC. 4-days post-ARC injection, mice administered with h,i) insulin-FITC or r) leptin-647. h) Representative image and i) quantification of insulin-FITC internalization into ARC neurons. s) ARC leptin-647 expression was quantified by t) area, u) intensity v) number of leptin-647 positive ARC cells and w,x) pSTAT3 cells. j) Lateral ventricle administered insulin-FITC, k) expression, l) area, m) intensity and n) number of insulin-FITC positive cells was quantified. o-q) Mice were administered FITC or insulin-FITC and fluorescent p) area and q) intensity was quantified. Results are mean ± SEM; significance determined using e, p, q) two-tailed t-test and c, f, i, l, m, n, x) one-way ANOVA with Tukey’s multiple comparisons. Scale bar, 100 µm. n = biologically independent samples.h) Scale bar, 5 µm. Abbreviations: III, 3rd ventricle; ARC, arcuate nucleus of the hypothalamus; chABC, chondroitinase ABC; PNN, perineuronal net; DAPI, 4′,6-diamidino-2-phenylindole; FITC, Fluorescein isothiocyanate; GADPH, Glyceraldehyde 3-phosphate dehydrogenase; HFHS, high-fat high-sugar diet; IR, Insulin Receptor; p-AKT, AKT Ser-473 phosphorylation; p-STAT3, phosphorylated signal transducer and activator of transcription 3; PGP9.5, Protein gene product 9.5; p-IR, phosphorylated IR. Source Data
Extended Data Fig. 6
Extended Data Fig. 6. Neurofibrosis regulates AgRP neuronal activity in obesity via insulin signaling deficits.
Whole-cell patch clamp electrophysiology in NPY neurons of HFHS Npy-GFP mice following intraARC vehicle or chABC. a) Proportion of spontaneously firing neurons, b,c) firing frequency d) resting membrane potential and e) IV curve showing K+ currents. C57BL/6 J mice were fed a chow or HFHS diet and bilaterally intraARC injected with vehicle or chABC. f) 3 days later mice were administered vehicle or IR antagonist (S961) and mediobasal hypothalamic gene expression quantified. or g,h) PVH AgRP immunoreactivity was quantified i) CRISPR guide RNA strategy targeting the mouse IR gene. j) IR knockout was determined using western blotting and k) PCR detecting the presence of CRISPR-mediated excision (ΔInsrCRISPR). 12-week HFHS fed AgRP-Cas9 mice received bilateral intraARC injections of AAV-gScrambled or AAV-gIR, and 1-week later mice received bilateral injections of vehicle or chABC to disassemble neurofibrosis in the ARC. l) Adiposity, m) food intake, n) energy expenditure and o) HOMA-IR was assessed. Results are mean ± SEM; significance determined using b, m) unpaired t-tests (two-tailed), d) unpaired t-tests (one-tailed), f, h, n, o) one-way ANOVA with Tukey’s multiple comparisons, e) two-way ANOVA with Holm-Šídák’s multiple comparisons and l) two-way ANOVA with Tukey’s multiple comparisons test. n = biologically independent samples and significance represents at least two independent experiments. Scale bar, 100 µm. Abbreviations: III, 3rd ventricle; AgRP, agouti-related peptide; ARC, arcuate nucleus of the hypothalamus; chABC, chondroitinase ABC; GFP, green fluorescent protein; HFHS, high-fat high-sugar diet; HOMA-IR, Homeostatic Model Assessment for Insulin Resistance; IR, Insulin Receptor; NPY, neuropeptide-Y; PNN, perineuronal net; PVH, paraventricular hypothalamus; WFA, Wisteria Floribunda Lectin. Source Data
Extended Data Fig. 7
Extended Data Fig. 7. Inflammation drives ECM remodeling within the ARC to promote metabolic dysfunction.
a) C57BL/6 J mice were fed a HFHS diet for 12 weeks and brains were extracted for assessment of pro-fibrotic gene expression. b) 10-week-old C57BL/6 J mice received bilateral intraARC injections of anti-inflammatory AAV vectors expressing soluble receptors for TNFR1α and TGFβR or control, before being placed on a HFHS for 8-weeks. Brains were extracted and processed for c,d) ARC WFA immunofluorescence and e) CS-GAG abundance. f) Body weight, g) fasting induced 2-hour food intake, h) energy expenditure and i) glycemic control were assessed. j) 10-week-old C57BL/6 J mice received bilateral injections into the ARC to administer inflammatory AAV vectors expressing TNFα and TGFβ ligands, or control. 6-weeks later mice received bilateral intraARC injections of vehicle or chABC to enzymatically digest the ARC PNN and k,l) brains were processed for WFA immunostaining or m) quantitative analysis of CS-GAG abundance. n) Body weight, o) adiposity, p) fasting induced 2-hour food intake, q) energy expenditure and r) glycemic control was assessed. Results are mean ± SEM; significance determined using o, p, q, r) one-way ANOVA with Tukey’s multiple comparisons, f, n) two-way ANOVA with multiple comparisons, a, d, e, g, h, i, m) two-tailed t-tests. n = biologically independent samples and significance is representative of two independent experiments. Scale bar, 100 µm. Abbreviations: III, 3rd ventricle; ARC, arcuate nucleus of the hypothalamus; AUC, area under the curve; BW, body weight; chABC, chondroitinase ABC; CS-GAG, chondroitin sulfate glycosaminoglycans; GFP, green fluorescent protein; HA, hyaluronan acid; HFHS, high-fat high-sugar diet; IF, inflammatory; WFA, Wisteria Floribunda Lectin. Source Data
Extended Data Fig. 8
Extended Data Fig. 8. Pharmacologically targeting neurofibrosis promotes weight loss in obesity.
a) 12-week HFHS fed male C57BL/6 J mice received daily I.C.V. administration of vehicle or fluorosamine for 10 days. PNN expression in the b-d) ARC, e,f) RSG and g,h) habenula was assessed. Effects on i) body weight, j,k) adiposity, l) energy expenditure, m) ambulatory activity, and n) food intake was assessed. HFHS fed mice received I.C.V. administration of vehicle or fluorosamine (100 or 250 μg/animal) for 10 consecutive days, fasted overnight then given access to food ad libitum and o) behaviour, p) transition point from feeding to resting/satiety and q) the time to satiety was determined. Results are mean ± SEM. Significance determined c, d, h, k, l, n, q) one-way ANOVA with Tukey’s multiple comparisons, i) two-way ANOVA with multiple comparisons. n = biologically independent samples and significance is representative of at least two independent experiments. Scale bar, 100 µm. Abbreviations: III, 3rd ventricle; HFHS, high-fat high-sugar diet; I.C.V., intracerebroventricular; PNN, perineuronal net; WFA, Wisteria Floribunda Lectin. Source Data
Extended Data Fig. 9
Extended Data Fig. 9. Neurofibrosis inhibition protective effects on metabolic disease are dependent upon insulin receptor expression in AgRP neurons.
12-week HFHS fed male C57BL/6 J mice received daily I.C.V. administration of vehicle or fluorosamine for 10 days and a) glucose tolerance, b) fasted blood glucose, c) fasted plasma insulin, d) HOMA-IR and e,f) insulin-induced p-AKT expression was assessed. Hyperinsulinemic-euglycaemic clamps were performed in HFHS fed mice following administration of fluorosamine daily for 5 days I.C.V. and g) GIR, h) glucose disposal, i) EGP, j) tissue specific insulin-stimulated uptake and k) body weight was determined. C57BL/6 J mice fed HFHS diet and treated with low dose STZ to phenocopy aspects of late stage T2D received daily I.C.V. administration of vehicle or fluorosamine for 14 days. l) Daily blood glucose and m) glucose tolerance was assessed. n) 12-week HFHS fed AgRP-Cas9 mice received bilateral injections of AAV-gScrambled or AAV-gIR. 12-week later mice received daily I.C.V. administered vehicle or fluorosamine for 10 days and o) body weights, p) food intake, q) energy expenditure and r) glucose tolerance was assessed. Results are mean ± SEM. Significance determined a, b, c, d, f, p-r) one-way ANOVA with Tukey’s multiple comparisons, g, h, l, o) two-way ANOVA with multiple comparisons, and i, j, k, m) two-tailed t-tests. n = biologically independent samples and significance is representative of at least two independent experiments. Scale bar, 100 µm. * = Vehicle to Fluorosamine 100 µg, or AAV-gScrambled + Vehicle to AAV-gScrambled + Fluorosamine; # = Vehicle to Fluorosamine 250 µg, or AAV-gScrambled + Fluorosamine to AAV-gIR + Fluorosamine, and $ = AAV-gIR + Vehicle to AAV-gIR + Fluorosamine. #,$,*p < 0.05; ##,**p < 0.01; ###,***p < 0.001. Abbreviations: III, 3rd ventricle; AUC, area under curve; GIR, glucose infusion rate; HFHS, high-fat high-sugar diet; I.C.V., intracerebroventricular; IR, Insulin Receptor; p-AKT, AKT Ser-473 phosphorylation; PNN, perineuronal net; STZ, streptozotocin; WFA, Wisteria Floribunda Lectin. Source Data
Extended Data Fig. 10
Extended Data Fig. 10. Intranasal administration of fluorosamine promotes weight loss through enhanced energy expenditure and satiety.
a) 12-week-old male C57Bl6/J mice received daily intranasal administration of a biotin-conjugated vehicle or fluorosamine (5 mg/animal) for 3 days and b) abundant fluorosamine-biotin expression was observed in the ARC. 12-week HFHS fed C57Bl6/J male mice received daily intranasal administration of vehicle or fluorosamine (1 or 5 mg/animal) for 14 days and c,d) adiposity, e) energy expenditure and f) ambulatory activity were assessed. Following 14 days of intranasally delivered vehicle or fluorosamine (1 or 5 mg/animal) mice were fasted overnight then given ad libitum access to food and g) behavior (feeding, drinking, grooming, active, inactive, and resting) was monitored. h) The transition point from feeding to resting/satiety was assessed and i) the time to satiety was determined. Following 14 days of vehicle or fluorosamine treatment mice were administered insulin and brains processed for immunohistochemistry monitoring of k,l) insulin-induced p-AKT expression. Results are mean ± SEM; significance determined using c, d, i, j, l) one-way ANOVA with Tukey’s multiple comparisons and e) two-way ANOVA with repeated measures. n = biologically independent samples. Abbreviations: I.N., intranasal; ingWAT, inguinal adipose tissue; BAT, brown adipose tissue; epiWAT, epididymal adipose tissue; p-AKT, AKT Ser-473 phosphorylation. Source Data

Comment in

References

    1. Beddows, C. A. & Dodd, G. T. Insulin on the brain: the role of central insulin signalling in energy and glucose homeostasis. J. Neuroendocrinol.33, e12947 (2021). - PubMed
    1. Guglielmi, V. et al. Omental adipose tissue fibrosis and insulin resistance in severe obesity. Nutr. Diabetes5, e175 (2015). - PMC - PubMed
    1. Dodd, G. T. et al. A hypothalamic phosphatase switch coordinates energy expenditure with feeding. Cell Metab.26, 375–393.e377 (2017). - PubMed
    1. Dodd, G. T., Lee-Young, R. S., Bruning, J. C. & Tiganis, T. TCPTP regulates insulin signaling in AgRP neurons to coordinate glucose metabolism with feeding. Diabetes67, 1246–1257 (2018). - PubMed
    1. Heni, M. et al. Central insulin administration improves whole-body insulin sensitivity via hypothalamus and parasympathetic outputs in men. Diabetes63, 4083–4088 (2014). - PubMed

MeSH terms

LinkOut - more resources