. 2024 Oct;634(8034):652-661.
doi: 10.1038/s41586-024-07937-5. Epub 2024 Sep 18.

Temporal BMP4 effects on mouse embryonic and extraembryonic development

Affiliations

Temporal BMP4 effects on mouse embryonic and extraembryonic development

Ron Hadas et al. Nature. 2024 Oct.

Abstract

The developing placenta, which in mice originates through the extraembryonic ectoderm (ExE), is essential for mammalian embryonic development. Yet unbiased characterization of the differentiation dynamics of the ExE and its interactions with the embryo proper remains incomplete. Here we develop a temporal single-cell model of mouse gastrulation that maps continuous and parallel differentiation in embryonic and extraembryonic lineages. This is matched with a three-way perturbation approach to target signalling from the embryo proper, the ExE alone, or both. We show that ExE specification involves early spatial and transcriptional bifurcation of uncommitted ectoplacental cone cells and chorion progenitors. Early BMP4 signalling from chorion progenitors is required for proper differentiation of uncommitted ectoplacental cone cells and later for their specification towards trophoblast giant cells. We also find biphasic regulation by BMP4 in the embryo. The early ExE-originating BMP4 signal is necessary for proper mesoendoderm bifurcation and for allantois and primordial germ cell specification. However, commencing at embryonic day 7.5, embryo-derived BMP4 restricts the primordial germ cell pool size by favouring differentiation of their extraembryonic mesoderm precursors towards an allantois fate. ExE and embryonic tissues are therefore entangled in time, space and signalling axes, highlighting the importance of their integrated understanding and modelling in vivo and in vitro.


Conflict of interest statement

M.B.E. is a co-founder, scientific advisory board member, or consultant at TeraCyte, Primordium Labs, Spatial Genomics, and Asymptote Genetic Medicines. J.H.H. is an inventor on patents and patent applications related to ex utero embryogenesis, and a co-founder and chief scientific advisor of Renewal Bio, which has licensed the latter technologies. The other authors declare no competing interests.

Figures

Fig. 1
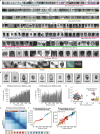
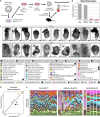
Fig. 1. A unified extraembryonic–embryonic temporal model for gastrulation.
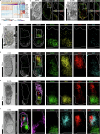
a, Illustration of a mature mouse haemochorial placenta, showing the different subcompartments. SpA-TGC, spiral artery TGC; p-TGC, parietal TGC. b, UMAP (uniform manifold approximation and projection) of all embryonic and extraembryonic endoderm cells (n = 57,555 cells, excluding parietal endoderm). The small points represent single cells coloured by their cell states. The larger points represent metacells, connected through the edges to their most similar neighbours. Biological replicates were sampled over 43 experiments. c, The distribution of cell state composition per embryo (individual bar, n = 251 embryos), with embryos ordered by their transcriptional age and binned into 16 age groups annotated below by the mean estimated time (Et) of each age bin. d, UMAP of the ExE transcriptional manifold (n = 8,625 cells). e, The relative expression of cell-state-specific marker genes (log2[fold change] relative to the overall metacell average, negative values are not shown). Within each cell type, metacells are ordered by Et (early to late; top to bottom). f, UMAPs of ExE cells (coloured points) over the entire ExE manifold (light grey points) corresponding to six age groups and their morphological illustration (top). A, anterior; D, distal; P, posterior; Pr, proximal. Source Data
Fig. 2
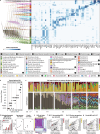
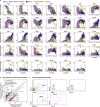
Fig. 2. Differentiation dynamics in the ExE lineages.
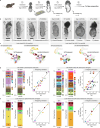
a, Aggregated single-cell expression of SpT-Gly cell-enriched genes (n = 98 genes; SpT-Gly score, y axis) over TGC-progenitor-enriched genes (n = 130 genes; TGC progenitor score, x axis) for all cells from the EPC lineage (light grey points), shown separately for a series of six time bins with 0.5 Et intervals. Cells are coloured by their cell state. The top part of each panel shows the distribution of cells along the principal curve interpolating between TGC progenitors, uncommitted EPC and SpT-Gly cells (Methods and Extended Data Fig. 3b). The horizontal line (top) and diagonal line (bottom) intersects the principal curve at its midpoint; the slope of the diagonal was set at 1 for visualization purposes. b, Gene expression (log2[absolute expression]) of lineage-characteristic genes along the pseudotime trajectory interpolating TGC progenitors and SpT-Gly cells; the black line shows the middle reference point. c, Aggregated single-cell expression of chorion progenitor (prog.) enriched genes (n = 60 genes, chorion progenitor score, y axis) over chorion-enriched genes (n = 41 genes, chorion score, x axis) for all chorion progenitor and chorion cells (light grey points), as presented in a (the chorion lineage trajectory is shown in Extended Data Fig. 4b). d, Gene expression (log2[absolute expression]) of lineage-characteristic genes along the trajectory interpolating chorion progenitors and chorion. e, A suggested model of ExE differentiation dynamics. Epi., epiblast; mTE, mural trophectoderm; pTE, polar trophectoderm. Source Data
Fig. 3
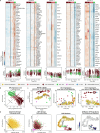
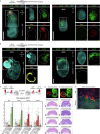
Fig. 3. Spatiotemporal analysis of ExE cell states using combinatorial gene staining.
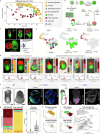
af, Representative images of combinatorial mRNA molecule detection (hybridization chain reaction RNA fluorescence in situ hybridization (HCR–RNA-FISH; Methods; n = 3 (E4.75), n = 2 (E5.0), n = 3 (E5.25), n = 1 (E5.5), n = 1 (E5.75), n = 1 (E6.0), n = 4 (E6.25), n = 4 (E6.5), n = 1 (E7.5)) in a time series of embryos at E4.75 (a), E5.25 (b), E6.0 (c), E6.25 (d), E6.5 (e) and E7.5 (f). The areas indicated by white boxes are magnified on the right. For af, scale bars, 100 µm. The white dashed lines mark the embryo borders. The white solid lines mark the embryonic–ExE border (labelled and oriented with a white double head arrow legend to the right). Embryo axis: anterior (A), proximal (Pr), posterior (P) and distal (D). BF, bright field. In c and d, the distal/anterior visceral endoderm is marked by a solid white bold line in the merged image and Lefty1 channel. In e and f, the primitive streak extension is marked by a solid white bold line in the merged image. g, An illustration summarizing the spatial location of cell state over developmental stages (chorion and chorion progenitors are coloured in yellow).
Fig. 4
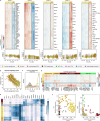
Fig. 4. ExE BMP4 is required for proper EPC differentiation.
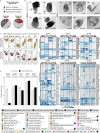
a, Metacell expression of Bmp4 across cell states over time (Et), divided into three phases (dashed lines) with schematics showing the potential spatial distribution. b, The experimental strategy to generate Bmp4 KOs in the germline (left), ExE (middle) and embryonic compartment (right). c, Bright-field images of representative WT (+/+; n = 11 (E7.5), n = 3 (E8.5)), heterozygote (Δ/+; n = 15 (E7.5), n = 12 (E8.5)) and homozygote (Δ/Δ; n = 3 (E7.5), n = 4 (E8.5)) Bmp4-KO genotypes at E7.5 (top) and E8.5 (bottom). All biologically independent samples were examined over six experiments. d, The pooled frequency (log2 scale) of ExE cell types in germline Bmp4-KO mutants over time-matched WT embryos. The solid and dashed lines represent the x = y diagonal and the twofold difference threshold, respectively. e,f, Representative images of multiplexed HCR–RNA-FISH analysis of E5.5 (e) or E6.5 (f) embryos cultured with (n = 4 (E5.5), n = 8 (E6.5)) or without NOG (n = 3 (E5.5), n = 9 (E6.5)) for 24 h. The areas indicated by the white boxes are magnified on the right. The white dashed lines mark embryo; the white double-headed arrow shows the embryonic–ExE borders. g, Histological sections of E12.5 control (left, n = 5) and ExE Bmp4-KO (right, n = 5) placentas stained with haematoxylin and eosin; all from a single litter. The magnification highlights the expansion of the JZ in the ExE Bmp4 KO. DB, decidua basalis; lab., labyrinth. The box plots show the placental dry weight (left) and JZ area size (right); the centre line represents the mean, the box limits indicate the interquartile range (25th to 75th percentile) and the whiskers extend to the minimum and maximum values within 1.5× the interquartile range. Statistical analysis was performed using two-tailed t-tests; *P < 5%; NS, not significant. h, Schematic of the chorion-derived BMP4 effects on EPC differentiation. Scale bars, 1 mm (g) and 100 μm (c, e and f). Source Data
Fig. 5
Fig. 5. Temporal effects of chorionic and ExM-derived BMP4 on embryonic development.
a, Representative images of embryonic Bmp4-KO mutants (n = 18) and controls (n = 6). All biologically independent samples were examined over ten experiments. KO 18 (bottom right) indicates knockout mutant number 18. Scale bars, 100 µm. b, Bmp4 expression (log2) per cell state between mutant and time-matched WT embryos. The solid and dotted lines represent the x = y diagonal and the twofold difference threshold, respectively. c,d, Frequency comparison of endoderm lineage and erythroid (c) and allantois and PGC (d) cell types per embryo in the Bmp4-KO models. Each dot represents an embryo, coloured by genotype. Median frequencies were compared using Wilcoxon rank-sum tests. Low-frequency PGCs P values were calculated using two-tailed χ2 tests (Methods), and were adjusted using the Benjamini–Hochberg procedure. *q < 5%. e, 3D images of immunostained control (top, n = 3) and LDN-treated (bottom, n = 3) embryos dissected at E7.5 and cultured for 12 h. All biologically independent samples were examined over two independent experiments. SOX2 (green) and DAPI (white) are shown. The area indicated by a white box is magnified on the right. Embryo borders are marked by white dashed lines. Images at dissection (top left) and after culture (bottom left) are shown. The dashed lines indicate borders of allantois (Al), head fold (Hf) and embryo. Scale bars, 100 µm. f,g, The single-cell distribution of different PGC groups over PGC score (f; Methods) and cell cycle score (g; Methods). h, The relative metacell expression of selected cell types, highlighting mutual expression with ExM PGC precursors. i, WT single-cell PGC score over time (Et). j, Simplified schematics of the WT PGC differentiation model depicting changes in cell type frequency observed for WT (top), germline Bmp4 KO (middle) and embryonic Bmp4 KO (bottom). ExE-BMP4 (top left) and ExM-BMP4 (top right) indicate the source of BMP4 (separated by dashed vertical lines). The diagram is coloured and annotated on the basis of cell state. Normal differentiation is indicated by the narrow black arrows. The light grey arrows indicate a failure to differentiate. Increase in cell type proportion is shown by bold arrows. The dashed arrows show previously established PGC differentiation dynamics. Source Data
Extended Data Fig. 1
Extended Data Fig. 1. A single-embryo, single cell atlas of mouse gastrulation.
a, Bright-field images of all embryos from E5.5-E8.5 used to construct the ExE-Embryo atlas (Nembryos = 251) ordered by their morphological rank, annotated by their dissected age (top, E#) and morphological stage (TS#; Theiler stages, bottom). Scale bar 100 µm. b, Bright-field images of two batches of flushed E4.5 blastocysts used for differential expression (Fig. 1g). Data represents 11 biologically independent samples over two experiments. Scale bar 100 µm. c, Embryonic (left) and ExE (right) cell count per embryo over each embryo’s transcriptional rank (p < 0.001, Wilcoxon rank test). d, Metacell gene-gene expression (log2 absolute expression) of Col4a1 over Rhox5 showing transcriptional separation of ExE from embryonic and extraembryonic endoderm cell states. e, Embryo-embryo transcriptional similarity matrix, embryos are annotated based on embryonic age groups (see legend below, same as in Fig. 1c). f, Developmental time (Et, left) and morphological rank (right) over embryo rank, annotated by age group. Source Data
Extended Data Fig. 2
Extended Data Fig. 2. A unified extraembryonic/embryonic time-resolved model for gastrulation.
a, Embryonic network flow model of differentiation (left). The model consists of metacells (nodes in rows, corresponding to the 16 embryonic age groups in Fig. 1c) distributed over Et (x axis), and flows (edges) linking metacells between adjacent age groups. The first time point represents an artificial common source for all metacells. Right, Marker heatmap of relative expression (log2 scale, negative values are not shown) with representative feature genes for each cell state. See colour legend below. b, Morphological stage of individual embryos (black dots) over embryo rank, black lines represent ExE age group borders (n = 6). c, ExE (top) and embryonic (bottom) cell-state frequencies for individual embryos [Nembryos = 83] ordered by their transcriptional rank and binned into six ExE age groups. Each age group is annotated by its mean age (Et, bottom). d, Estimated (grey) and sampled (red) number of ExE cells per age group (left panel, see Methods), each age group is annotated by its mean age (Et, bottom). Estimated developmental time (Et) over ExE age groups (middle panel) and number of cells per ExE age group (right panel). e Metacell-metacell distance matrix across ExE metacells. Shown is logistic distance between absolute expression profiles of feature genes (558 genes). f-g, Differential gene expression between E4.5 polar trophectoderm (pTE) cells, isolated from a pool of 11 blastocysts (pTE enriched genes marked with black points) and the two earliest (mean Et = 5.7) metacell populations of the ExE; Uncommitted EPC (left, EPC marker genes highlighted in light red) and chorion progenitors (right, chorion progenitor marker genes highlighted in yellow). Source Data
Extended Data Fig. 3
Extended Data Fig. 3. Differentiation dynamics of uncommitted EPC cells.
a, Heatmaps of k-means clusters (k = 5) depicting relative expression (log2 fold change) of variable genes over EPC lineage metacells (top). Within each cell type, metacells are ordered by Et (early-to-late; left-to-right). Aggregated single-cell expression from all genes per cluster (log2 absolute expression) over Et (bottom). b, Principle curve (bold solid grey line) fitted to the joint distribution of single-cell SpT-Gly and TGC progenitor scores, and parameterized by values from −1 (high SpT-Gly score) to 1 (high TGC progenitor score). Intersection of the black line with the curve marks the midpoint on the curve. c, ExE metacell expression (log2 absolute expression) of Hand1 vs. Ascl2 (left), Dlx3 over transcriptional time (Et, middle) and Eomes over transcriptional time (Et, left). d, Cell-cycle analysis of ExE cellular states. Aggregated expression from mitosis-related genes (M-phase score, Methods) over DNA-synthesis-related genes (S-phase score) in the chorion lineage (far- Black rectangle; solid black line represents a threshold, with cells that fall below it classified as slowly cycling cells. For comparison, annotated ExE UMAP (right) and the Metacell fraction of slowly cycling cells (far-right), with single cells (small points) coloured by their cell cycle activity (black – slowly cycling cells, grey – actively cycling cells). Source Data
Extended Data Fig. 4
Extended Data Fig. 4. Differentiation dynamics of chorion progenitor cells.
a, Heatmaps of k-means clusters (k = 5) of relative expression (log2 fold change) of variable genes over chorion lineage metacells (top). Within each cell type metacells are ordered by Et (early-to-late; left-to-right). Aggregated single-cell expression from all genes per cluster (log2 absolute expression) over Et (bottom). b, Principle curve (bold solid grey line) fitted to the joint distribution of single-cell chorion progenitor and chorion scores, parameterized by values from 0 (high chorion progenitors score) to 1 (high chorion score). c, Time distribution of ExE cell types. d, Heatmap showing ExE metacell expression (log2 fold change) over cell state markers associated with TGC progenitor, SpT-Gly, chorion progenitor, and chorion. Black rectangle highlighting intermediate chorion metacells. e, Heatmap of ExE metacell expression (log2 absolute expression) over a set of highly expressed transcription factors (TFs), with intermediate chorion metacells (black rectangle) displaying a unique combination of expressed TFs. f, ExE metacell gene-gene expression (log2 absolute expression) of Id1-Esrrb (left) and Dlx3-Fosl1 (right). Source Data
Extended Data Fig. 5
Extended Data Fig. 5. Spatiotemporal distribution of marker genes during ExE differentiation.
a, Heatmap showing relative expression of cell state markers among ExE metacells (see legend at the top). Within each cell type metacells are ordered by Et (early-to-late; left-to-right). b-f, Representative images of combinatorial HCR-RNA-FISH marker staining in embryos from E4.75 (a, N = 3), E5.0 (b, N = 2), E5.5 (c, N = 1), E6.25 (d, N = 4), and E6.5 (e, N = 4). All biologically independent samples over three experiments. Magnified regions are highlighted with a white solid line rectangle in the merged images. White dashed lines mark the embryo borders and the Embryonic-ExE border (oriented with a white double-head arrow). In panels b-d, the distal/anterior visceral endoderm is marked by a solid white bold line in the merged image and Lefty1 channel. Embryo axes; Anterior (A), Proximal (Pr), Posterior (P) and Distal (D). Bright field; BF. Source Data
Extended Data Fig. 6
Extended Data Fig. 6. Single-cell analysis of ExE specification in ex utero cultured embryos.
a, Scheme describing the experimental design for evaluating the transcriptome profile of ex utero cultured embryos. b, Representative bright-field images of embryos during ex utero culture (left, N = 12) and WT embryos (right, N = 12) at four different time points. All biologically independent samples over two experiments. PS – pre-streak; ES – Early streak; MS – Mid streak. Embryo axes; Anterior (A), Proximal (Pr), Posterior (P), and Distal (D). Scale bar 100 µm. c, Single-cell atlas projection of cells from ex utero embryos (right) and time-matched WT embryos (left). Shown are projections for late streak stage (left panel) and late head fold stage (right panel) for each group. Cells are coloured according to their projected cell state. See legend in Extended Data Fig. 2. d-e, pooled embryonic (d) and ExE (e) cell-state frequencies of time-matched WT embryos (left bars) and ex utero embryos (right bars) at the late streak (LS, left panel) and late head fold (LHF, right panel) stages. The left side of each panel displays the pooled frequency (in log2 scale) of cell types in ex utero embryos compared to time-matched WT embryos. The solid and dashed lines represent the x = y diagonal and a two-fold difference threshold, respectively. A numerical annotation indicates cell types that differ by more than two-fold. Source Data
Extended Data Fig. 7
Extended Data Fig. 7. Analysing effects of ExE-specific targeting of Elf5.
a, WT gene expression of Elf5 among ExE metacells over transcriptional time (Et). b, Scheme describing the experimental design for exclusive ExE targeting. c, Dissected Cas9-GFP post-implantation embryos at four developmental stages, ExE (white dashed line) transduced with a gRNA-GFP with constitutively expressed mCherry. A representative FACS scatter plot obtained from an E7.5 dissected embryo subjected to lentiviral infection prior to implantation. Embryo axes; Anterior (A), Proximal (Pr), Posterior (Po) and Distal (D). d, UMAP projection of an E8.0 embryo (single cells coloured by cell state) subjected to lentiviral infection over the WT ExE and embryonic manifolds (grey points). Shown are projections of single cells expressing GFP (green points, middle) and single cells expressing mCherry (red points, right) from the same embryo (left). e, Images of analysed control embryos (left panel, Methods, N = 3) and ExE-specific Elf5-KO mutants (right panel, N = 4, infected with gRNAs targeting Elf5). Embryonic (left) and ExE (right) cell-state composition are shown per embryo, together with mCherry distribution as measured by FACS (bottom). f, Representative images of control embryos (left, N = 2) and ExE-specific Elf5-KO mutants (right, N = 2) dissected at E7.5. Bright-field (BF, left panel). Representative maximum intensity projection immunofluorescence images, labelling either SOX2 (green, centre) or Brachyury (T, magenta, right) together with DAPI nuclear staining (blue/white in centre and right, accordingly). Scale bar 100 µm; Illustration depicts typical spatial distribution of SOX2 and T in an E7.5 embryo (middle). ExE compartment is marked with a white, dashed line. g, Pooled ExE cell-state composition (left panel) for ExE Elf5-KO (left) and time matched WT embryos (right). Boxplot shows the pooled frequency of the chorion among ExE cells in ExE-specific Elf5-KO and time match WT embryos. Centre represents mean. Box bounds indicate the IQR (25th to 75th percentile). Whiskers extend to the minimum and maximum values within 1.5 times the IQR. All the data represents biologically independent samples examined over 5 independent experiments. Each dot represents an individual embryo coloured based on its genotype (as indicated). Wilcoxon rank sum test. (*) - P(t-test) <5%; ns – non significant. h-i, Single-cell lineage scores shown for WT (top) and Elf5-KO cells (bottom) from the chorionic lineage (h) or EPC lineage (i, left panel). Cells are coloured according to their cell state, with background WT cells coloured in light grey (bottom). Bulk differential gene expression between uncommitted EPC cells from Elf5-KO and WT embryos (right panel). Dashed line represent a two-fold difference in expression; solid line represents the x = y diagonal; blue dots – genes showing at least two-fold upregulation in KO; red dots – genes displaying at least two-fold downregulation in Elf5-KO. Black dots – marker genes of EPC lineage. Grey dots – all other genes. Source Data
Extended Data Fig. 8
Extended Data Fig. 8. Germline Bmp4-KO statistics and signalling environment over time.
a, Pie charts of PCR-validated genotypes obtained from crosses of Bmp4(Δ/+) heterozygotes (see Fig. 4b), demonstrating expected Mendelian ratios in E7.5 (top) and E8.5 (bottom). b, Bright-field images of analysed control (WT or heterozygous, see Methods) and germline Bmp4-KO mutants from E7.5 (top) and E8.5 (bottom). Embryo axes; Anterior (A), Posterior (P), Proximal (Pr), Distal (D), Dorsal (Do), and Ventral (V). Scale bar 100 µm. c, Metacell expression (log2) over Et of selected BMP-related signalling genes in chorion-lineage (top) and EPC-lineage (bottom). Grey points represent all ExE metacells. d, Heatmap showing pooled cell type absolute expression (log2) of signalling effectors (top section, associated with TGF-beta, Fibroblast/Epithelial growth factors, WNT, and BMP principal signal transducers) and receptors (bottom section). Each heatmap represents one of the six distinct age-groups, with the average Et for each bin specified in the title. Cell states coloured by their cell state. Lineage relationships of cell states annotated at top as one of seven lineages (see legend below). e, Bulk cell type expression (log2) of BMP/WNT signalling effectors in germline Bmp4-KO and time-matched WT embryos. Source Data
Extended Data Fig. 9
Extended Data Fig. 9. Effects of chorion-derived Bmp4 on ExE differentiation.
a-b, Representative images of multiplexed HCR-RNA-FISH analysed control embryo (left panel, -NOG) and Noggin treated embryo (right panel, +NOG) after 24 h cultured ex-utero of embryos dissected at E5.5 (a) and E6.5 (b). Labelling either Chsy1 (red), Ascl2 (green) or Adm (yellow) together with DAPI nuclear staining (blue). Magnified regions (right part in each panel) are highlighted with a white solid line rectangle in left part. Scale bar 100 µm. White, dashed lines mark the embryo borders and Embryonic-ExE border (labelled and oriented with a white double head arrow legend to the right). Embryo axes; Anterior (A), Proximal (Pr), Posterior (P), and Distal (D). c, Schematic representation of ExE explant experiment (Methods, top). Relative expression of bulk RNA from E6.5 and E7.5 ExE explants for selected EPC lineage transcription factors in control (E6.5, N = 6: light-grey, E7.5, N = 2: dark-grey) and treated with Noggin (E6.5, N = 4: light-red and E7.5, N = 3: dark-red) or BMP4 (E6.5, N = 3: light-green and E7.5, N = 3: dark-green) explants. All biologically independent samples examined over 2 independent experiments. (*) – q(t-test) <5%; (**) – q(t-test) <1%; ns – non significant, two-tailed. d, E12.5 dissected Cas9-GFP embryos (top) infected with mCherry-expressing control vector (Methods, left) or with gRNA against Bmp4 (Methods, right). Representative histological sections of E12.5 control (left panel) and ExE Bmp4-KO (right panel) placentas, stained with Hematoxylin and Eosin (bottom). Black solid line highlights the placental junctional zone region. Scale bar 1 mm. e, Embryo-ExE junction magnification of E6.5 dissected Cas9-GFP (green) embryo infected with mCherry-expressing control vector (red) and DAPI nuclear staining (blue), highlighting a mosaic infection. White, dashed line marks the Embryo-ExE border (labelled and oriented to the left). Scale bar 100 µm. Source Data
Extended Data Fig. 10
Extended Data Fig. 10. Effects of ExE or embryonic-derived Bmp4 ablation on ExE and embryonic cell specification.
a, An extended schematic representation of the experimental design used to generate embryonic Bmp4-KO mutants. Derived mES cells used in this experiment were obtained by crossing homozygous Bmp4 LoxP/LoxP embryos, which were also utilized for the germline Bmp4-KO. Followed by HTNC treatment (see Methods). b, Real-time PCR analysis showing fold change (ΔΔCt) in Bmp4 expression between the two Bmp4 Δ/Δ clones (red) and one Bmp4 Δ/+ clone (grey, Isogenic control) used in this study, compared to WT (grey). c, Bright-field images of analysed control (injected with Isogenic control mES cells, see Methods) and embryonic Bmp4-KO mutants from E7.5 (top) and E8.5 (bottom). Embryo axes; Anterior (A), Proximal (Pr), Posterior (P), and Distal (D). Scale bar 100 µm. d, Pooled frequency (in log2 scale) of ExE cell types in embryonic Bmp-KO mutants over time-matched WT embryos. Solid and dashed lines represent x = y diagonal and two-fold difference threshold, accordingly. e, Embryo-proper cell type composition (see colour annotation in legend, top) of individual germline Bmp4-KO mutants (N = 5, right), embryonic Bmp4-KO mutants (N = 18, middle) and time-matched WT embryos (N = 39, left). Source Data
Extended Data Fig. 11
Extended Data Fig. 11. Effects of ExE or embryonic-derived Bmp4 ablation on endoderm specification.
Representative images of multiplexed HCR-RNA-FISH analysed control embryo (left side, -NOG, N = 4) and Noggin treated embryo (right side, +NOG, N = 4) after 24 h cultured ex-utero of embryos dissected at E6.5 (schematic representation of experiment in the top). Labelling either Eomes (red), Cer1 (green) or Foxa2 (yellow) together with DAPI nuclear staining (blue). Magnified regions (right part in each panel) are highlighted with a white solid line rectangle in left part. Scale bar 100 µm. White, dashed lines mark the embryo borders and Embryonic-ExE border (labelled and oriented with a white double head arrow legend to the right). Embryo axes; Anterior (A), Proximal (Pr), Posterior (P), and Distal (D).
Extended Data Fig. 12
Extended Data Fig. 12. Embryo-derived BMP4 regulates PGC and allantois competing lineage choices.
a, Pooled frequency (in log2 scale) of ExM cell type derivatives (annotated) in embryonic Bmp-KO mutants (top) or germline Bmp4-KO (bottom) over time-matched WT embryos. Solid and dashed lines represent x = y diagonal and two-fold difference threshold, accordingly. b, Gene expression per embryo and cell type for selected genes in ExM (left part) and Allantois (right part). Each dot represents an individual embryo, with WT embryos in small light grey and embryonic Bmp4-KO mutants in big dark grey. Solid black line – WT average expression; grey area – WT average ± moving standard deviation (window size = 13). Initiation of mesoderm Bmp4 expression marked by dashed line in each ExM expression panel. c, Heatmap showing fold change (log2 scale) between pooled cell type expression of embryonic Bmp4-KO mutants (left) and isogenic control (right), relative to time matched WT (see Methods). Within each cell type individual embryos are ordered by Et (early-to-late; left-to-right). d, 3D images of immunostained control (top, N = 3) and LDN treated (bottom, N = 3) dissected at E7.5 and cultured for 12 h. AP2C (green) labelling shown with DAPI (white). Magnified region outlined in left panel. Embryo borders marked by white dashed lines. Images at dissection (top left) and after culture (bottom left). Dashed lines indicate the borders of Allantois (Al); head fold (Hf) and embryo. Axes: Anterior (A), Proximal (Pr), Posterior (P), Distal (D). Scale = 100 µm. Embryo positioned from distal-to-proximal view (left) and proximal-to-distal view (right). e, Representative images of ∆PE Oct4-GFP reporter embryos at four different developmental stages (dissection day annotated). scale bar 100 µm. Data represents 58 biologically independent samples over seven experiments. f, Differential expression between embryonic Bmp4-KO and WT PGCs, stratified by their overall PGC marker expression (see Methods). Solid and dashed lines represent x = y diagonal and two-fold difference threshold, accordingly. Gene trends annotated in legend. Source Data
Extended Data Fig. 13
Extended Data Fig. 13. Expression dynamics along the PGC trajectory.
a, Metacell expression (log2 absolute expression) over transcriptional time (Et) for all genes in Fig. 5h. b, Pooled differential gene expression between PGC precursor cells from WT and embryonic Bmp4-KO mutants. Dashed line represents a two-fold difference in expression; solid line represents the x = y diagonal; blue/red dots – genes showing at least two-fold upregulation/downregulation in KO (respectively). Black dots – PGC marker genes. Light grey dots – all other genes. c, FACS gating and sorting strategy for all single-cell data obtained in this study. ‘Gate 3’ highlights the sorted population for atlas construction, ‘Gate 4’ marks the mCherry-positive population for Embryonic Bmp4-KO data, and ‘Gate 5’ identifies the ΔPE-Oct4-GFP cell population. Source Data

References

    1. Rai, A. & Cross, J. C. Development of the hemochorial maternal vascular spaces in the placenta through endothelial and vasculogenic mimicry. Dev. Biol.387, 131–141 (2014). - PubMed
    1. Rossant, J. & Tam, P. P. Blastocyst lineage formation, early embryonic asymmetries and axis patterning in the mouse. Development136, 701–713 (2009). - PubMed
    1. Marsh, B. & Blelloch, R. Single nuclei RNA-seq of mouse placental labyrinth development. eLife9, e60266 (2020). - PMC - PubMed
    1. Simmons, D. G. & Cross, J. C. Determinants of trophoblast lineage and cell subtype specification in the mouse placenta. Dev. Biol.284, 12–24 (2005). - PubMed
    1. Arnold, S. J. & Robertson, E. J. Making a commitment: cell lineage allocation and axis patterning in the early mouse embryo. Nat. Rev. Mol. Cell Biol.10, 91–103 (2009). - PubMed

MeSH terms

Substances