. 2024 Sep;633(8031):878-886.
doi: 10.1038/s41586-024-07960-6. Epub 2024 Sep 18.

Commensal consortia decolonize Enterobacteriaceae via ecological control

Affiliations

Commensal consortia decolonize Enterobacteriaceae via ecological control

Munehiro Furuichi et al. Nature. 2024 Sep.

Abstract

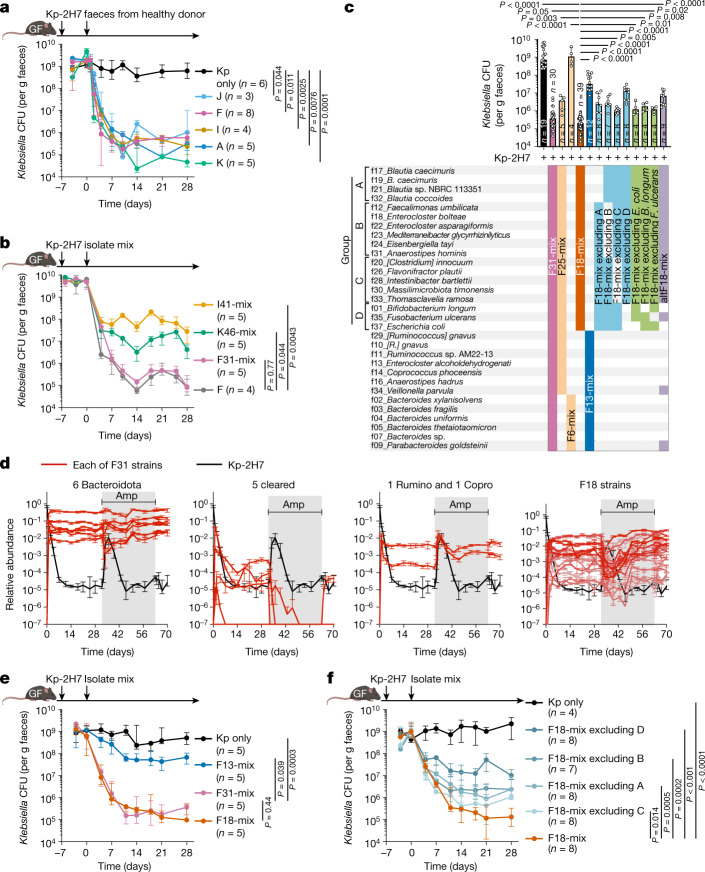
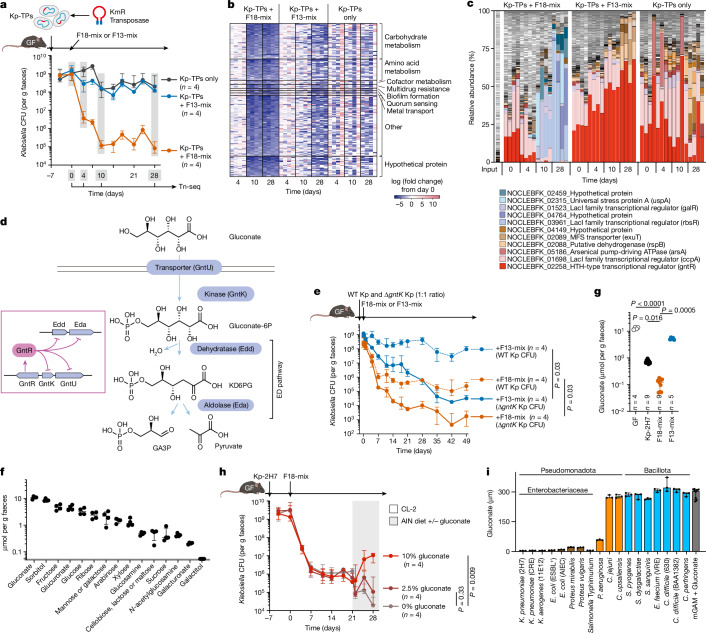
Persistent colonization and outgrowth of potentially pathogenic organisms in the intestine can result from long-term antibiotic use or inflammatory conditions, and may perpetuate dysregulated immunity and tissue damage1,2. Gram-negative Enterobacteriaceae gut pathobionts are particularly recalcitrant to conventional antibiotic treatment3,4, although an emerging body of evidence suggests that manipulation of the commensal microbiota may be a practical alternative therapeutic strategy5-7. Here we isolated and down-selected commensal bacterial consortia from stool samples from healthy humans that could strongly and specifically suppress intestinal Enterobacteriaceae. One of the elaborated consortia, comprising 18 commensal strains, effectively controlled ecological niches by regulating gluconate availability, thereby re-establishing colonization resistance and alleviating Klebsiella- and Escherichia-driven intestinal inflammation in mice. Harnessing these activities in the form of live bacterial therapies may represent a promising solution to combat the growing threat of proinflammatory, antimicrobial-resistant Enterobacteriaceae infection.


Conflict of interest statement

K.H. is a scientific advisory board member of Vedanta Biosciences and 4BIO CAPITAL. R.J.X. is co-founder of Jnana Therapeutics and Celsius Therapeutics, scientific advisory board member at Nestlé, and board director at MoonLake Immunotherapeutics. Y.A., M.U., K. Amafuji and Y.K. are employees of JSR corporation. J.M.N. and B.O. are employees of Vedanta Biosciences. S.C. was an employee of Vedanta Biosciences at the time of her contributions. D.R.P. is currently an employee of Novonesis. K.H., M.F., N.H., S.S., K. Atarashi, T.O. and Y.A. have filed international patent application PCT/JP2024/008014. The other authors declare no competing interests.

Figures

Fig. 1
Fig. 1. Elaboration of an 18-strain-consortium capable of decolonizing Klebsiella.
ac,e,f, GF B6 mice were monocolonized with Kp-2H7, followed by oral administration of stool samples from one of five healthy human donors (A, F, I, J or K) (a) or the indicated mixture of bacterial isolates (b,c,e,f). Faecal CFUs of Kp-2H7 throughout the experiment (a,b,e,f) or on day 28 (c). d, GF mice (n = 5) were monocolonized with Kp-2H7 (day −7), treated with F31-mix (day 0) and then given ampicillin (200 mg l−1) via drinking water (days 32 to 63). The abundance of each of the 31 strains was determined by quantitative PCR (qPCR) in two technical replicates and average data are shown. Rumino, Ruminococcus; Copro, Coprococcus. See also Extended Data Fig. 2. Data in ac,e,f are median ± interquartile range (IQR) of representative data from two independent experiments with similar results. The day 28 data are compared by Kruskal–Wallis test using the Benjamini–Hochberg correction for multiple comparisons. Source Data
Fig. 2
Fig. 2. F18-mix controls intestinal pathogens and colitis.
a, GF B6 mice (n = 3–10 per group) were monocolonized with the indicated pathogenic or antibiotic-resistant strain, and then treated with the indicated bacterial mixture. Faecal pathobiont load was examined by counting CFUs or by qPCR of bacterial DNA (for C. difficile). b,c, GF B6 mice were colonized with faecal microbiota from a patient with Crohn’s disease (CD15) containing a high level of K. pneumoniae (b) or from a patient with ulcerative colitis (UC5) containing ESBL+ E. coli (c). All mice were subsequently treated with vancomycin (VCM), and half of the mice received oral F18-mix administration four times over the next two days. Full-length 16S rRNA gene sequencing was performed on faecal samples to determine the relative abundance of detected strains. df, GF Il10−/− mice (n = 6 per group) were colonized with UC5 microbiota and then treated with F18-mix, F13-mix or vehicle control; faecal CFUs of ESBL+ E. coli throughout the experiment (d), representative haematoxylin and eosin staining of the colon on day 28 (e; scale bars, 200 μm) and histological colitis scores on day 28 (f) are shown. Data in a,d,f, are median ± IQR and are compared by Kruskal–Wallis test using the Benjamini–Hochberg correction for multiple comparisons. Source Data
Fig. 3
Fig. 3. F18-mix competes with Kp-2H7 for gluconate.
a, Random insertion mutagenesis using the Tn5-based transposon yielded 8 × 105 kanamycin-resistant (KmR) Kp-2H7 mutants (Kp-TPs). Kp-TPs were pooled and administered to GF B6 mice, followed by oral administration of F18-mix or F13-mix. Faecal samples were collected and sequenced on days 0, 4, 10 and 28 to determine CFUs. b, Heat map shows 194 Kp-2H7 genes that were significantly down-regulated by F18-mix administration. c, Relative abundance of Kp-TP mutants in each mouse (four mice per group). Mutants representing more than 15% of the total reads in any sample are noted in the legend. d, Gluconate metabolic pathway in K. pneumoniae. GntR suppresses expression of genes encoding gluconate transporter (gntU), gluconate kinase (gntK) and Entner–Doudoroff (ED) pathway enzymes (edd and eda). e, GF mice were colonized with a 1:1 mixture of wild-type (WT) and ΔgntK Kp-2H7, followed by oral administration of F18-mix or F13-mix. Faecal Kp-2H7 CFUs are shown, representative of two independent experiments. f, LC–MS/MS analysis of the indicated carbon source in faeces of GF mice (n = 4) fed a nutrient-rich (CL-2) diet. g, Faecal gluconate levels in GF mice or GF mice colonized with Kp-2H7, F18-mix or F13-mix. h, GF mice were colonized with Kp-2H7, followed by oral administration of F18-mix. On day 21, the diet was switched from CL-2 to a gluconate-deficient (AIN93G) diet supplemented with 0%, 2.5% or 10% gluconate. Faecal Kp-2H7 CFUs are shown, representative of two independent experiments. i, Pathogenic strains were incubated with 300 μM gluconate for 48 h (n = 3 biological replicates). Gluconate concentration in the culture supernatant was measured by LC–MS/MS. Data in a,ei, are median ± IQR, and are compared by Kruskal–Wallis test using the Benjamini–Hochberg correction for multiple comparisons (g,h) or by two-sided Mann–Whitney U test (e). Source Data
Fig. 4
Fig. 4. Association between strains carrying gluconate pathway genes and IBD.
a, Left, in vitro gluconate consumption capacity of each of the F18 strains (n = 3 biological replicates; median ± IQR). Right, genome neighbourhood of putative gluconate metabolism genes identified in the F18 strains. Asterisk indicates a non-functional frameshift mutation. b, GF B6 mice were monocolonized with Kp-2H7 and treated with F8-mix or F18-mix. Faecal Kp-2H7 CFUs are shown as median ± IQR; representative of two independent experiments. The day 28 data were compared by two-sided Mann–Whitney U test. c, Classical and alternative gluconate metabolism pathways typically found in Klebsiella and Blautia species. d, Iterative comparative species abundance analysis between paediatric ulcerative colitis (UC) samples with moderate or severe (n = 57) or mild (n = 64) versus inactive (n = 119) disease. Dots and line segments represent r effect sizes and confidence intervals obtained by bootstrapping. Species were grouped on the basis of gluconate-related gene combinations in MSP bins. e, MSP prevalence across the cohort (n = 240). Taxa without species annotation and reference genome remain classed as MSP. f,g, A mixed-effects model quantified the relationship between species abundance and gluconate, controlling for calprotectin and subject in PROTECT (n = 84). f, Cumulative t-values (coefficients adjusted for standard error) demonstrate predominantly positive associations between gluconate abundance and Enterobacteriaceae. g, Circles indicate MSPs with gluconate genes. Plus signs represent associations between species and gluconate with Benjamini–Hochberg adjusted P values < 0.05. The effect size r was computed with confidence intervals from bootstrapping. In box plots, the centre line is the median, the box delineates the IQR and whiskers extend to 1.5× IQR. Source Data
Extended Data Fig. 1
Extended Data Fig. 1. Isolation of bacterial strains from healthy human gut microbiota that are capable of decolonizing Klebsiella pneumoniae.
a, Schematic representation of the strategy for isolating Klebsiella-decolonizing commensals from healthy human gut microbiota. Faeces from donors F, I, and K were cultured anaerobically on various types of agar with different growth media, including EG, mGAM, BHK, CM0151, MRS, and BL. A total of 192, 288, and 480 bacterial colonies were picked and sequenced from donors F, I, and K microbiota, respectively. From these, 31, 41, and 46 strains were identified from donors F, I, and K, respectively, and subjected to gnotobiotic screening. The 31 strains derived from donor F were further evaluated until a minimal effector consortium of 18 strains, referred to as F18-mix, was identified. b, Microbiome compositions of faeces from healthy human donors were determined by PacBio-based full-length 16S rRNA gene sequencing. Dark to light yellows represent the sets of amplicon sequence variants (ASVs) corresponding to the 31 strains from donor F, 41 strains from donor I, and 46 strains from donor K that account for 91%, 48%, and 29% of the total sequences, respectively. Source Data
Extended Data Fig. 2
Extended Data Fig. 2. Selection of F18 members based on differential response to ampicillin treatment.
a, GF B6 mice (n = 5) monocolonized with Kp-2H7 were orally administered F31-mix. Ampicillin (200 mg/L) was added to the drinking water from day 32 to 63. Faeces were collected longitudinally and relative abundance of Kp-2H7 and each member of the F31 consortium was determined by qPCR using strain-specific primer sets (with the exception of f17 and f19 Blautia caecimuris strains, which could not be distinguished). Average data from two independent experiments are shown. F31 members that exhibited inverse trajectories to Kp-2H7 were thought to be necessary for Kp-2H7 decolonization, whereas those that behaved similarly to or independently of Kp-2H7 were thought to be dispensable. Data are shown as median ± IQR. b, Spearman’s rank correlation coefficient (two-sided) quantifying the association between Kp-2H7 relative abundance and each member of the F31 consortium during ampicillin treatment. Significant negative correlations were found between Kp-2H7 abundance and most of the F18 strains (red). Source Data
Extended Data Fig. 3
Extended Data Fig. 3. Effects of F18-mix on pathogenic and commensal bacteria.
a, b, GF B6 mice were monocolonized with Kp-2H7 and then treated with the indicated bacterial mix including F6 Bacteroidota-mix and F25 non-Bacteroidota-mix (n = 4 per group). Kp-2H7 faecal CFUs were counted over time (a), and full-length 16S rRNA gene sequencing was performed on longitudinally-collected faecal samples from each mouse (b). c, To examine the colonization resistance effect of F18-mix, GF B6 mice were first colonized with either F18-mix or F13-mix and then inoculated with Kp-2H7 on day 7. Kp-2H7 faecal CFUs were counted over time. d, GF B6 mice (n = 4 per group) were monocolonized with Pseudomonas aeruginosa or Campylobacter upsaliensis, followed by oral administration of the indicated bacterial mix. CFUs (P. aeruginosa) or level of bacterial DNA (C. upsaliensis) in longitudinal faecal samples was determined by culture or qPCR. e, f, GF B6 mice were colonized with Kp-2H7 along with 7 commensal strains chosen from our culture collection, then treated with F18-mix. Faecal abundance of each bacterial strain was quantified by qPCR using strain-specific primer sets. The relative abundance (e) and DNA concentration (f) of each strain is shown. g, GF B6 mice (n = 4 per group) were colonized with either I41-mix, K46-mix, or both of these consortia together along with a C. scindens strain (totaling 88 strains), followed by oral inoculation with F18-mix without prior antibiotic treatment. Full-length 16S rRNA gene sequencing was performed on faecal samples. Strains substantially reduced after F18-mix treatment are displayed in purple, including Bifidobacterium, Collinsella, and Megasphaera strains. Data are expressed as median ± IQR, representative of two independent experiments, and compared by Kruskal-Wallis test using the Benjamini-Hochberg correction for multiple comparisons at day 28 compared to F31-mix (a) or F18-mix (c). Source Data
Extended Data Fig. 4
Extended Data Fig. 4. Effects of F18-mix in an IBD model.
a, b, GF B6 mice were colonized with faecal microbiota from either a patient with Crohn’s disease (CD#15) containing a high level of K. pneumoniae (a) or from a patient with ulcerative colitis (UC#5) containing ESBL+ E .coli (b). All mice were subsequently treated with vancomycin, and half received oral F18-mix administration four times over two days. CFUs of K. pneumoniae and E. coli (upper panels) and Shannon index (lower panels) of the faecal microbiota were examined longitudinally and compared by Mann-Whitney U test at day 28 (two-sided). c-g, GF Il10−/− mice were monocolonized with Kp-2H7, then orally administered the indicated bacterial mix seven days later. Representative haematoxylin and eosin staining of the colon (scale bar = 100 μm) (d), histological colitis scores (e), faecal lipocalin-2 and calprotectin levels (f), and frequency of IFNγ+ cells among colonic lamina propria CD4+TCRβ+ T cells (g) are shown. In panels a-c and e-g, median ± IQR are shown, representative of two independent experiments. Statistical analysis was performed using the Kruskal-Wallis test with the Benjamini-Hochberg correction for multiple comparisons. Source Data
Extended Data Fig. 5
Extended Data Fig. 5. F18-mix decolonizes Kp-2H7 by a mechanism independent of the host’s major immune system.
a, b, GF Ifngr1−/− (a), Myd88−/−Ticam1−/−, Rag2−/−Il2rg−/− (b), or wild-type (WT) B6 mice were monocolonized with Kp-2H7, followed by oral administration of F18-mix. Faecal Kp-2H7 CFUs were counted until day 28 post-F18-mix administration. Data are expressed as median ± IQR and compared by Mann-Whitney U test (two-sided) (a) or Kruskal-Wallis using the Benjamini-Hochberg correction for multiple comparisons (b) on samples at day 28. c, Heatmap depicts the expression of genes associated with defence response and peroxisome proliferator-activated receptor γ (PPARγ)-inducible genes in colonic epithelial cells from mice colonized with the indicated bacterial mix. Defence response genes and PPARγ-inducible genes were selected based on gene ontology term. Source Data
Extended Data Fig. 6
Extended Data Fig. 6. Exploration of mechanisms involved in Klebsiella reduction.
a, Kp-2H7 was incubated in vitro under aerobic or anaerobic conditions with caecal suspensions from uncolonized GF mice or GF mice colonized with F31-, F18-, or F13-mix with or without prior heat-inactivation or filtration (0.22 μm). Kp-2H7 CFUs were counted after a 48 hr incubation at 37 °C in n = 3 biological replicates. Data are expressed as median ± IQR. b, GF mice (n = 3-5 per group) were colonized with Kp-2H7 and then treated with the indicated bacterial mix. Strains designated as F18-mix excluding A, B, C, or D are detailed in Fig. 1c. Caecal contents were collected on day 28 and subjected to targeted and non-targeted LC-MS/MS, GC-MS, or LC-QTOF/MS analyses. Heatmap depicts the z-score of each metabolite that showed a correlation with faecal Kp-2H7 CFUs (Pearson’s coefficient −0.6 > r > 0.6). 4-HBA, 4-hydroxybenzoic acid. c, Kp-2H7 was incubated with various chemical compounds at different concentrations in M9 medium under both aerobic and anaerobic conditions at 37 °C. Media supplemented with acetate or butyrate were adjusted to a final pH of 5.0 or 7.0 using NaOH. Bacterial growth was monitored by measuring absorbance at 600 nm every 0.5 hr using a microplate reader. Data are mean ± SEM from n = 3 biological replicates per condition. d, GF B6 mice were colonized with Kp-2H7 and subsequently treated with either F18-mix or F13-mix on day 0. From day 14, tributyrin (5 g/kg body weight) or a vehicle control was administered orally once daily for two weeks. Faecal CFUs of Kp-2H7 were counted through day 28 and are presented as median ± IQR. The day 28 data were compared using the Mann-Whitney U test (two-sided). Source Data
Extended Data Fig. 7
Extended Data Fig. 7. F18-mix suppresses Klebsiella through nutrient competition, rather than by affecting quorum sensing, biofilm formation, stress response, or nitrate respiration.
a, GF B6 mice were colonized with Kp-2H7 (wild-type or the indicated mutant strain), followed by oral administration of F18-mix. Faecal Kp-2H7 CFUs were counted. Data are presented as median ± IQR. The day 28 data were compared using the Mann-Whitney U test (two-sided) or the Kruskal-Wallis test with the Benjamini-Hochberg correction for multiple comparisons. b, c, GF mice were inoculated with either Kp-2H7 alone (n = 3) or Kp-2H7+F18-mix (n = 4). Two days after F18-mix administration, faecal samples were collected and subjected to bacterial RNA extraction and sequencing. KEGG pathway enrichment analysis was performed on Kp-2H7 genes with significantly different expression (q<0.001) between the groups. The number of genes within each pathway (consisting of >10 genes) that were up- or down-regulated in the Kp-2H7+F18-mix group compared to the Kp-2H7 only group are shown in (b). The expression levels of genes involved in carbohydrate metabolism, measured in transcripts per million (TPM), are displayed in (c). d, Expression of gluconate metabolism genes of Kp-2H7 in the faeces of mice colonized with Kp-2H7 only, Kp-2H7+F13-mix, or Kp-2H7+F18-mix was examined by qPCR in two technical replicates. Each dot represents data from an individual mouse. Data are presented as median ± IQR (c, d) and were analysed using the Kruskal-Wallis test with the Benjamini-Hochberg correction for multiple comparisons (d). Source Data
Extended Data Fig. 8
Extended Data Fig. 8. The role of gluconate metabolism genes in Klebsiella growth.
a, Wild-type (WT), ΔgntK, or ΔgntR Kp-2H7 strains were cultured at 37 °C for 48 hr in M9 minimal medium supplemented with the indicated carbohydrate (final concentration: 2mM). Bacterial growth was assessed by measuring absorbance at 600 nm. b, GF mice were inoculated with a 1:1 mixture of WT and ΔgntR Kp-2H7 and then treated with F18-mix or F13-mix. Faecal CFUs of Kp-2H7 were counted over time. Data are presented as median ± IQR, representative of two independent experiments, and were compared using the two-sided Mann-Whitney U test. c, WT, ΔgntK, or ΔgntR Kp-2H7 were cultured at 37 °C in M9 minimal medium supplemented with either glucose or gluconate (n = 3 biological replicates). Bacteria were collected during the early log phase (absorbance at 600 nm = 0.35) and subjected to RNA extraction and sequencing. The expression levels of genes involved in carbohydrate metabolism, expressed in transcripts per million (TPM), are presented as median ± IQR. Source Data
Extended Data Fig. 9
Extended Data Fig. 9. Utilization of gluconate by Kp-2H7 and F18-mix.
a, Gluconate and glucosamine levels in the faeces of GF B6 mice (n = 4 per group) fed either a standard (CL-2) or a defined (AIN93G, gluconate- and glucosamine-free) diet were measured by LC-MS/MS. High levels of gluconate were detected in faeces from GF mice on the CL-2 diet. Substantial levels of faecal gluconate were also found in mice fed the gluconate-deficient AIN93G diet, implying that sources of gut luminal gluconate include both dietary intake and host production. In contrast, faecal glucosamine levels were very low in mice fed the CL-2 diet and became almost undetectable in those on the AIN93G diet, suggesting that glucosamine is primarily derived from dietary sources. Data are presented as median ± IQR, representative of two independent experiments, and were analysed using the two-sided Mann-Whitney U test. b, Faecal carbohydrate levels in GF mice colonized with Kp-2H7 or the indicated bacterial mix (F18-mix, F13-mix, K46-mix, or I41-mix) fed a CL-2 diet were measured using LC-MS/MS (n = 4 per group), and the results are presented as median ± IQR. The data are representative of two independent experiments. c, GF mice on a CL-2 diet were monocolonized with Kp-2H7, and then switched to a defined, gluconate-free AIN93G diet on day 21. Kp-2H7 faecal CFUs are shown as median ± IQR. d, e, GF mice were monocolonized with Kp-2H7 and subsequently inoculated with individual members of F18-mix at 5-day intervals over a total period of 95 days. Faecal CFUs of Kp-2H7 (d) and gluconate levels (e) were measured throughout the study. Data are expressed as median ± IQR. f, Klebsiella CFUs and gluconate levels in the upper and lower intestinal lumen of GF mice colonized with Kp-2H7 or Kp-2H7+F18-mix (n = 4 per group). SI, small intestine. Data are shown as median ± IQR. Source Data
Extended Data Fig. 10
Extended Data Fig. 10. Impact of carbohydrate supplementation on the efficacy of F18-mix-mediated Kp-2H7 suppression.
a, GF B6 mice (n = 4 per group) were monocolonized with Kp-2H7 and then orally administered F18-mix seven days later. On day 21, their diet was switched from the standard CL-2 diet to a defined, gluconate-deficient (but glucose-rich) AIN93G diet supplemented with the indicated carbohydrate at 10% of total calories. Faecal Kp-2H7 CFUs are displayed as median ± IQR, representative of two independent experiments, and were analysed using the Kruskal-Wallis test with the Benjamini-Hochberg correction for multiple comparisons. b, Faecal galactitol levels were measured by LC-MS/MS (n = 4 per group). Faecal galactitol levels were below the detection limit in mice on either the CL-2 or AIN93G diet. However, faecal galactitol was successfully detected in mice fed an AIN93G diet supplemented with 10% galactitol, validating our galactitol detection assay. Data are shown as median ± IQR. Source Data
Extended Data Fig. 11
Extended Data Fig. 11. Carriage of classical and alternative gluconate metabolism genes by commensal strains.
Bacterial strains isolated from donors F, K, or I were cultured in mGAM broth containing 300 μM gluconate for 48 hr at 37 °C (n = 3 biological replicates). Gluconate concentration in the culture supernatant was measured by LC-MS/MS and is depicted in the middle bar graph. Data are shown as median ± IQR. Genomes of cultured strains were sequenced and examined for carriage of genes putatively involved in gluconate metabolism. For classical pathway genes, gluconate kinase (gntK, MKMCEHOJ_02531) and gluconate transporter sequences (MKMCEHOJ_02530, MKMCEHOJ_02505) from the f37_E. coli strain were used as the reference. For alternative pathway genes, gluconate dehydratase (gad, EAOGLLOI_00767), gluconate transporter sequences (EAOGLLOI_00766, EAOGLLOI_00912), 2-dehydro-3-deoxygluconokinase (kdgK, EAOGLLOI_00768), and 2-dehydro-3-deoxyphosphogluconate aldolase (eda, EAOGLLOI_00769) from the f17_Blautia caecimuris strain were used as the reference. Asterisk indicates that the gluconate dehydratase in the f19_Blautia caecimuris strain is nonfunctional due to a frameshift mutation. GntK, gluconate kinase. GAD, gluconate dehydratase. Source Data
Extended Data Fig. 12
Extended Data Fig. 12. Association between disease state and species carrying gluconate kinase operon genes in patients with IBD.
a, Cohort details. For PROTECT (N = 94), analysis was performed iteratively with varied cross-sectional sample selections from mild (n = 64), moderate/severe (n = 57), and non-IBD (n = 119) longitudinal sample pools. For HMP2, samples were selected based on most extreme calprotectin value from a given patient: CD (N = 41), UC (N = 26), and non-IBD (N = 24). N: Number of subjects; n: Number of samples. b, Spearman correlation analysis of faecal calprotectin (in μg/g) versus gluconate mass intensity in a subset of 84 PROTECT samples with varying degrees of UC severity: inactive (n = 33, green), mild (n = 24, yellow), and moderate/severe (n = 27, red). Standard errors of model estimates are highlighted in grey. c, Comparative abundance analysis of MSPs with gluconate genes in HMP2 samples between CD (black, N = 41) or UC (grey, N = 26) vs. non-IBD (N = 24). Dots and extending line segments represent r effect sizes and CIs obtained by bootstrapping. Taxa were categorized by gluconate gene presence and combination in MSP bins. d, MSP prevalence (in %) in the HMP2 cohort (N = 91), as percentage. Taxa without species annotation and reference genome remain ‘msp-’labelled, so gene combinations could not be verified in complete assemblies. e, f, The mixed-effects model quantifies the relationship between species abundance and gluconate in stool samples (n = 223), while controlling for calprotectin and subject ID. Cumulative t-values (model coefficients corrected by standard error) highlight the predominantly positive associations of gluconate with the Enterobacteriaceae clade in HMP2 (e). Circles in (f) indicate MSPs having gluconate metabolism genes, and those with plus marks represent associations between species and gluconate with BH adjusted p-values < 0.05. MSPs with gluconate kinase + transporter genes had stronger gluconate associations than those with only transporter (two-sided Mann-Whitney U, p~0.04) or gluconate dehydratase (p~0.02). The effect size r was computed with CIs from bootstrapping. Boxplots show median (center line) and IQR (box); whiskers extend to 1.5 x IQR. GntK, gluconate kinase. GAD, gluconate dehydratase. Source Data

Update of

References

    1. Winter, S. E., Lopez, C. A. & Baumler, A. J. The dynamics of gut-associated microbial communities during inflammation. EMBO Rep.14, 319–327 (2013). - PMC - PubMed
    1. Caballero, S. & Pamer, E. G. Microbiota-mediated inflammation and antimicrobial defense in the intestine. Annu. Rev. Immunol.33, 227–256 (2015). - PMC - PubMed
    1. Antimicrobial Resistance Collaborators. Global burden of bacterial antimicrobial resistance in 2019: a systematic analysis. Lancet399, 629–655 (2022). - PMC - PubMed
    1. Antibiotic Resistance Threats in the United States, 2019 (Centers for Disease Control and Prevention, 2019); https://www.cdc.gov/drugresistance/pdf/threats-report/2019-ar-threats-re....
    1. Ducarmon, Q. R., Kuijper, E. J. & Olle, B. Opportunities and challenges in development of live biotherapeutic products to fight infections. J. Infect. Dis.223, S283–S289 (2021). - PubMed

MeSH terms

LinkOut - more resources