. 2024 Oct;634(8035):979-985.
doi: 10.1038/s41586-024-07963-3. Epub 2024 Sep 18.

Two-factor authentication underpins the precision of the piRNA pathway

Affiliations

Two-factor authentication underpins the precision of the piRNA pathway

Madeleine Dias Mirandela et al. Nature. 2024 Oct.

Abstract

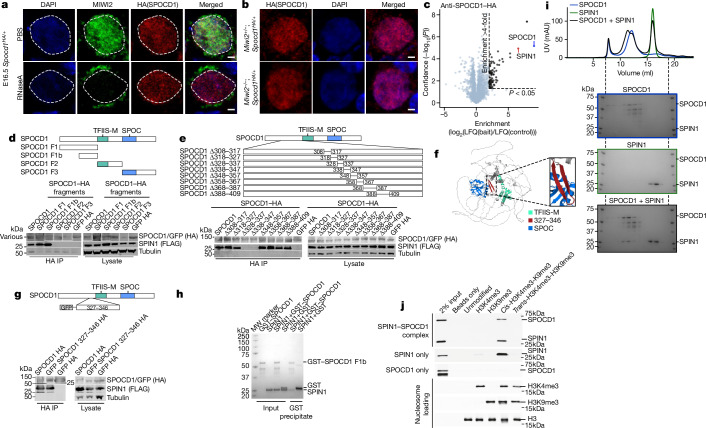
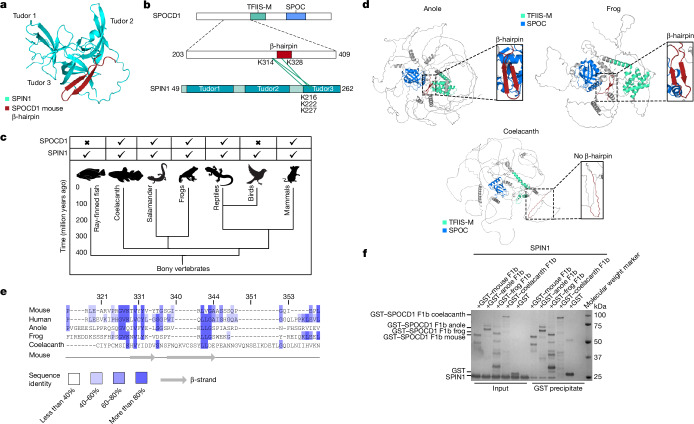
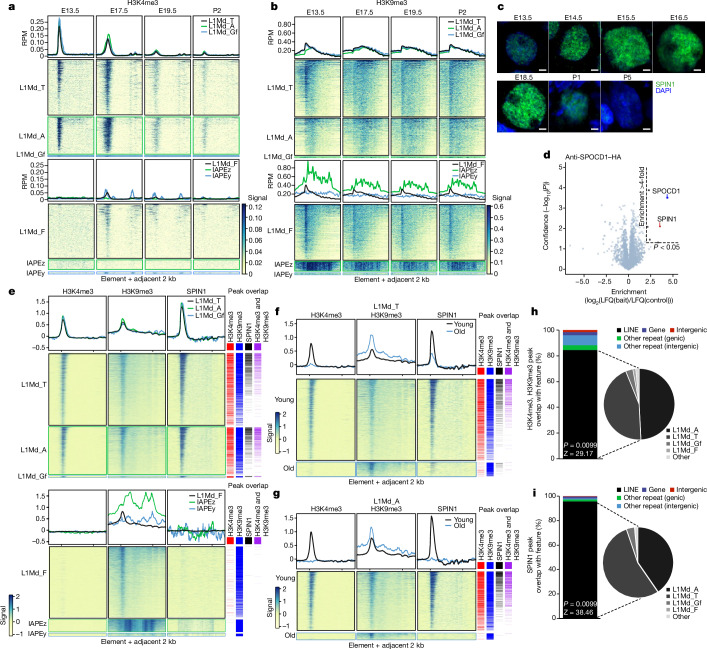
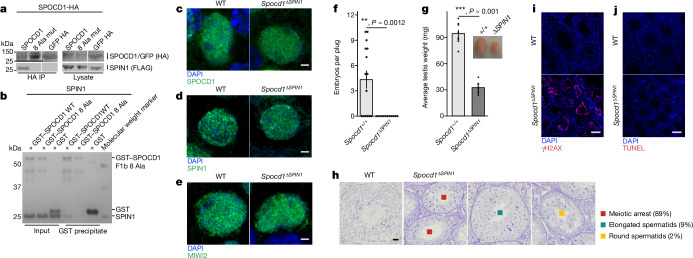
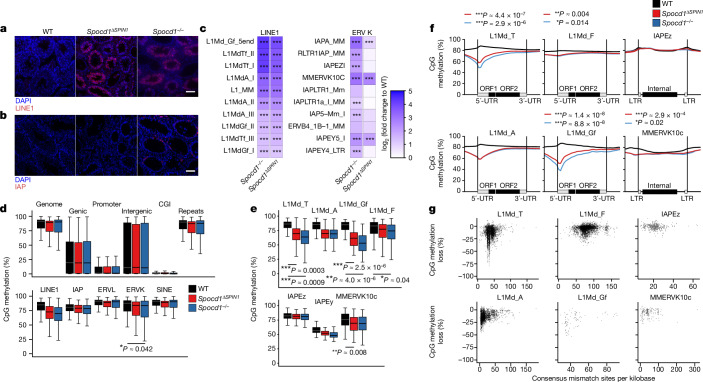
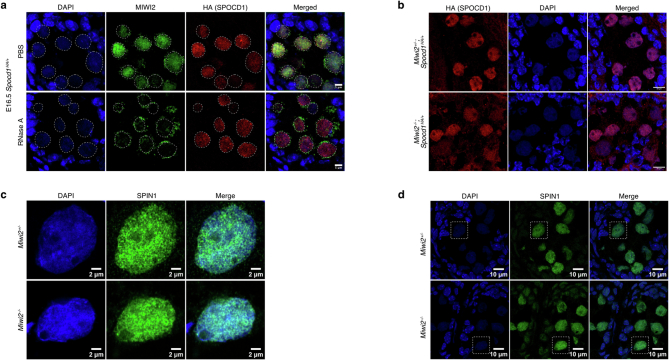
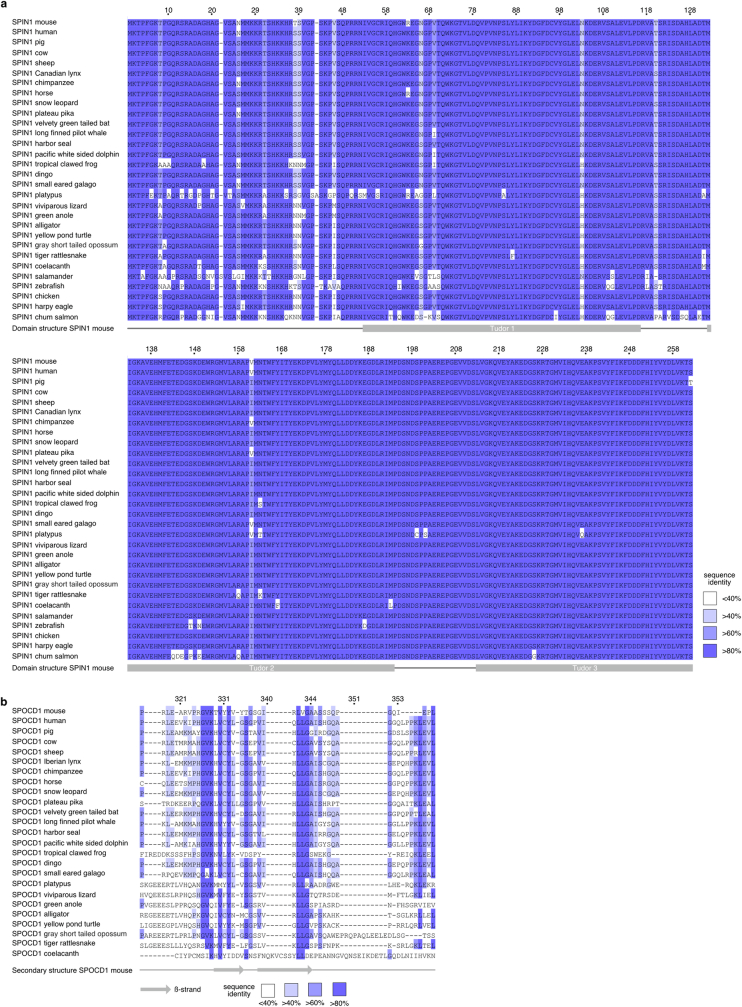
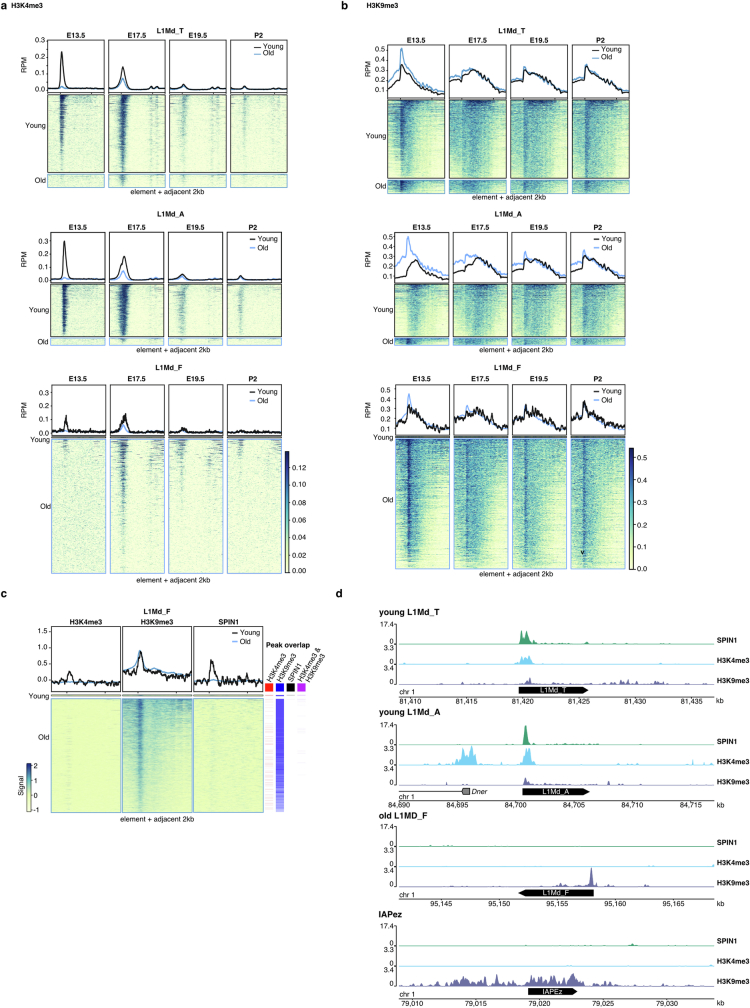
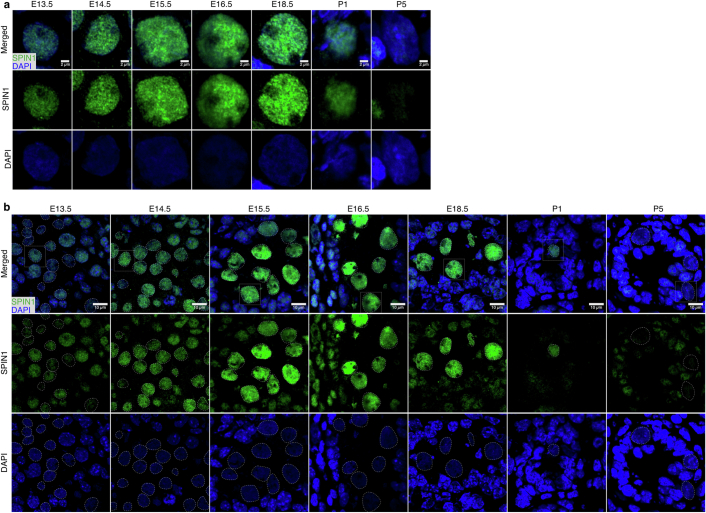
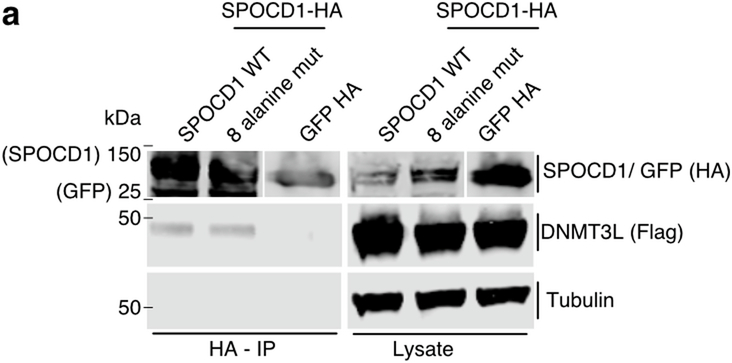
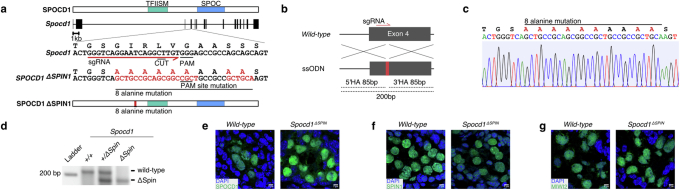
The PIWI-interacting RNA (piRNA) pathway guides the DNA methylation of young, active transposons during germline development in male mice1. piRNAs tether the PIWI protein MIWI2 (PIWIL4) to the nascent transposon transcript, resulting in DNA methylation through SPOCD1 (refs. 2-5). Transposon methylation requires great precision: every copy needs to be methylated but off-target methylation must be avoided. However, the underlying mechanisms that ensure this precision remain unknown. Here, we show that SPOCD1 interacts directly with SPIN1 (SPINDLIN1), a chromatin reader that primarily binds to H3K4me3-K9me3 (ref. 6). The prevailing assumption is that all the molecular events required for piRNA-directed DNA methylation occur after the engagement of MIWI2. We find that SPIN1 expression precedes that of both SPOCD1 and MIWI2. Furthermore, we demonstrate that young LINE1 copies, but not old ones, are marked by H3K4me3, H3K9me3 and SPIN1 before the initiation of piRNA-directed DNA methylation. We generated a Spocd1 separation-of-function allele in the mouse that encodes a SPOCD1 variant that no longer interacts with SPIN1. We found that the interaction between SPOCD1 and SPIN1 is essential for spermatogenesis and piRNA-directed DNA methylation of young LINE1 elements. We propose that piRNA-directed LINE1 DNA methylation requires a developmentally timed two-factor authentication process. The first authentication is the recruitment of SPIN1-SPOCD1 to the young LINE1 promoter, and the second is MIWI2 engagement with the nascent transcript. In summary, independent authentication events underpin the precision of piRNA-directed LINE1 DNA methylation.


Conflict of interest statement

The authors declare no competing interests.

Figures

Fig. 1
Fig. 1. SPOCD1 directly interacts with the chromatin reader SPIN1.
a, MIWI2 (green), haemagglutinin epitope tag (HA, red) and DAPI (blue) staining of E16.5 fetal testis sections from Spocd1HA/+ mice treated with PBS or RNase A before fixation. b, HA (red) and DAPI (blue) staining of E16.5 foetal testis sections from E16.5 Miwi2−/−;Spocd1HA/+ and Miwi2+/−;Spocd1HA/+ mice. Images in a and b are representative of n = 3 biological replicates; scale bars, 2 μm. c, Volcano plot showing enrichment (log2(mean label-free quantification ratio of anti-HA immunoprecipitates from n = 4 Spocd1HA/HA/wild-type) E16.5 fetal testes) and statistical confidence (−log10(P-value of two-sided Student’s t-test)) of proteins co-purifying with HA–SPOCD1 (data from ref. ). d,e, Representative western blot analyses of n = 3 immunoprecipitations of the indicated SPOCD1 constructs with SPIN1 in HEK 293 T cells, for fragments (d) and specific deletions of amino acids (e). F, fragment. f, AlphaFold2 structure prediction of mouse SPOCD1 (B1ASB6) with key domains indicated. g, Representative western-blot analyses of n = 3 immunoprecipitations of the indicated mouse SPOCD1 constructs with SPIN1 from HEK 293 T cells. h, Representative Coomassie gel image of n = 3 co-precipitation experiments with the indicated recombinant proteins. i, Analytical size-exclusion chromatography of the SPOCD1–SPIN1 complex. Top, a representative chromatogram for each of the runs superposed. The Coomassie gels of each run are shown below. Samples from the same set of fractions were loaded on each gel (n = 2). Gel images to scale with chromatogram–elution volume corresponding to the outer lanes indicated by dashed lines. j, Nucleosome pull-down assays with site-specifically modified nucleosomes and recombinant SPIN1–SPOCD1 complex. Western blot images are representative of n = 3 independent pull-down experiments. For whole blot source data of d,e,g,j see Supplementary Fig. 1.
Fig. 2
Fig. 2. The SPOCD1–SPIN1 interaction is conserved.
a, AlphaFold2 co-folding prediction of the interaction between SPIN1 (Q61142) and SPOCD1 (B1ASB6; only amino acids 326–348 are shown). b, Crosslinking mass spectrometry of mouse SPOCD1 fragment 1b (amino acids 203-409) with mouse SPIN1 (amino acids 49–262). Crosslinks are shown in green. c, Phylogenetic tree from ray-finned fishes to mammals showing the presence of SPOCD1 and SPIN1 in the indicated animal clades. d, AlphaFold2 prediction of SPOCD1 from Anolis carolinensis (an anole lizard, XP_008116112.1, amino acids 183–1397), Xenopus tropicalis (frog, XP_031752218.1) and Latimeria chalumnae (coelacanth, JH127468.5). The SPOC domain, TFIIS-M domain and SPIN1-interacting β-hairpin are highlighted. e, Multiple sequence alignment of the SPOCD1 SPIN1-interacting β-hairpin region from different species. Numbering for mouse SPOCD1 is shown above the sequences and secondary-structure elements of mouse SPOCD1 are shown below. Sequences are coloured according to sequence identity. f, Representative Coomassie gel image of n = 3 co-precipitation experiments with the indicated recombinant SPOCD1 from different species with mouse SPIN1.
Fig. 3
Fig. 3. H3K4me3, H3K9me3 and SPIN1 mark young LINE1 elements before de novo genome methylation.
a,b, Metaplot and heat map for different transposon families of H3K4me3 (a) and H3K9me3 (b) ChIP signal in reads per million (RPM) from fetal gonocytes at the indicated time points during mouse development. Data are merged from n = 2 biological replicates, reanalysed from ref. . c, SPIN1 (green) and DAPI (blue) staining of wild-type fetal testis sections from the indicated developmental time points. Images are representative of n = 3 biological replicates. Scale bars, 2 μm. d, Volcano plot showing enrichment (log2(mean label-free quantification ratio of anti-HA immunoprecipitates from Spocd1HA/HA/wild-type)) and statistical confidence (−log10(P-value of two-sided Student’s t-test)) of proteins co-purifying with HA-SPOCD1 from E14.5 fetal testes; n = 3. ei, CUT&Tag data for H3K4me3, H3K9me3 and SPIN1 from E14.5 fetal germ cells. Data are merged from two (H3K4me3, H3K9me3) and three (SPIN1) biological replicates. In eg, metaplot and heatmaps of signal over elements of different transposon families (e) are shown as well as young and old copies in the L1Md_T (f) and L1Md_A (g) families. Columns adjacent to the heatmaps show statistically significant peaks called for SPIN1 and the indicated histone modifications. In e, the overlap of H3K4me3 and H3K9me3 peaks with SPIN1 peaks is significant for L1Md_A (P = 0.0099, Z-score = 1,052), L1Md_T (P = 0.0099, Z-score = 1,398) and L1Md_Gf (P = 0.0099, Z-score = 2,007) by one-tailed permutation tests. In f and g, enrichment of overlapping H3K4me3 and H3K9me3 peaks with SPIN1 peaks is significantly different between young and old L1Md_A (adjusted P < 2.2 × 10−16) and L1Md_T (adjusted P < 2.2 × 10−16) copies, as observed by two-tailed Fisher’s exact test. In h and i, charts show overlap analysis of H3K4me3 and H3K9me3 peaks (h) and SPIN1 peaks (i) with the indicated genomic features. P-values and Z-scores from one-tailed permutation tests to assess the statistical significance of overlaps of CUT&TAG peaks with LINE1 elements are shown.
Fig. 4
Fig. 4. The SPOCD1–SPIN1 interaction is essential for spermatogenesis.
a, Representative western-blot analyses of n = 3 immunoprecipitations of the mouse wild type and eight SPOCD1 alanine mutations (8 Ala mut) with SPIN1 in HEK 293 T cells. For whole-blot source data, see Supplementary Fig. 1. b, Representative Coomassie gel image of n = 3 co-precipitation experiments with the indicated recombinant proteins. ce, Representative images of E16.5 gonocytes from n = 3 wild-type (WT) and Spocd1ΔSPIN1 mice stained for DNA (blue) and SPOCD1 (c), SPIN1 (d) or MIWI2 (e) (green). Scale bars, 2 μm. f, Number of embryos per plug fathered by studs with the indicated genotype mated to wild-type females. Data are mean and s.e.m. from n = 6 wild-type (15 plugs in total) and n = 6 Spocd1ΔSPIN1 studs (12 plugs). g, Testis weight of adult mice with the indicated genotype. Data are mean and s.e.m. from n = 8 wild-type and n = 8 Spocd1ΔSPIN1 mice. Inset, a representative image of testes from wild-type (left) and Spocd1ΔSPIN1 (right) mice. P-values in f and g were determined by unadjusted two-sided Student’s t-test. h, Representative images of PAS and haematoxylin-stained testes sections of wild-type and n = 5 Spocd1ΔSPIN1 adult mice, with different types of spermatogenic arrest observed in the tubules of the Spocd1ΔSPIN1 testes indicated. The percentage of each type of tubule is noted alongside. Scale bar, 20 μm. i,j, Adult testis sections stained for the DNA damage marker γH2AX (red) (i) and apoptotic cells (red) by TUNEL assay (j) from wild-type and Spocd1ΔSPIN1 mice (representative of n = 3 mice per genotype for γH2AX and n = 2 wild-type plus n = 3 Spocd1ΔSPIN1 mice for TUNEL). DNA was stained with DAPI (blue). Scale bars, 100 μm.
Fig. 5
Fig. 5. The SPOCD1–SPIN1 interaction is required for the de novo DNA methylation of young LINE1 elements.
a,b, Representative testis sections of n = 3 wild-type, Spocd1ΔSPIN and Spocd1−/− mice stained red for the LINE1 ORF1p (a) or IAP GAG protein (b). DNA was stained with DAPI (blue). Scale bars, 100 μm. c, RNA-seq heat maps showing fold changes in expression relative to wild type for the ten most upregulated LINE1 and ERVK transposable elements in Spocd1−/− P20 testes (n = 3 from each genotype). ***P < 0.001 of Bonferroni-corrected two-sided Wald’s test assuming n-binominal distribution. Only significant differences (P < 0.05) are shown. dg, Genomic CpG methylation analysis of P14 undifferentiated spermatogonia from wild-type (n = 6), Spocd1ΔSPIN (n = 4) and Spocd1−/− mice (n = 3). d,e, Percentages of CpG methylation levels of the indicated genomic features (with genic, promoter and CpG island (CGI) regions defined as those not overlapping transposable elements, and intergenic regions as those not overlapping transposable elements or genes) or transposable elements (not overlapping genes) are shown as box plots. Boxes represent interquartile range from the 25th to the 75th percentile, the horizontal line shows the median, and whiskers show the data range of the median ± twice the interquartile range. Significant differences (P < 0.05 of Bonferroni-corrected two-tailed Student’s t-tests) of Spocd1ΔSPIN (n = 4) and Spocd1−/− (n = 3) samples to wild-type (n = 6) are indicated. f, Metaplots of mean CpG methylation over the indicated transposable element. *P = 0.05–0.01, **P = 0.01–0.001 and ***P < 0.001 for Bonferroni-corrected two-tailed Student’s t-tests comparing the average CpG methylation of the promoter region to wild type for Spocd1ΔSPIN1 (red) and Spocd1−/− (blue). Only significant differences (P < 0.05) are shown. g, Correlation analysis of mean CpG methylation loss relative to the wild type for individual transposable elements of the indicated LINE1 and ERVK families in relation to their divergence from the consensus sequence in Spocd1ΔSPIN spermatogonia.
Extended Data Fig. 1
Extended Data Fig. 1. SPOCD1’s recruitment to chromatin is independent of MIWI2.
a, MIWI2 (green), HA (red) and DAPI (blue) staining of E16.5 foetal testis sections from Spocd1HA/+ mice treated with PBS or RNase A prior to fixation. b, HA (red) and DAPI (blue) staining of E16.5 foetal testis sections from E16.5 Miwi2−/−;Spocd1HA/+ and Miwi2+/−;Spocd1HA/+ mice. c, d, SPIN1 (green) and DAPI (blue) staining of E16.5 Miwi2+/− and Miwi2−/− E16.5 foetal testis sections. (c) shows a zoom-in of the cell highlighted with a dashed rectangle in (d). Images of (a-d) are representative of n = 3 biological replicates. Scale bars are 5 μm (a), 10 μm (b, d) and 2 µm (c).
Extended Data Fig. 2
Extended Data Fig. 2. Multiple Sequence alignment of SPIN1 and the SPOCD1 ß-hairpin region.
a, Multiple sequences alignment of SPIN1 from representative vertebrates. The domain structure of mouse SPIN1 (Q61142) is indicated underneath the alignment in grey. b, Multiple sequence alignment of the SPOCD1 ß-hairpin region with representative vertebrate SPOCD1 sequences. Secondary structure elements from the AlphaFold2 model of mouse SPOCD1 (B1ASB6) are shown below with grey arrows representing a ß-strand. a-b, sequences are coloured according to sequence identity. Numbering above according to mouse sequence.
Extended Data Fig. 3
Extended Data Fig. 3. H3K4me3, H3K9me3 and SPIN1 mark young LINE1 elements prior to de novo genome methylation.
Metaplot and heat maps of H3K4me3 (a) and H3K9me3 (b) ChIP from foetal gonocytes at the indicated timepoints during mouse development. Data is merged from two biological replicates, reanalysed from. a-b, Panels show H3K4me3 (a) and H3K9me3 (b) ChIP-seq signal in reads per million (RPM) over young and old elements within the indicated LINE1 family. c, Metaplot and heat maps of indicated CUT&Tag signal of H3K4me3, H3K9me3 and SPIN1 over young and old L1MD_F elements. Columns adjacent to the heatmaps show peaks called for SPIN1 and the indicated histone modifications. Data is merged from two (H3K4me3, H3K9me3) and three (SPIN1) biological replicates. a-c, Data depicts element plus adjacent 2 kb for each of the transposon families indicated. d, Genome snapshots showing datatracks of CUT&Tag signal of H3K4me3, H3K9me3 and SPIN1 over selected genome regions containing a young L1Md_A, young L1Md_T, old L1Md_F or IAPEz element. Data is merged from two (H3K4me3, H3K9me3) and three (SPIN1) biological replicates. Enrichment of overlapping H3K4me3 and H3K9me3 peaks with SPIN1 peaks is not significantly different between young and old L1Md_F copies, as observed by a two-tailed Fisher’s exact test.
Extended Data Fig. 4
Extended Data Fig. 4. SPIN1 expression and localization in the developing mouse germline.
a, b, Representative images of sections from n = 3 wild-type foetal testis stained for SPIN1 (green) and DAPI (blue) from indicated timepoints. Cell shown in (a) is highlighted with a white box in (b). Scale bars are 2 μm (a) and 10 μm (b).
Extended Data Fig. 5
Extended Data Fig. 5. The SPOCD1-ΔSPIN1 separation-of-function protein associates with DNMT3L.
a, Representative western blot analyses of n = 3 anti-HA immunoprecipitations of the HA epitope-tagged mouse wild-type, SPOCD1 8 alanine mutated proteins or GFP control with FLAG-tagged DNMT3L in HEK 293 T cells. For whole blot source data, see Supplementary Fig. 1.
Extended Data Fig. 6
Extended Data Fig. 6. Generation of the Spocd1ΔSPIN1 mouse allele.
a, Schematic representations of the mouse Spocd1 locus and encoded 1015 amino acid protein are shown. sgRNA used for generation of the Spocd1ΔSPIN1 allele and adjacent PAM site are indicated. b, Schematic of CRISPR targeting strategy showing the location of single-stranded oligo DNA donor (ssODN) and homology arms (HA) used. c, Schematic representation, and sequencing trace of the part of Spocd1ΔSPIN1 exon 4 harbouring the mutation sites, a 30 bp sequence creating the 8 alanine mutation is highlighted in red. Sequencing was performed on n = 3 animals. d, Representative image of genotyping result for n = 3 Spocd1+/+, Spocd1+/ΔSPIN1 and Spocd1ΔSPIN1 mice. e-g, Representative images of E16.5 gonocytes from n = 3 Spocd1ΔSPIN1 and wild-type control mice stained for SPOCD1 (e), SPIN1 (f) or MIWI2 (g,) in green. DNA was stained with DAPI (blue). Scale bars are 5 μm.

References

    1. Ozata, D. M., Gainetdinov, I., Zoch, A., O’Carroll, D. & Zamore, P. D. PIWI-interacting RNAs: small RNAs with big functions. Nat. Rev. Genet.20, 89–108 (2019). - PubMed
    1. De Fazio, S. et al. The endonuclease activity of Mili fuels piRNA amplification that silences LINE1 elements. Nature480, 259–263 (2011). - PubMed
    1. Schöpp, T. et al. TEX15 is an essential executor of MIWI2-directed transposon DNA methylation and silencing. Nat. Commun.11, 3739 (2020). - PMC - PubMed
    1. Zoch, A. et al. SPOCD1 is an essential executor of piRNA-directed de novo DNA methylation. Nature584, 635–639 (2020). - PMC - PubMed
    1. Zoch, A. et al. C19ORF84 connects piRNA and DNA methylation machineries to defend the mammalian germ line. Mol Cell10.1016/j.molcel.2024.01.014 (2024). - PMC - PubMed

MeSH terms