. 2024 Oct;634(8032):48-52.
doi: 10.1038/s41586-024-07927-7. Epub 2024 Sep 18.

Space radiation measurements during the Artemis I lunar mission

Affiliations

Space radiation measurements during the Artemis I lunar mission

Stuart P George et al. Nature. 2024 Oct.

Abstract

Space radiation is a notable hazard for long-duration human spaceflight1. Associated risks include cancer, cataracts, degenerative diseases2 and tissue reactions from large, acute exposures3. Space radiation originates from diverse sources, including galactic cosmic rays4, trapped-particle (Van Allen) belts5 and solar-particle events6. Previous radiation data are from the International Space Station and the Space Shuttle in low-Earth orbit protected by heavy shielding and Earth's magnetic field7,8 and lightly shielded interplanetary robotic probes such as Mars Science Laboratory and Lunar Reconnaissance Orbiter9,10. Limited data from the Apollo missions11-13 and ground measurements with substantial caveats are also available14. Here we report radiation measurements from the heavily shielded Orion spacecraft on the uncrewed Artemis I lunar mission. At differing shielding locations inside the vehicle, a fourfold difference in dose rates was observed during proton-belt passes that are similar to large, reference solar-particle events. Interplanetary cosmic-ray dose equivalent rates in Orion were as much as 60% lower than previous observations9. Furthermore, a change in orientation of the spacecraft during the proton-belt transit resulted in a reduction of radiation dose rates of around 50%. These measurements validate the Orion for future crewed exploration and inform future human spaceflight mission design.


Conflict of interest statement

The authors declare no competing interests.

Figures
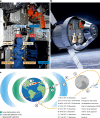
Fig. 1
Fig. 1. Artemis I instruments and radiation environments.
a, Radiation instrumentation and phantoms inside Orion. These consist of the NASA HERA system, the ESA EAD system, as well as the NASA CAD and DLR M-42 instruments. The HERA system and the EADs were hard-mounted at various distinctly shielded locations in Orion. CAD and M-42 were placed on the front and back surfaces (skin) and inside (organs) (M-42) of the MARE phantoms (Extended Data Figs. 1–4). b, Placement of the instrumentation and hardware inside the Orion spacecraft. c, The Orion flight profile with respect to radiation for the NASA Artemis I mission. After launch at 06:47 UTC on 16 November 2022, Orion passed the inner (proton-dominated) and outer (electron-dominated) Earth radiation belts. Orion then ventured into interplanetary space dominated by GCRs. It passed the Moon twice on 21 November (first lunar fly-by at a distance of 130 km) and on 5 December (second lunar fly-by at a distance of 128 km). During these fly-bys, the Moon acts as a shield against GCRs. Orion re-entered Earth’s atmosphere over the South Pole and landed in the Pacific Ocean close to San Diego, California on 11 December 2022 at 17:40 UTC.
Fig. 2
Fig. 2. Absorbed dose measurements on Artemis I.
a, Inner (proton-dominated) and outer (electron-dominated) belt passes as measured with the HERA, EAD and M-42 instruments. Differences in dose rate during the passes are attributed to the local shielding environments in which the detectors are placed. MU01 and HSU2 being mounted on the Orion wall have the lowest shielding. HSU1 mounted in the Orion ‘storm shelter’ has higher shielding and SN127 located at the back of the Helga phantom has the highest shielding, owing to its placement under the phantom. b,c, GCR dose rates for HERA and M-42 (b) and EAD and CAD for the interplanetary part of the mission (c). d, Cumulative doses for the belt passes for HERA, EAD, M-42 and CAD dominated by the proton-belt crossings (07:12–07:42 UTC), with only small contributions from the electron-belt crossing (08:45–10:45 UTC). e, Cumulative whole-mission dose values for HERA, EAD, M-42 and CAD reaching up to 13.47 mGy for HSU2 (Extended Data Table 1). f,g, First (f) and second (g) lunar fly-bys with the reduction in GCR dose rate owing to the shielding effect of the Moon. Source Data
Fig. 3
Fig. 3. Unexpected dose decrease during the inner-belt pass.
a, Orion spacecraft pitch (up and down with respect to the nose/docking adapter of the Orion capsule) and yaw (left and right) angle. b, Measured absorbed dose rate from HERA HSU2 and modelled AP9-IRENE proton flux. c, Measured particle polar angle distribution from HERA HSU2. Ninety degrees corresponds to the long axis of the spacecraft. d, The Orion spacecraft with upper stage attached shown in relation to the magnetic-field vector and the particle trajectories. Individual particles rotate in tight spirals around the magnetic-field line, forming a ‘plane’ of radiation. The observed dose-rate drop is interpreted as the vehicle rotating its heavily shielded axis through this plane. Source Data
Fig. 4
Fig. 4. Inner, outer and GCR spectra from M-42 and HERA.
a, Energy deposition (Edep, in F cm−2 s−1 MeV−1) spectra measured by M-42 SN126 for the inner (1) and outer (2) belt passes and for the subsequent free-space GCR environment (3). The inner-belt spectra peak at approximately 350 keV energy deposition in Si owing to the dominant proton contribution, whereas the peak for the outer belt is at roughly 70 keV in Si owing to the dominant electron (X-ray) contribution. b, LET spectra (in water) for the three flight phases inner belt, outer belt and GCRs, as shown in a from the HERA HSU2 instrument. The LET spectra are shown as a lethargy-style representation to preserve the area-normalization feature of the histogram across the logarithmic x axis. Source Data
Extended Data Fig. 1
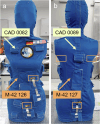
Extended Data Fig. 1. The MARE Helga phantom with mounted radiation detectors.
The phantom front side (a) and back side (b) are covered with a blue poncho made of flame-retardant Nomex material, which includes pockets for the placement of the radiation detectors. CAD 0082 and M-42 SN126 were placed on the front side (skin) of the Helga phantom (lesser shielding) and CAD 0089 and M-42 SN127 were placed at the back side (skin) of the radiation phantom (higher shielding). Also, five M-42 instruments were placed with the detector head inside the most radiation-sensitive organs of the phantom (orange rectangles), namely, the left (SN144) and right (SN145) lungs, stomach (SN146), uterus (SN147) and spine (SN148). The relevant detector heads of the M-42 instruments inside the phantom are connected with a silver cable to the readout electronics, which are positioned inside the blue poncho pockets.
Extended Data Fig. 2
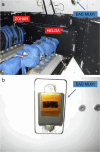
Extended Data Fig. 2. EAD MU01 placement in Orion.
a, EAD MU01 was hard-mounted on the outer wall of Orion and is shown in relation to the MARE radiation phantoms Helga and Zohar. b, EAD MU01 (zoomed-in view) as hard-mounted at a low-shielding location on a blank wall in sector D inside Orion.
Extended Data Fig. 3
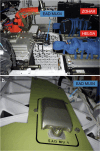
Extended Data Fig. 3. EAD MU04 placement in Orion.
a, EAD MU04 was hard-mounted close to the HERA HPU and shown in relation to the MARE radiation phantoms Helga and Zohar. b, EAD MU04 (zoomed-in view) as hard-mounted at a high-shielding location below the seats in the storm shelter of Orion.
Extended Data Fig. 4
Extended Data Fig. 4. The NASA HERA system.
a, HERA system with ruler for reference. The large box is the HPU, the smaller boxes are the two HSUs. b, HERA system with ‘lids open’ during calibration. The small gold boxes contain the Timepix detectors, visible as the mirror-like surfaces. HERA HSU1 is mounted in the storm shelter (high-shielded location) of Orion, HSU2 is in the crew cabin (lower shielded location). The HPU is contained inside the life support avionics box and is the most shielded HERA sensor.
Extended Data Fig. 5
Extended Data Fig. 5. Modelled proton pitch-angle distribution for Artemis I inner-belt transit.
The pitch-angle distribution was calculated with the AP9-IRENE radiation belt model run over the Artemis I trajectory through the inner proton belt.
Extended Data Fig. 6
Extended Data Fig. 6. Shielding distributions for the HERA HPU, HSU1 and HSU2 sensors.
The shielding distributions were calculated from a detailed computer-aided design model of the Orion vehicle, through which 10,000 equidistant rays were traced from each detector location. The amount of material along each ray was then calculated and normalized to areal density. To obtain the aluminium equivalent thickness, we can divide the x axis by the density of aluminium (2.7 g cm−3). Owing to its dense construction, Orion is a heavily shielded vehicle, with 80% of rays to the HSU1 location in the storm shelter having more than 20 g cm−2 (7.4 cm of aluminium equivalent thickness).
Extended Data Fig. 7
Extended Data Fig. 7. Comparisons of space radiation GCR data and simulations.
a, Table of relevant dose quantities as the absorbed dose rate (D in mGy day−1), the mean quality factor <Q> and the dose equivalent rate (H in mSv day−1) as measured with the three HERA sensors and the relevant calculated values applying the OLTARIS, HZETRN and Geant4 codes. Calculations for the HERA sensors are based on the ray-traced shielding locations as provided in Extended Data Fig. 6. b, Comparison of Geant4 Monte Carlo-simulated GCR LET spectra in silicon and measured data for the HPU (the most shielded sensor). Note, that LET spectra are shown as a lethargy-style representation to preserve the area-normalization feature of the histogram across the logarithmic x axis. Source Data

References

    1. Patel, Z. S. et al. Red risks for a journey to the red planet: the highest priority human health risks for a mission to Mars. npj Microgravity6, 33 (2020). - PMC - PubMed
    1. Sishc, B. J. et al. The need for biological countermeasures to mitigate the risk of space radiation-induced carcinogenesis, cardiovascular disease, and central nervous system deficiencies. Life Sci. Space Res.35, 4–8 (2022). - PubMed
    1. Parsons, J. L. & Townsend, L. W. Interplanetary crew dose rates for the August 1972 solar particle event. Radiat. Res.153, 729–733 (2000). - PubMed
    1. Mewaldt, R. A. et al. Record-setting cosmic-ray intensities in 2009 and 2010. Astrophys. J. Lett723, L1 (2010).
    1. Selesnick, R. S., Baker, D. N., Kanekal, S. G., Hoxie, V. C. & Li, X. Modeling the proton radiation belt with Van Allen Probes relativistic electron-proton telescope data. J. Geophys. Res. Space Phys.123, 685–697 (2018).

LinkOut - more resources